Experiment Documentation Settings
The EXPERIMENT DOCUMENTATION tab in EXPERT SETTINGS configures AutoDoc report generation, model performance analysis, and model interpretation features. This tab allows you to customize how Driverless AI creates comprehensive documentation, analyzes model performance, and provides interpretability insights for your machine learning experiments.
Experiment Documentation Tab Sub-Categories
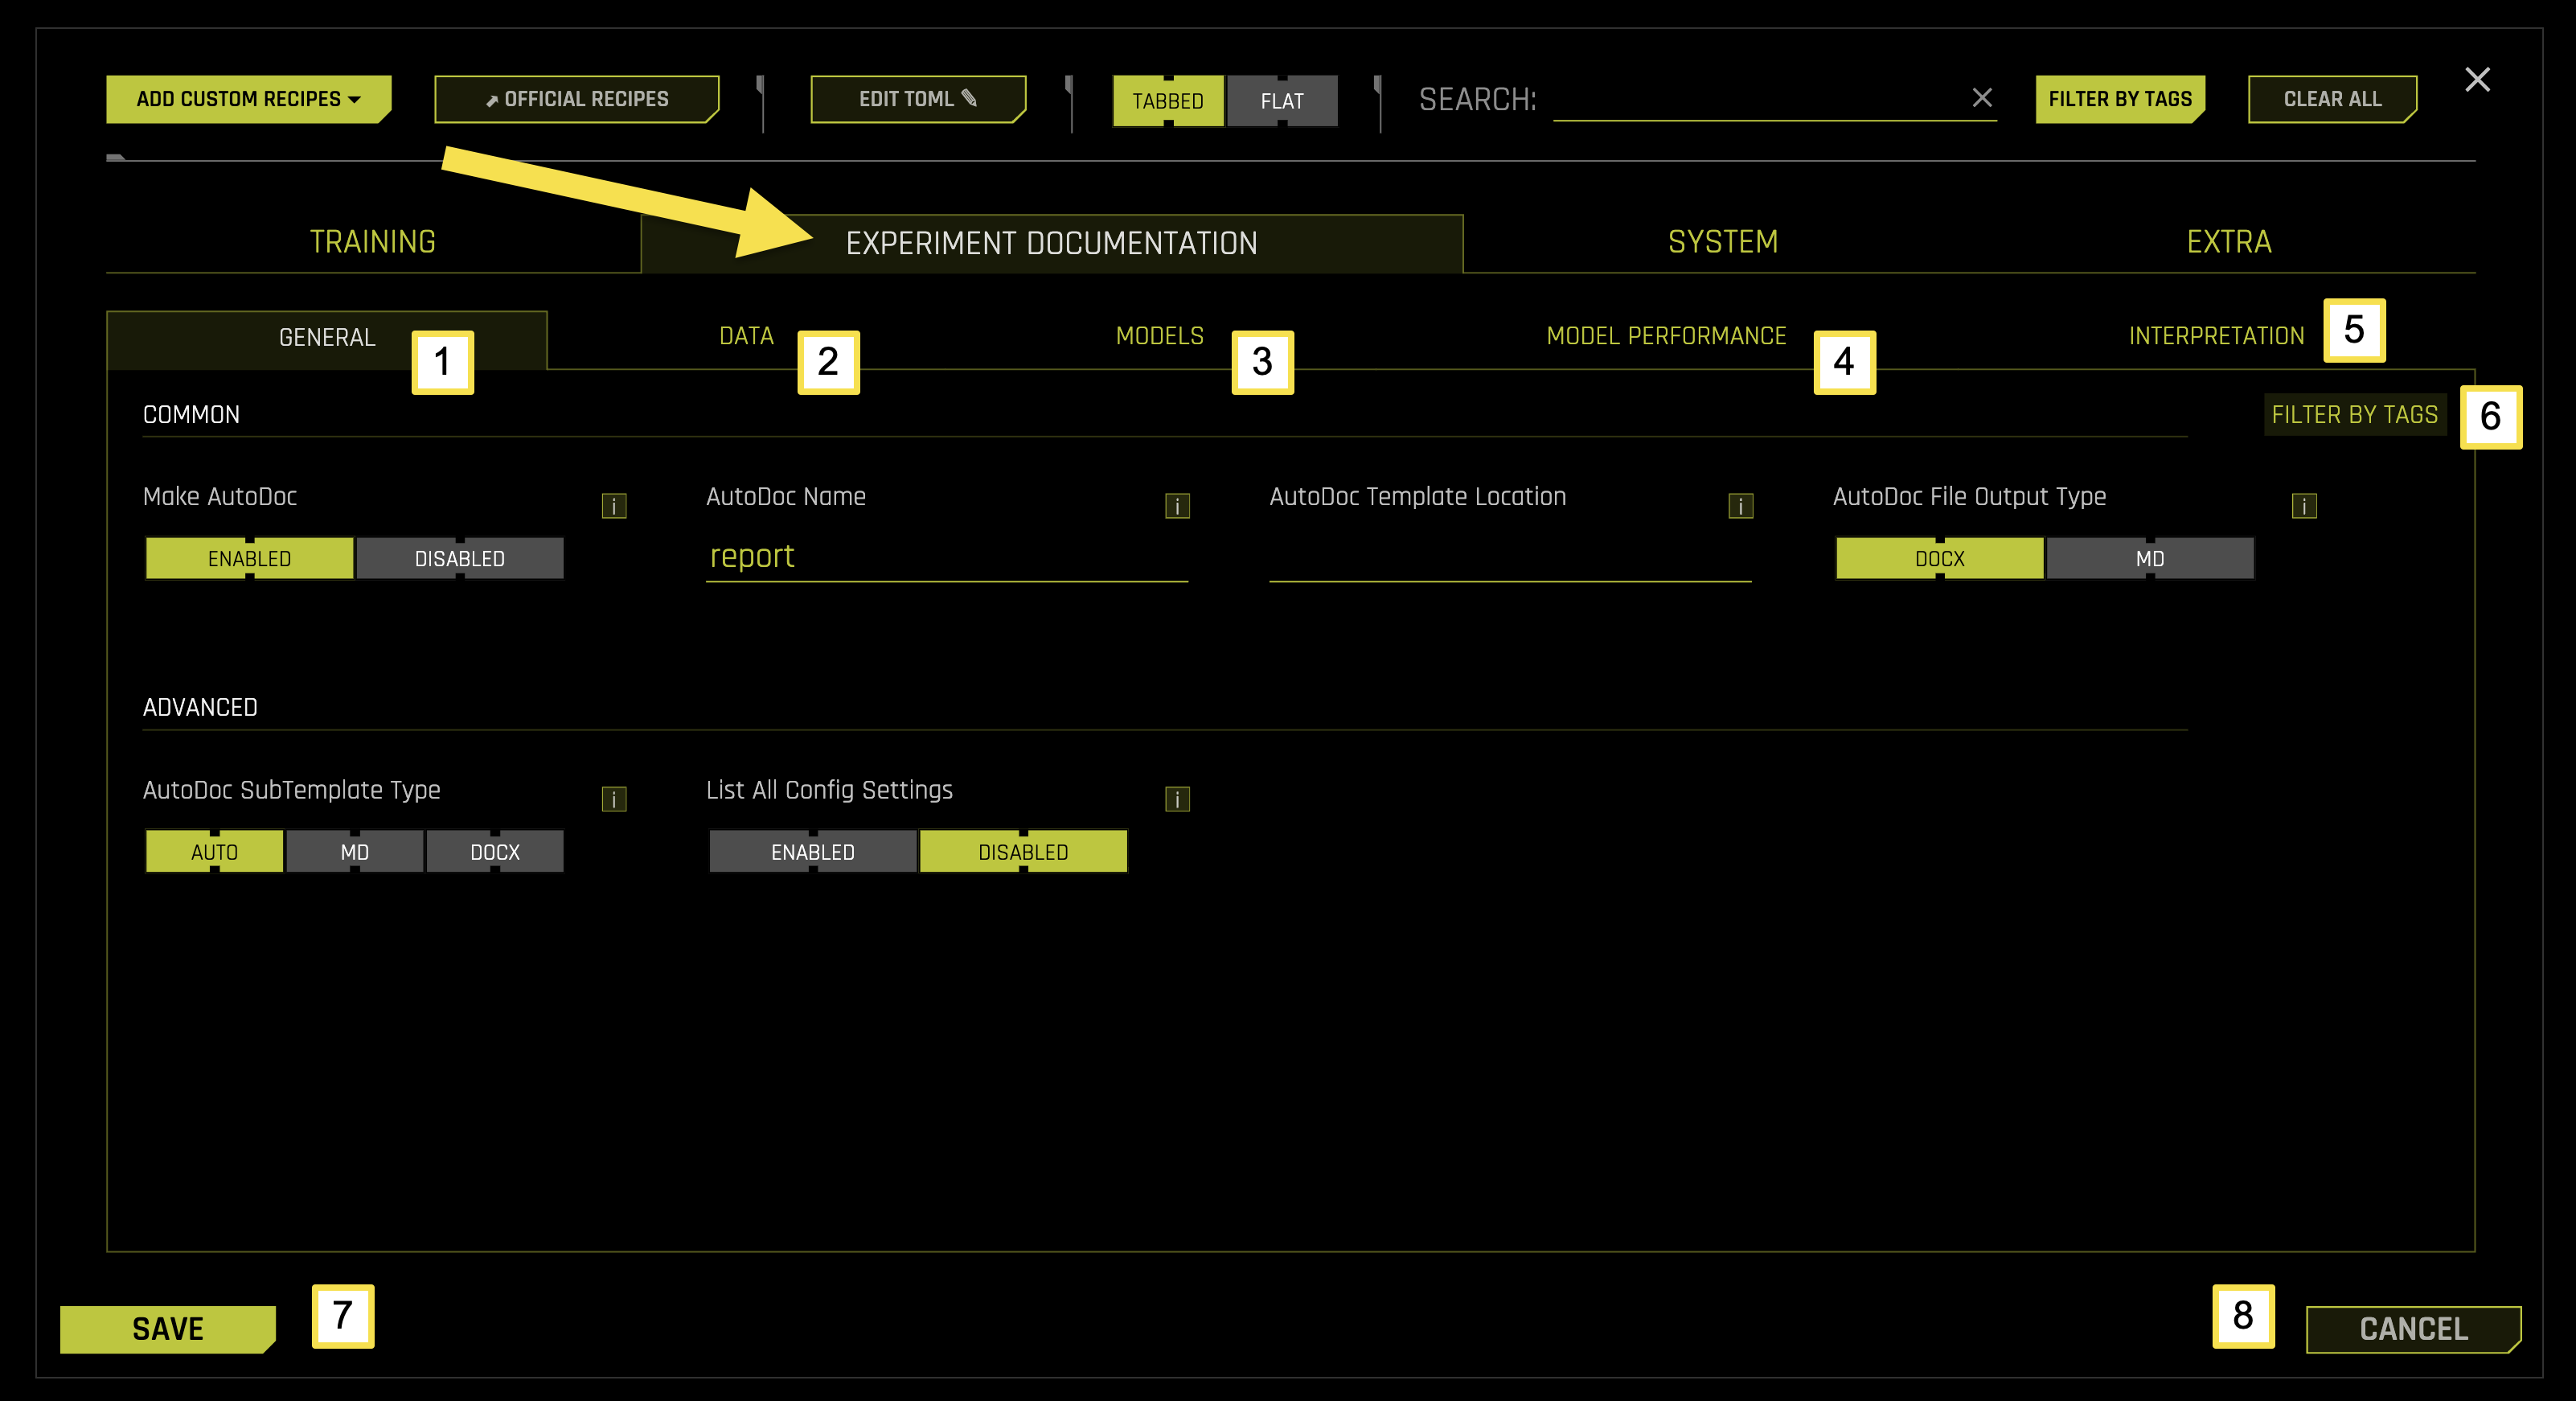
The EXPERIMENT DOCUMENTATION tab is organized into five main sub-categories, each focusing on specific aspects of the documentation process during your machine learning experiments.
To access these settings, navigate to EXPERT SETTINGS > EXPERIMENT DOCUMENTATION tab from the Experiment Setup page.
The following table describes the actions you can take from the EXPERIMENT DOCUMENTATION page:
Sub-Category |
Description |
|---|---|
[1] General |
Configure AutoDoc report generation, file naming, template selection, and output format preferences |
[2] Data |
Configure data analysis documentation, summary tables, histograms, and transformation recommendations |
[3] Models |
Configure model architecture documentation, feature importance display, and GLM coefficient tables |
[4] Model Performance |
Configure performance metrics, validation statistics, confusion matrices, and stability analysis |
[5] Interpretation |
Configure model interpretability features, Shapley values, PDP plots, and feature importance analysis |
[6] Filter by Tags |
Filter and organize documentation settings using custom tags and labels |
[7] Save |
Save all documentation configuration changes |
[8] Cancel |
Cancel changes and revert to previous configuration settings |
General
The General sub-tab configures core AutoDoc settings, report generation preferences, and general documentation options for your experiments.
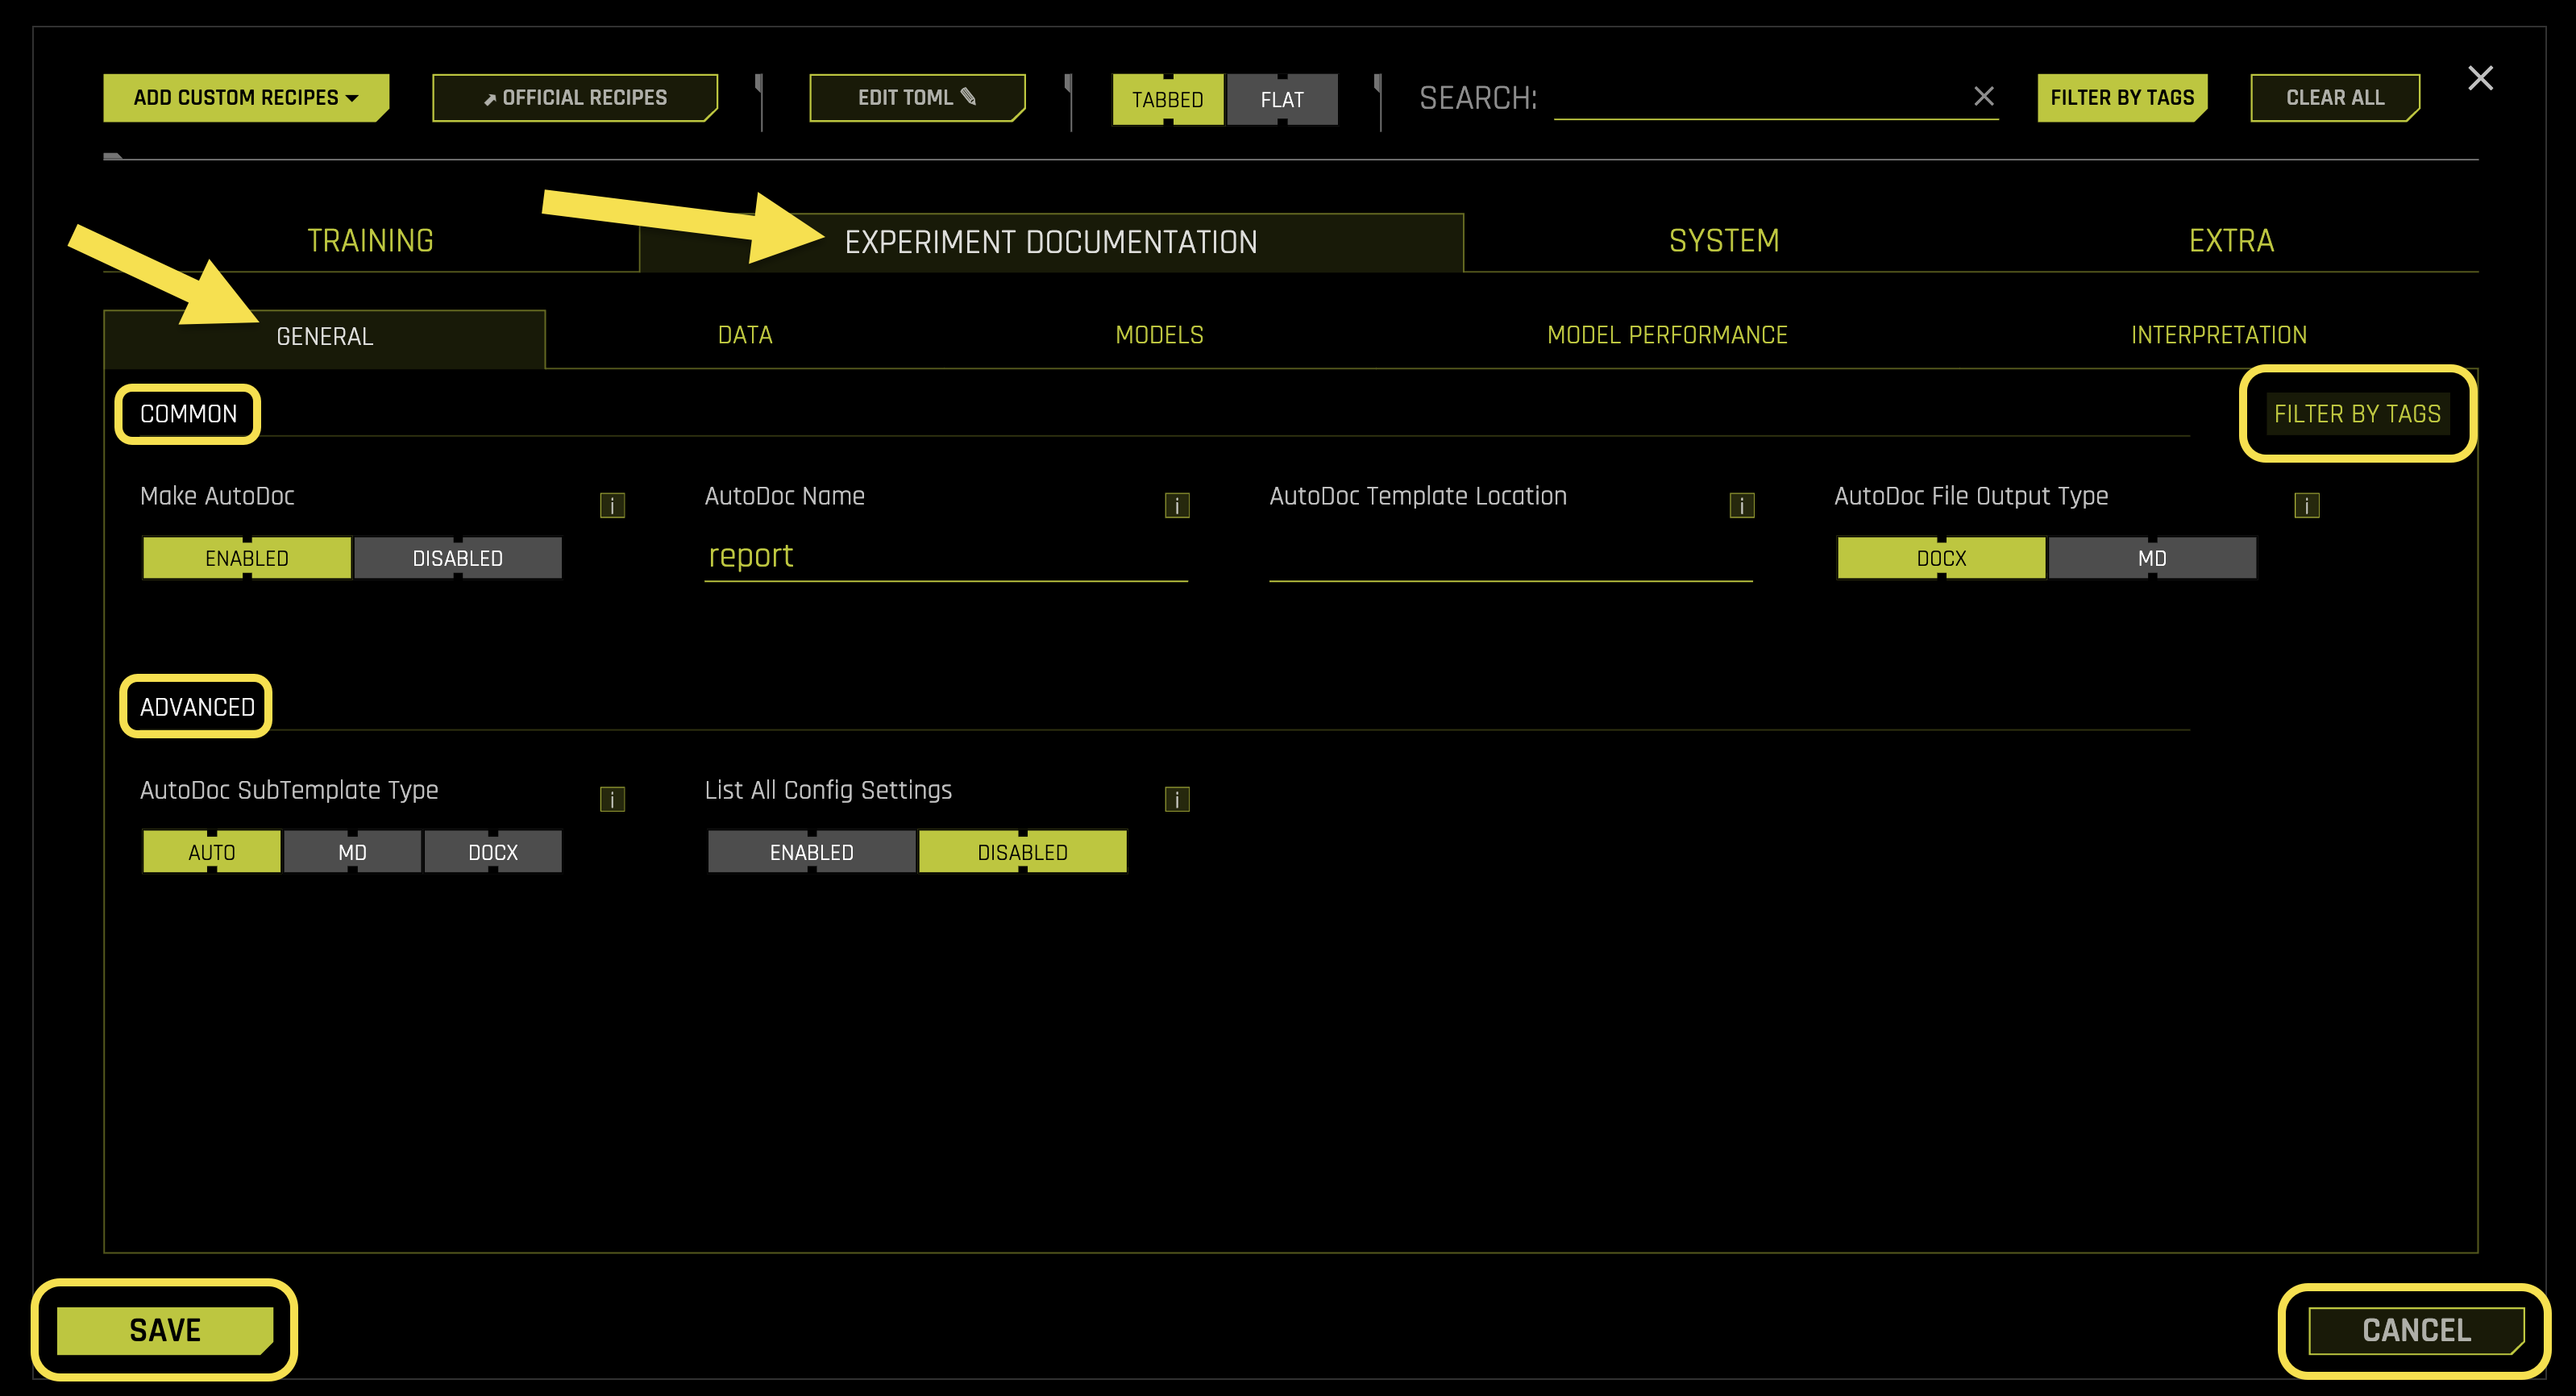
Common Settings:
- Make AutoDoc
What it does: Controls whether to generate AutoDoc reports after the experiment completes
Purpose: Creates comprehensive documentation including model performance, data analysis, and interpretability insights
- Available options:
Enabled: Generates AutoDoc report (default)
Disabled: Skips AutoDoc generation
Requires: Boolean toggle (default: Enabled)
- AutoDoc Name
What it does: Sets the name for the AutoDoc report file
Purpose: Customizes the output filename for the generated documentation
Default value: “report”
File extension: Added automatically based on output type setting
Requires: String value (default: “report”)
- AutoDoc Template Location
What it does: Specifies the file path to a custom AutoDoc template
Purpose: Allows use of custom templates for personalized report generation
Template format: Supports custom template files for tailored documentation
Empty value: Uses the default Driverless AI template
Requires: String path (default: “”)
- AutoDoc File Output Type
What it does: Controls the output format for the AutoDoc report
Purpose: Determines the file format of the generated documentation
- Available options:
DOCX: Microsoft Word document format (default)
MD: Markdown format for text-based documentation
Requires: String selection (default: “DOCX”, options: “DOCX”, “MD”)
Advanced Settings:
- AutoDoc SubTemplate Type
What it does: Specifies the sub-template type for AutoDoc generation
Purpose: Controls the specific template variant used for report generation
- Available options:
AUTO: Automatically selects the appropriate sub-template (default)
MD: Forces markdown sub-template
DOCX: Forces Word document sub-template
Requires: String selection (default: “AUTO”, options: “AUTO”, “MD”, “DOCX”)
- List All Config Settings
What it does: Controls whether to include all configuration settings in the AutoDoc report
Purpose: Determines if the complete experiment configuration is documented
- Available options:
Enabled: Includes all configuration settings in documentation
Disabled: Excludes configuration settings from documentation (default)
Use case: Useful for sharing experiment details with team members
Requires: Boolean toggle (default: Disabled)
Data
The Data sub-tab manages data analysis documentation, dataset quality reporting, and data exploration settings for your experiments.
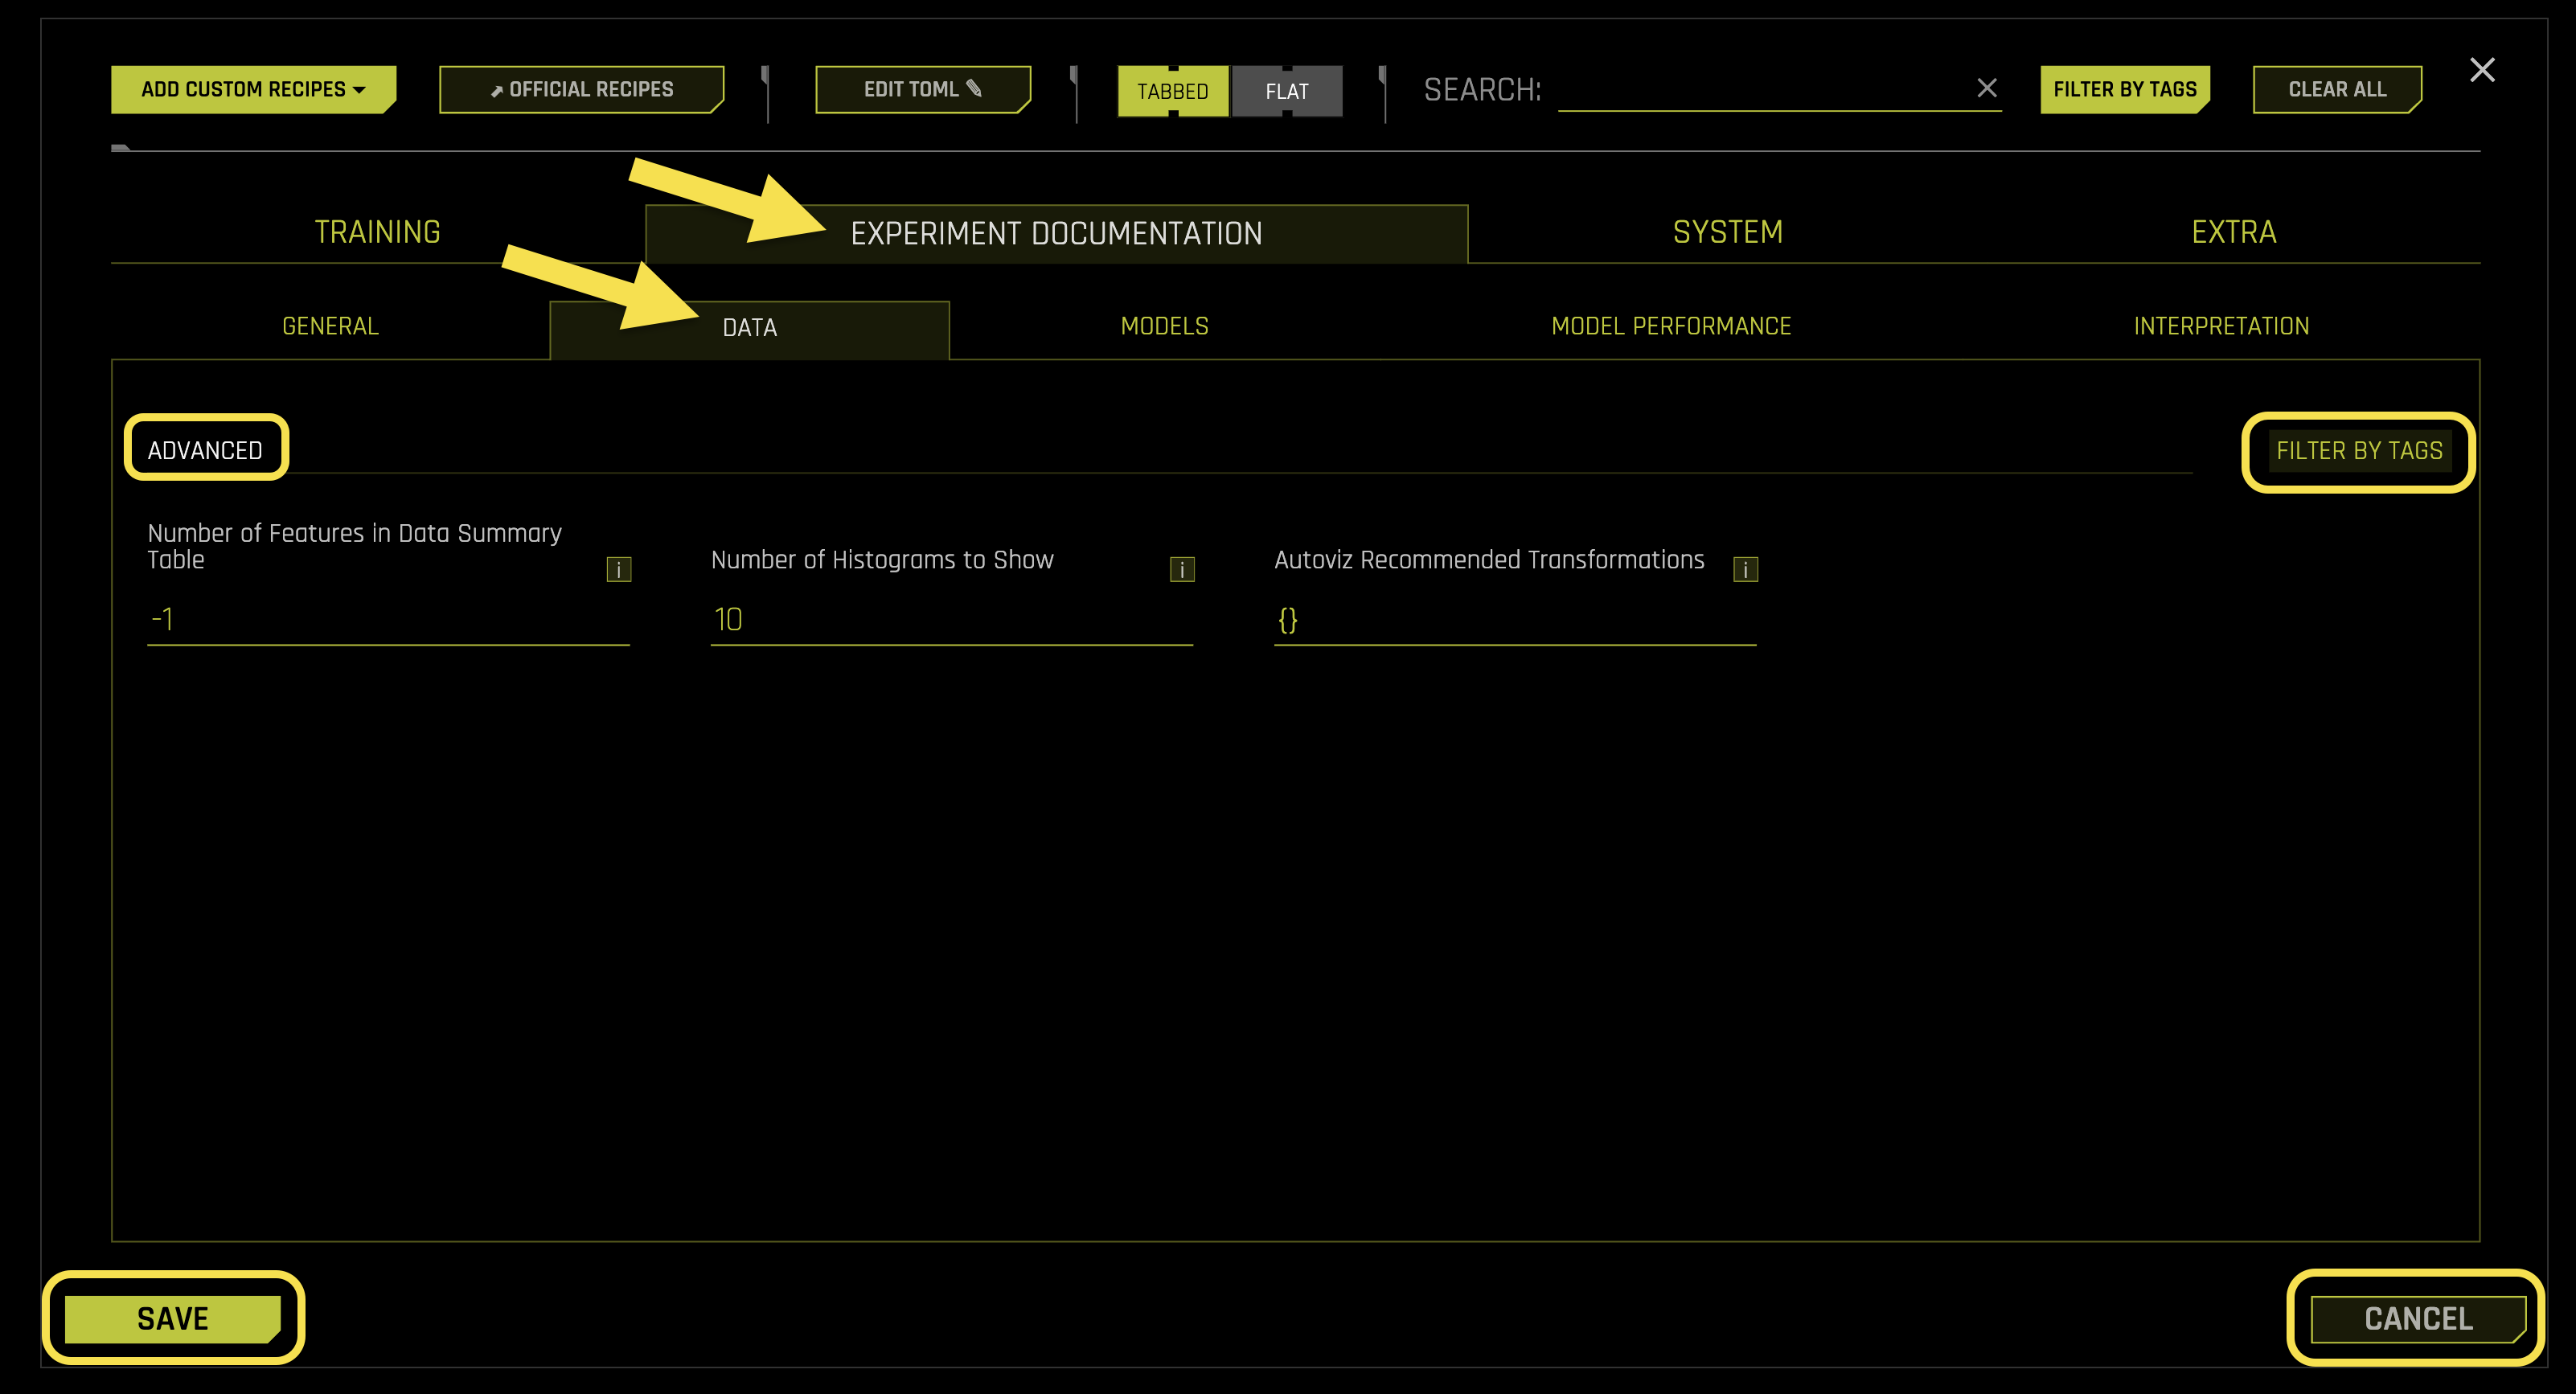
Advanced Settings:
- Number of Features in Data Summary Table
What it does: Sets the number of features to include in the data summary table (-1 = all features)
Purpose: Controls the size and scope of the data summary section in AutoDoc reports
Auto mode (-1): Includes all features in the summary table
Requires: Integer value (default: -1)
- Number of Histograms to Show
What it does: Sets the maximum number of histograms to display in the data analysis section
Purpose: Controls the visual complexity of the data documentation
Performance: Limits the number of histogram plots to avoid overwhelming reports
Requires: Integer value (default: 10)
- Autoviz Recommended Transformations
What it does: Specifies recommended data transformations for automatic visualization
Purpose: Customizes the data transformation suggestions in AutoDoc reports
Format: Dictionary of transformation recommendations
Empty value: Uses default transformation recommendations
Requires: Dictionary format (default: {})
Models
The Models sub-tab configures model documentation, performance metrics display, and model comparison settings for your experiments.
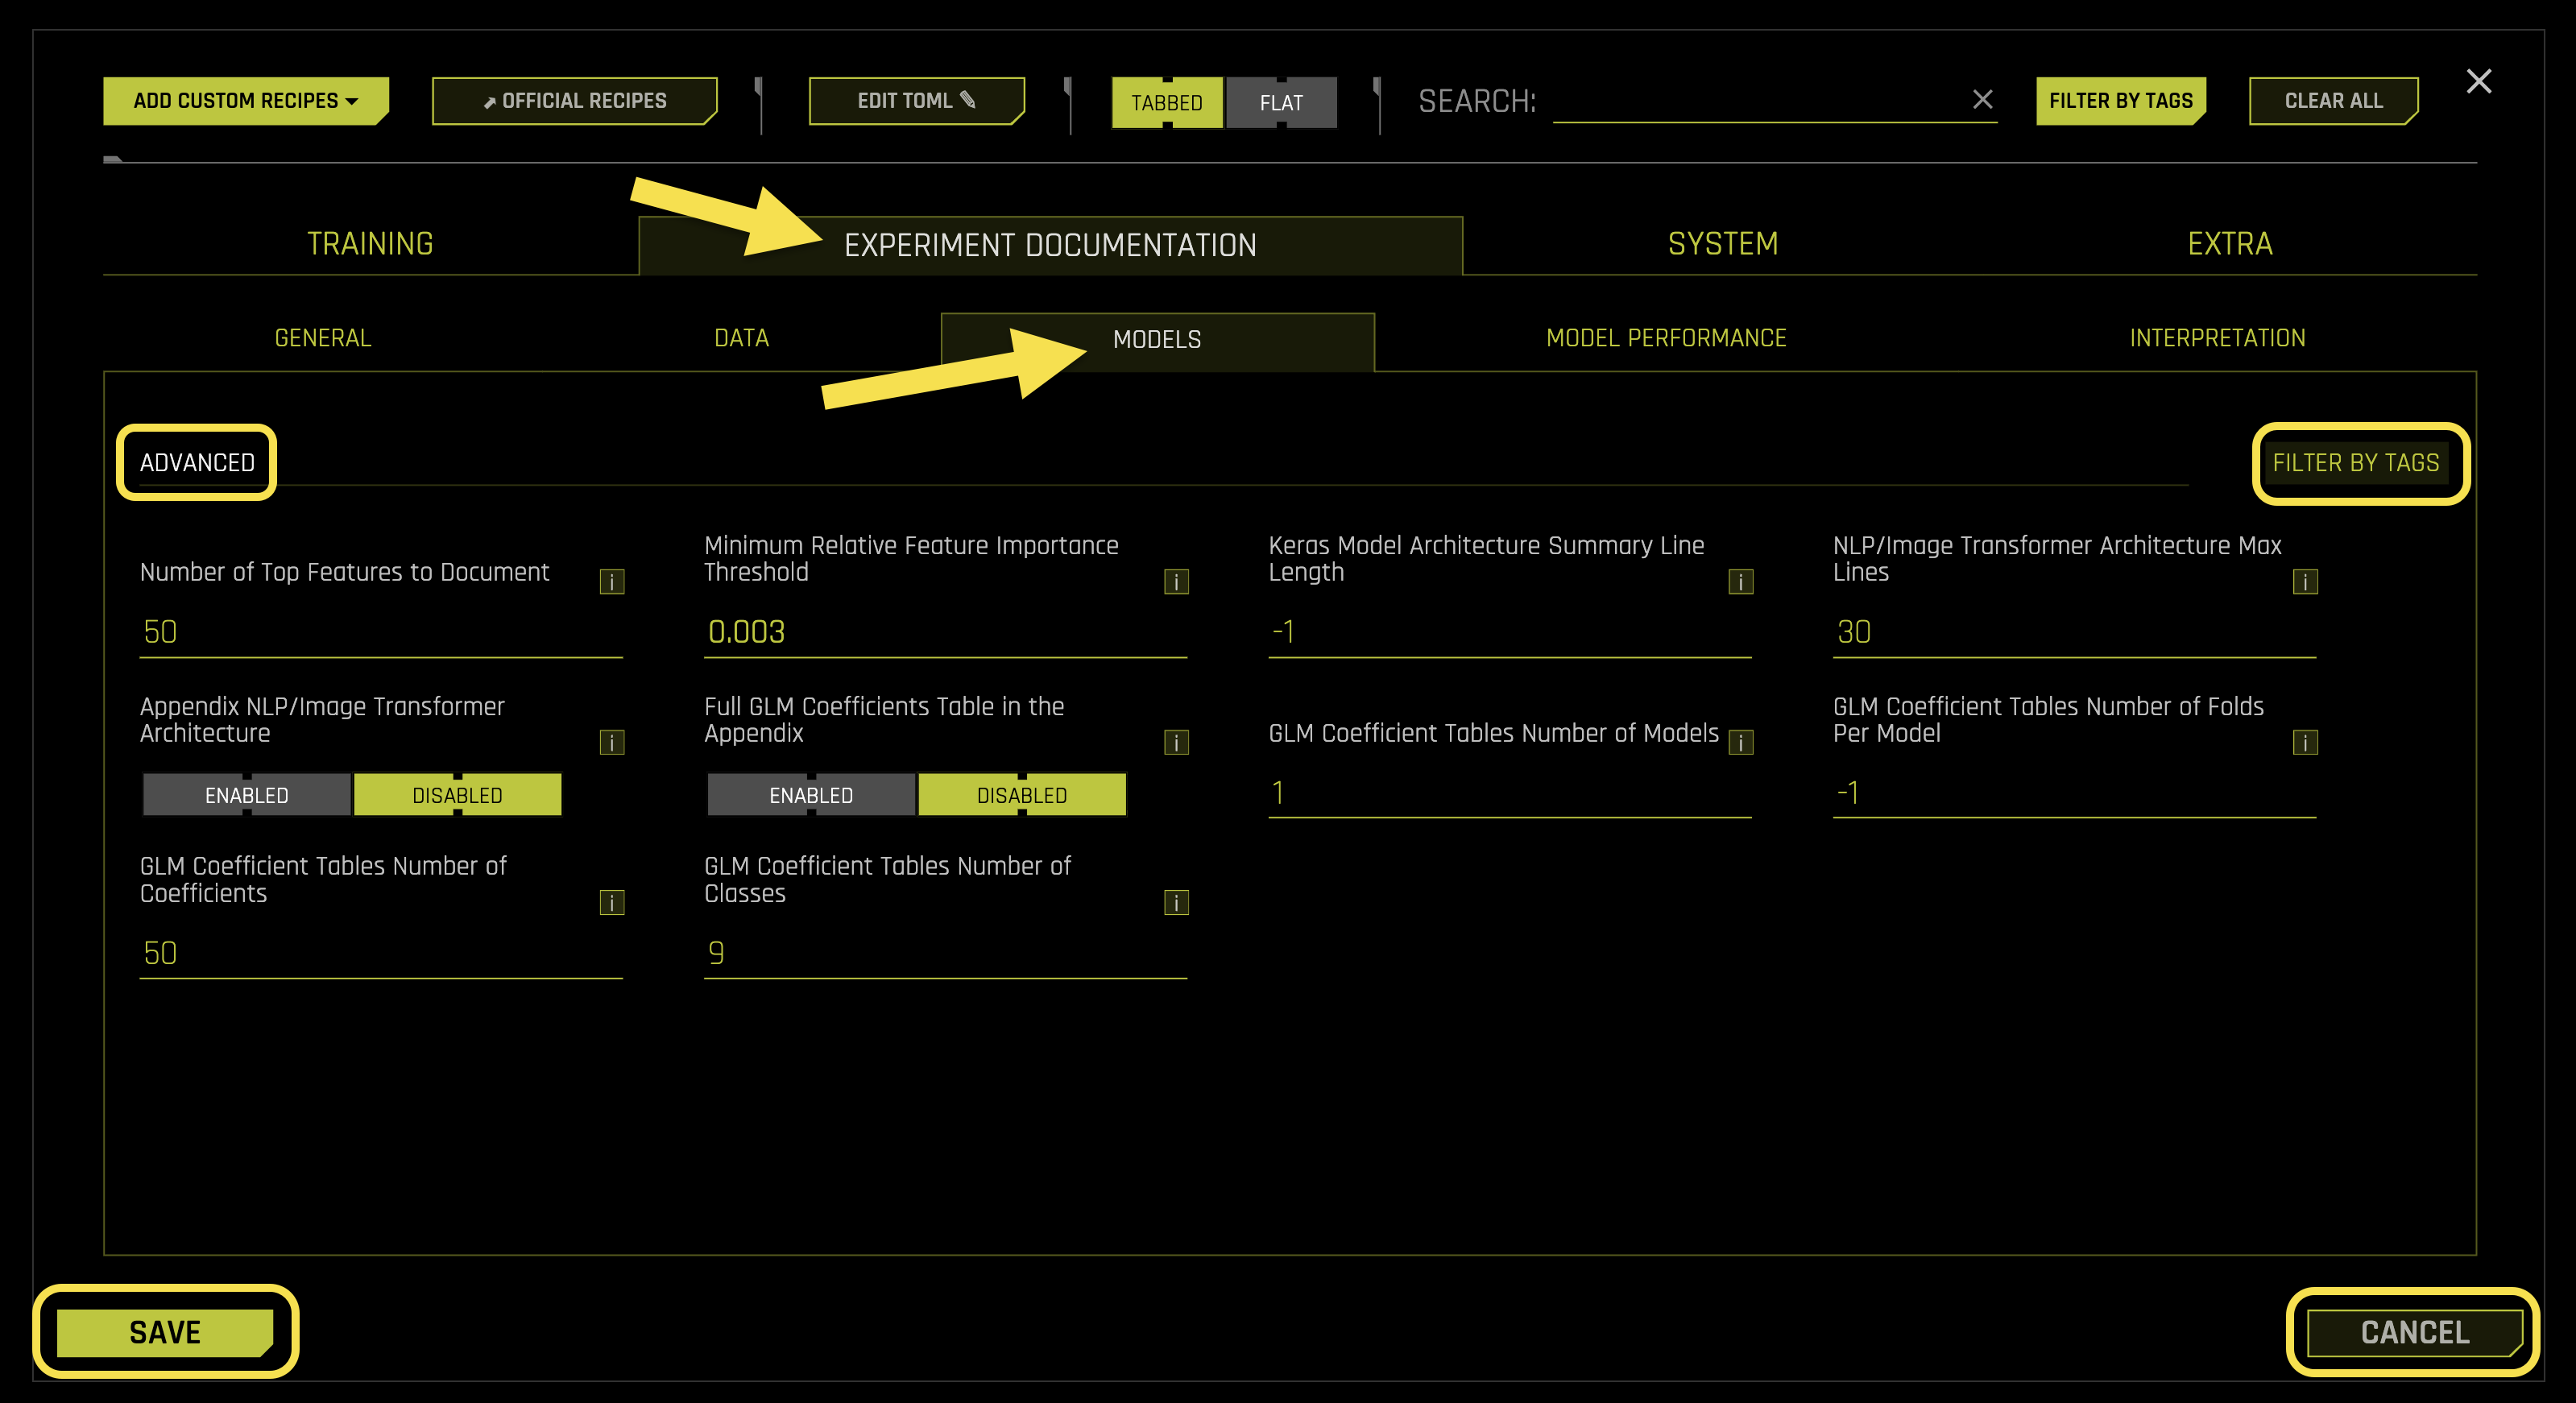
Advanced Settings:
- Number of Top Features to Document
What it does: Sets the number of top-performing features to include in model documentation
Purpose: Controls the depth of feature importance documentation in AutoDoc reports
Focus: Highlights the most significant features for model interpretability
Requires: Integer value (default: 50)
- Minimum Relative Feature Importance Threshold
What it does: Sets the minimum threshold for feature importance to be included in documentation
Purpose: Filters out low-importance features to focus on meaningful contributors
Quality control: Ensures only relevant features are documented
Requires: Float value (default: 0.003)
- Keras Model Architecture Summary Line Length
What it does: Controls the line length for Keras model architecture summaries (-1 = no limit)
Purpose: Formats neural network architecture documentation for readability
Auto mode (-1): Uses unlimited line length
Requires: Integer value (default: -1)
- NLP/Image Transformer Architecture Max Lines
What it does: Sets the maximum number of lines to display for transformer architecture summaries
Purpose: Limits the size of complex model architecture documentation
Performance: Prevents overly verbose transformer documentation
Requires: Integer value (default: 30)
- Appendix NLP/Image Transformer Architecture
What it does: Controls whether to include detailed transformer architecture in the appendix
Purpose: Provides comprehensive model architecture documentation
- Available options:
Enabled: Includes detailed transformer architecture in appendix
Disabled: Excludes transformer architecture from appendix (default)
Requires: Boolean toggle (default: Disabled)
- Full GLM Coefficients Table in the Appendix
What it does: Controls whether to include complete GLM coefficient tables in the appendix
Purpose: Provides detailed statistical information for Generalized Linear Models
- Available options:
Enabled: Includes full coefficient tables in appendix
Disabled: Excludes full coefficient tables from appendix (default)
Requires: Boolean toggle (default: Disabled)
- GLM Coefficient Tables Number of Models
What it does: Sets the number of GLM models to include in coefficient tables
Purpose: Controls the scope of GLM coefficient documentation
Use case: Useful for ensemble models with multiple GLM components
Requires: Integer value (default: 1)
- GLM Coefficient Tables Number of Folds Per Model
What it does: Sets the number of cross-validation folds per model in coefficient tables (-1 = all folds)
Purpose: Controls the depth of cross-validation coefficient documentation
Auto mode (-1): Includes all available folds
Requires: Integer value (default: -1)
- GLM Coefficient Tables Number of Coefficients
What it does: Sets the maximum number of coefficients to display in GLM tables
Purpose: Limits the size of coefficient documentation for large models
Performance: Prevents overwhelming documentation with too many coefficients
Requires: Integer value (default: 50)
- GLM Coefficient Tables Number of Classes
What it does: Sets the maximum number of classes to include in GLM coefficient tables
Purpose: Controls the scope of multi-class GLM documentation
Use case: Useful for classification problems with many classes
Requires: Integer value (default: 9)
Model Performance
The Model Performance sub-tab manages detailed performance analysis, validation metrics, and comprehensive performance reporting for your experiments.
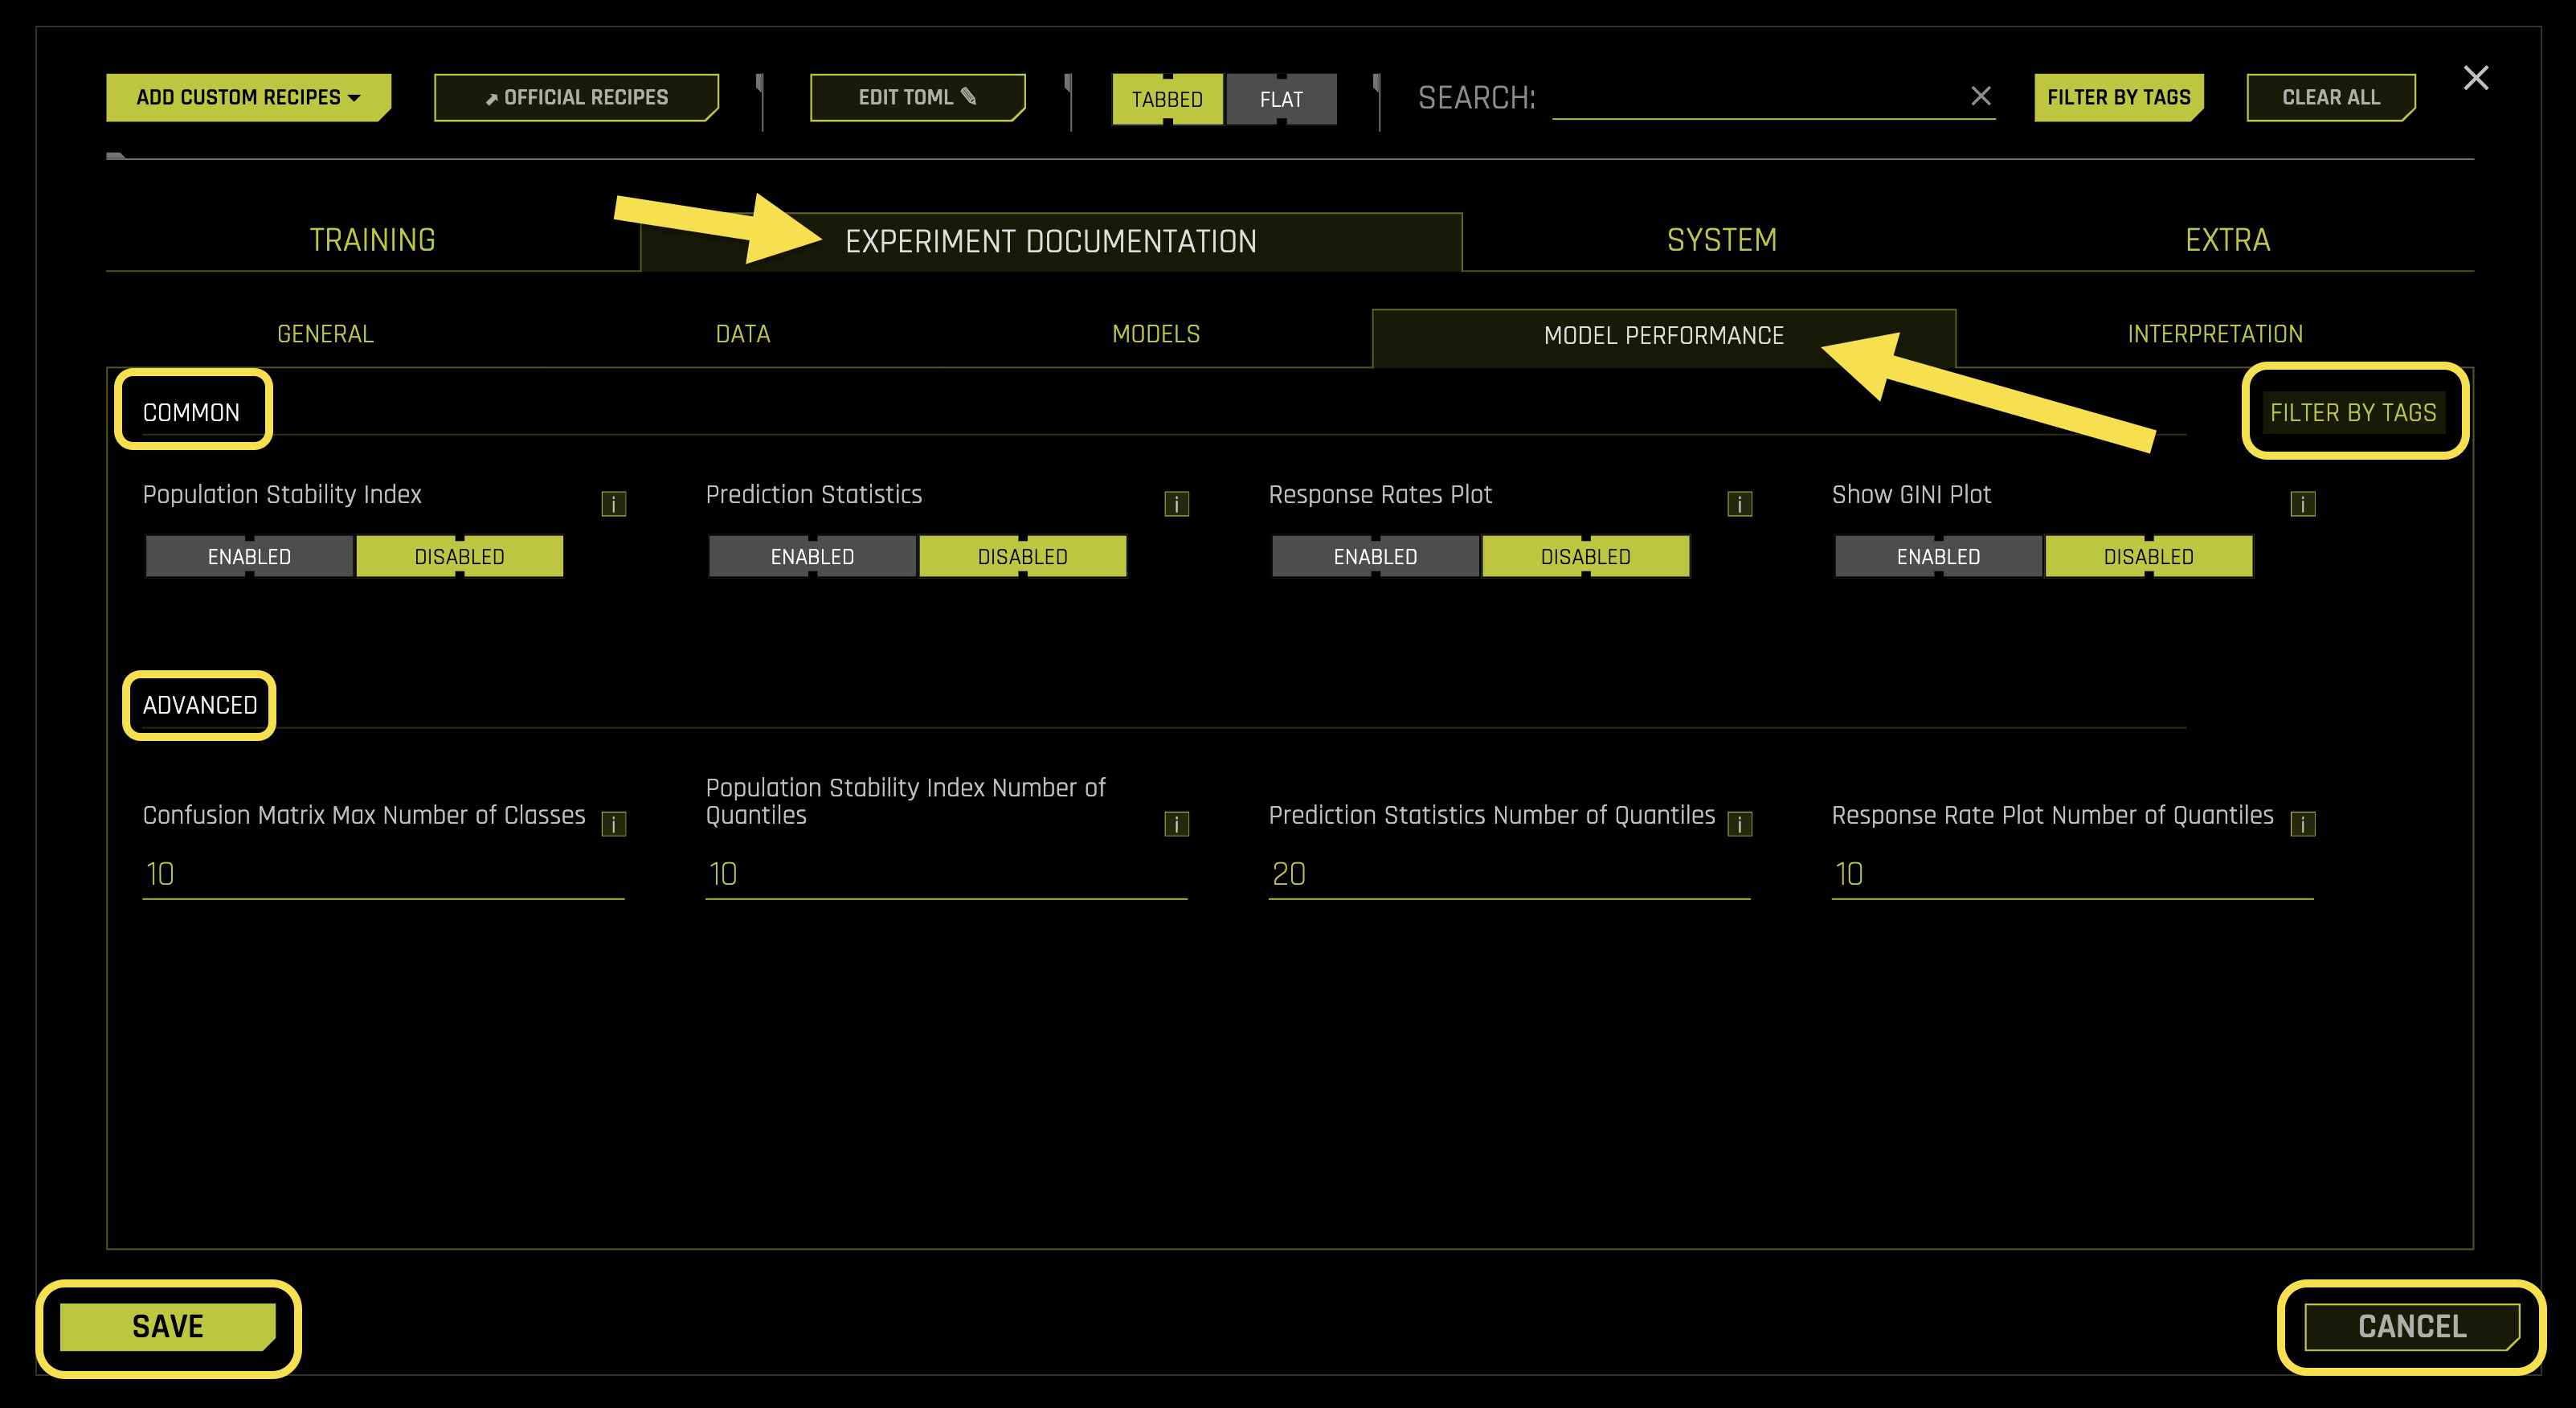
Common Settings:
- Population Stability Index
What it does: Controls whether to include Population Stability Index (PSI) analysis in performance documentation
Purpose: Measures the stability of model predictions between training and validation data
- Available options:
Enabled: Includes PSI analysis in AutoDoc reports
Disabled: Excludes PSI analysis from AutoDoc reports (default)
Requires: Boolean toggle (default: Disabled)
- Prediction Statistics
What it does: Controls whether to include detailed prediction statistics in performance documentation
Purpose: Provides comprehensive statistical analysis of model predictions
- Available options:
Enabled: Includes prediction statistics in AutoDoc reports
Disabled: Excludes prediction statistics from AutoDoc reports (default)
Requires: Boolean toggle (default: Disabled)
- Response Rates Plot
What it does: Controls whether to include response rate visualization plots in performance documentation
Purpose: Visualizes the relationship between model predictions and actual outcomes
- Available options:
Enabled: Includes response rate plots in AutoDoc reports
Disabled: Excludes response rate plots from AutoDoc reports (default)
Requires: Boolean toggle (default: Disabled)
- Show GINI Plot
What it does: Controls whether to include GINI coefficient visualization in performance documentation
Purpose: Provides visual representation of model discrimination power
- Available options:
Enabled: Includes GINI plots in AutoDoc reports
Disabled: Excludes GINI plots from AutoDoc reports (default)
Requires: Boolean toggle (default: Disabled)
Advanced Settings:
- Confusion Matrix Max Number of Classes
What it does: Sets the maximum number of classes to display in confusion matrix documentation
Purpose: Controls the complexity of confusion matrix visualization
Performance: Prevents overwhelming documentation with too many classes
Requires: Integer value (default: 10)
- Population Stability Index Number of Quantiles
What it does: Sets the number of quantiles used for PSI calculation and documentation
Purpose: Controls the granularity of PSI analysis
Accuracy: More quantiles provide more detailed PSI analysis
Requires: Integer value (default: 10)
- Prediction Statistics Number of Quantiles
What it does: Sets the number of quantiles for prediction statistics analysis
Purpose: Controls the granularity of prediction distribution analysis
Detail: More quantiles provide more detailed statistical insights
Requires: Integer value (default: 20)
- Response Rate Plot Number of Quantiles
What it does: Sets the number of quantiles for response rate plot visualization
Purpose: Controls the granularity of response rate analysis
Visualization: More quantiles create smoother response rate curves
Requires: Integer value (default: 10)
Interpretation
The Interpretation sub-tab configures model interpretability features, feature importance analysis, and explanation generation settings for your experiments.
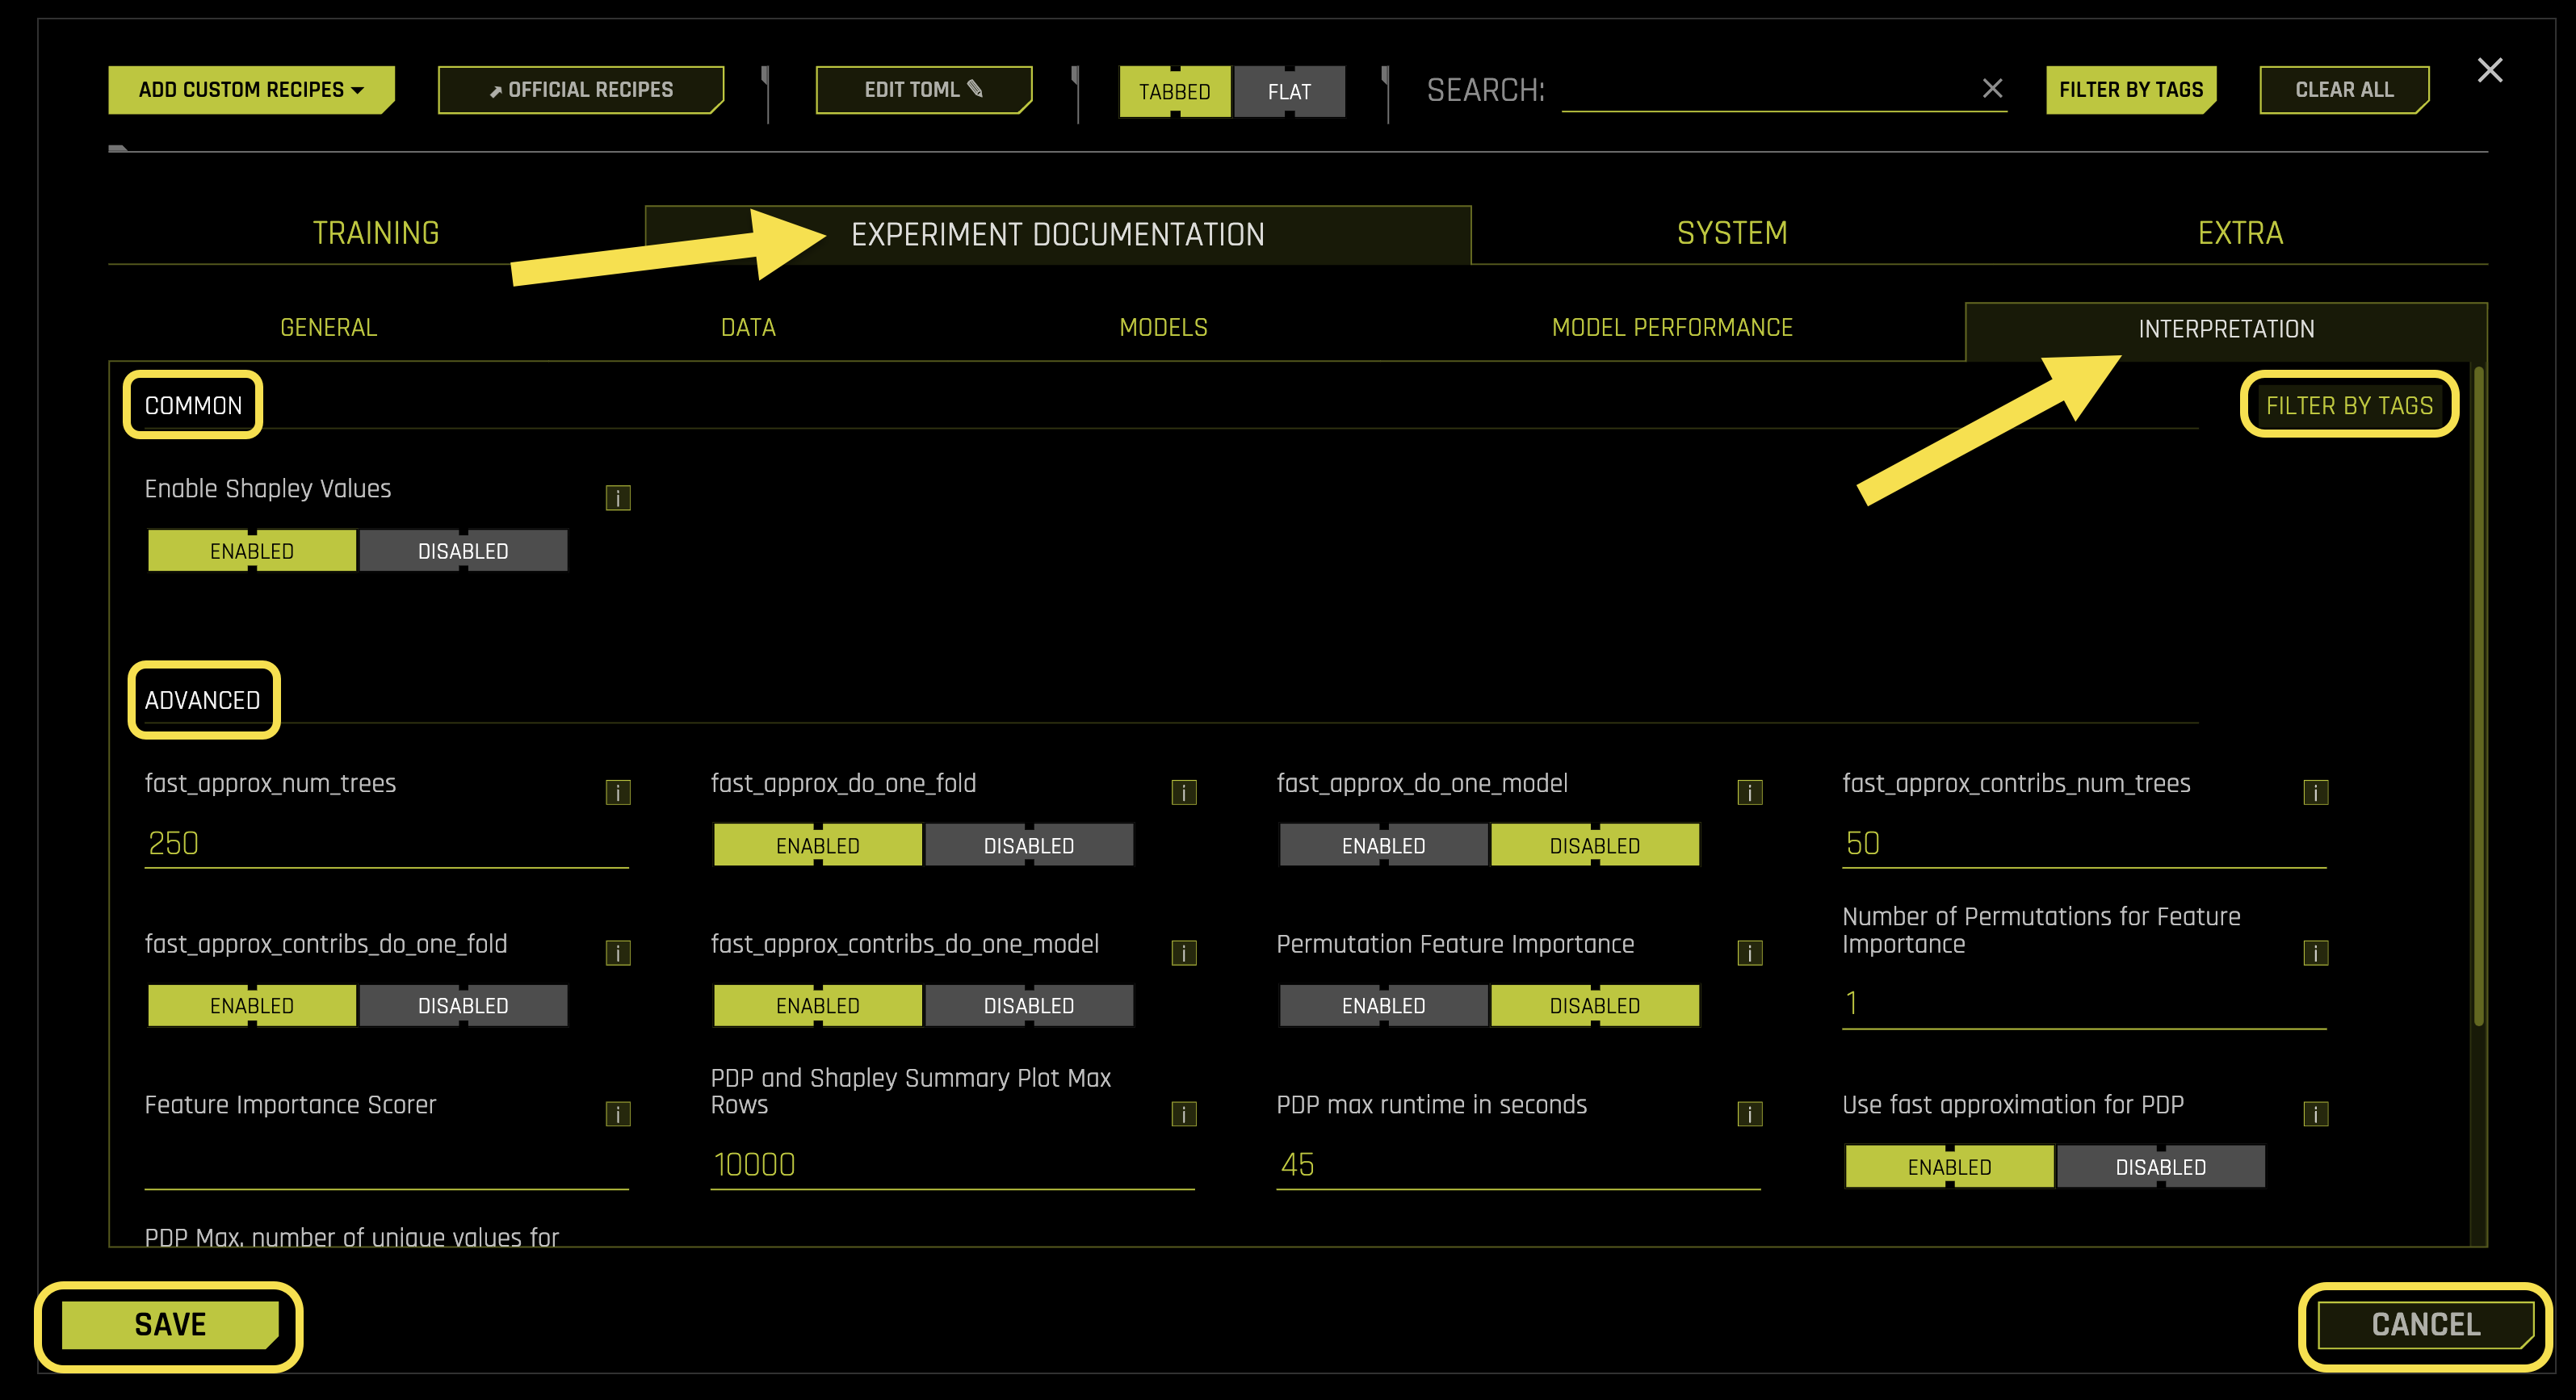
Common Settings:
- Enable Shapley Values
What it does: Controls whether to include Shapley value explanations in interpretability documentation
Purpose: Provides detailed feature contribution analysis for model predictions
- Available options:
Enabled: Includes Shapley value analysis in AutoDoc reports
Disabled: Excludes Shapley value analysis from AutoDoc reports (default)
Requires: Boolean toggle (default: Disabled)
Advanced Settings:
- fast_approx_num_trees
What it does: Sets the number of trees to use for fast Shapley value approximation
Purpose: Controls the speed vs. accuracy trade-off for Shapley calculations
Performance: More trees provide more accurate approximations but slower computation
Requires: Integer value (default: 250)
- fast_approx_do_one_fold
What it does: Controls whether to use single-fold approximation for fast Shapley calculations
Purpose: Optimizes computation speed for Shapley value generation
- Available options:
Enabled: Uses single-fold approximation for faster computation
Disabled: Uses multi-fold approximation for better accuracy
Requires: Boolean toggle (default: Enabled)
- fast_approx_do_one_model
What it does: Controls whether to use single-model approximation for fast Shapley calculations
Purpose: Optimizes computation speed by using only one model for approximation
- Available options:
Enabled: Uses single-model approximation for faster computation
Disabled: Uses multiple models for better accuracy
Requires: Boolean toggle (default: Enabled)
- fast_approx_contribs_num_trees
What it does: Sets the number of trees for fast contribution approximation
Purpose: Controls the accuracy of feature contribution calculations
Balance: Balances computation speed with approximation quality
Requires: Integer value (default: 50)
- fast_approx_contribs_do_one_fold
What it does: Controls whether to use single-fold approximation for contribution calculations
Purpose: Optimizes computation speed for feature contribution analysis
- Available options:
Enabled: Uses single-fold approximation for faster computation
Disabled: Uses multi-fold approximation for better accuracy
Requires: Boolean toggle (default: Enabled)
- fast_approx_contribs_do_one_model
What it does: Controls whether to use single-model approximation for contribution calculations
Purpose: Optimizes computation speed for contribution analysis
- Available options:
Enabled: Uses single-model approximation for faster computation
Disabled: Uses multiple models for better accuracy
Requires: Boolean toggle (default: Enabled)
- Permutation Feature Importance
What it does: Controls whether to include permutation-based feature importance analysis
Purpose: Provides alternative feature importance measurement method
- Available options:
Enabled: Includes permutation feature importance in AutoDoc reports
Disabled: Excludes permutation feature importance from AutoDoc reports (default)
Requires: Boolean toggle (default: Disabled)
- Number of Permutations for Feature Importance
What it does: Sets the number of permutations to use for feature importance calculation
Purpose: Controls the accuracy and stability of permutation importance scores
Accuracy: More permutations provide more stable importance estimates
Requires: Integer value (default: 1)
- Feature Importance Scorer
What it does: Specifies the scoring metric to use for feature importance calculations
Purpose: Determines how feature importance is measured and ranked
Options: Supports various scoring metrics (accuracy, AUC, R2, etc.)
Requires: String value (default: “auto”)
- PDP and Shapley Summary Plot Max Rows
What it does: Sets the maximum number of rows to include in PDP and Shapley summary plots
Purpose: Controls the size and readability of interpretability visualizations
Performance: Limits plot complexity for better performance
Requires: Integer value (default: 10000)
- PDP max runtime in seconds
What it does: Sets the maximum runtime for Partial Dependence Plot calculations
Purpose: Prevents PDP calculations from taking too long on large datasets
Timeout: Automatically stops PDP generation if time limit is exceeded
Requires: Integer value (default: 45)
- Use fast approximation for PDP
What it does: Controls whether to use fast approximation methods for PDP generation
Purpose: Optimizes computation speed for Partial Dependence Plots
- Available options:
Enabled: Uses fast approximation for quicker PDP generation
Disabled: Uses standard PDP calculation for better accuracy
Requires: Boolean toggle (default: Enabled)
- PDP Max. number of unique values for int/float to be categoricals
What it does: Sets the threshold for treating integer/float features as categorical in PDP
Purpose: Controls how numeric features are handled in partial dependence analysis
Threshold: Features with fewer unique values are treated as categorical
Requires: Integer value (default: 50)
- PDP Out of Range
What it does: Sets the number of out-of-range values to include in PDP analysis
Purpose: Controls the range of values analyzed in partial dependence plots
Coverage: Includes values beyond the training data range for comprehensive analysis
Requires: Integer value (default: 3)
- ICE Number of Rows
What it does: Sets the number of rows to include in Individual Conditional Expectation plots
Purpose: Controls the granularity of ICE plot analysis
Auto mode (0): Automatically determines optimal number of rows
Requires: Integer value (default: 0)
- Global KLIME Number of Features
What it does: Sets the number of features to include in global KLIME analysis
Purpose: Controls the scope of KLIME interpretability analysis
Focus: Highlights the most important features in global explanations
Requires: Integer value (default: 10)
- Global KLIME Number of Tables
What it does: Sets the number of KLIME tables to generate for global analysis
Purpose: Controls the depth of KLIME interpretability documentation
Comprehensiveness: More tables provide more detailed explanations
- Available options:
1: Shows one table with coefficients sorted by absolute value
2: Shows two tables - one with top positive coefficients and one with top negative coefficients
Requires: Integer value (default: auto)