Driverless AI Transformations
Transformations in Driverless AI are applied to columns in the data. The transformers create the engineered features in experiments.
Driverless AI provides a number of transformers. The downloaded experiment logs include the transformations that were applied to your experiment.
Notes:
You can include or exclude specific transformers in your Driverless AI environment using the
included_transformersorexcluded_transformersconfig options.You can control which transformers to use in individual experiments with the included_transformers Expert Setting in Training > Feature Engineering.
You can set transformers to be used as pre-processing transformers with the included_pretransformers Expert Setting in Training > Feature Engineering. Additional layers can be added with the num_pipeline_layers Expert Setting in Training > Data.
An alternative to transformers that gives more flexibility (but has no fitted state) are data recipes, controlled by the included_datas Expert Setting in Training > Data.
Available Transformers
The following transformers are available for regression and classification (multiclass and binary) experiments.
Transformed Feature Naming Convention
Transformed feature names are encoded as follows:
<Transformation_indexORgene_details_id>_<Transformation_name>:<original_feature_name>:<…>:<original_feature_name>.<extra>
For example in 32_NumToCatTE:BILL_AMT1:EDUCATION:MARRIAGE:SEX.0 :
32_is the transformation index for specific transformation parameters.
NumToCatTEis the transformer name.
BILL_AMT1:EDUCATION:MARRIAGE:SEXrepresents original features used.
0is the extra and represents the likelihood encoding for target[0] after grouping by features (shown here asBILL_AMT1,EDUCATION,MARRIAGEandSEX) and making out-of-fold estimates. For multiclass experiments, this value is > 0. For binary experiments, this value is always 0.
Numeric Transformers (Integer, Real, Binary)
ClusterDist Transformer
Clusters selected numeric columns and uses the distance to a specific cluster as a new feature.
ClusterTE Transformer
Clusters selected numeric columns and calculates the mean of the response column for each cluster. The mean of the response is used as a new feature. Cross Validation is used to calculate mean response to prevent overfitting.
ClusterId Transformer
Trains an unsupervised clustering model (k-means) on selected numeric columns and outputs the cluster ID as a new categorical feature. This is useful for segmenting data into groups based on feature similarity.
Interactions Transformer
Adds, divides, multiplies, and subtracts two numeric columns in the data to create a new feature. Uses a smart search to identify which feature pairs to transform. Only interactions that improve the baseline model score are kept.
InteractionsSimple Transformer
Adds, divides, multiplies, and subtracts two numeric columns in the data to create a new feature. Randomly selects pairs of features to transform.
NumCatTE Transformer
Calculates the mean of the response column for several selected columns. If one of the selected columns is numeric, it is first converted to categorical by binning. The mean of the response column is used as a new feature. Cross Validation is used to calculate mean response to prevent overfitting.
NumToCatTE Transformer
Converts numeric columns to categoricals by binning and then calculates the mean of the response column for each group. The mean of the response for the bin is used as a new feature. Cross Validation is used to calculate mean response to prevent overfitting.
NumToCatWoEMonotonic Transformer
Converts a numeric column to categorical by binning and then calculates Weight of Evidence for each bin. The monotonic constraint ensures the bins of values are monotonically related to the Weight of Evidence value. Weight of Evidence measures the 《strength》 of a grouping for separating good and bad risk and is calculated by taking the log of the ratio of distributions for a binary response column.
NumToCatWoE Transformer
Converts a numeric column to categorical by binning and then calculates Weight of Evidence for each bin. Weight of Evidence measures the 《strength》 of a grouping for separating good and bad risk and is calculated by taking the log of the ratio of distributions for a binary response column.
Original Transformer
Applies an identity transformation to a numeric column.
Raw Transformer
Applies an identity transformation to features, passing them through without modification. Unlike the Original Transformer, does not perform imputation of missing values.
Binner Transformer
Splits a numeric column into multiple columns by binning. Each bin creates an output column, and there is one additional bin for missing values (if any). By default, optimal bin cut points are found using XGBoost, otherwise bins are created from quantiles of the input data. Two encoding modes are available: piecewise linear (smooth transitions) or binary (detection of specific value ranges).
참고
By default (
enable_binning= 《AUTO》), Driverless AI uses this transformer only with GLM, FTRL, and GrowNet models, and only in time series experiments or when interpretability >= 8. To use it with all models, setenable_binningto 《ON》 in the Expert Settings.IsolationForestAnomalyNumeric Transformer
Trains an Isolation Forest model on selected numeric columns and uses the anomaly score as a new feature. Higher scores indicate more anomalous observations. Useful for detecting outliers and unusual patterns in the data.
IsolationForestAnomalyNumCat Transformer
Trains an Isolation Forest model on both numeric and categorical columns (after encoding categoricals) and uses the anomaly score as a new feature. Extends anomaly detection to mixed data types.
Aggregator Transformer
Identifies 《exemplar》 rows that best represent the dataset using clustering techniques. Returns the exemplar row ID as a new feature, useful for reducing dataset complexity while preserving representative samples.
TruncSVDNum Transformer
Truncated SVD Transformer trains a Truncated SVD model on selected numeric columns and uses the components of the truncated SVD matrix as new features.
ELM Transformer
Behaves like a single-hidden-layer feedforward neural network with random hidden nodes. Maps input features to a randomized higher-dimensional space and applies a non-linear activation (sigmoid), allowing the model to capture complex non-linear patterns.
QuantileTransformerNormal
Transforms features using quantile information so that they follow a normal distribution. Useful for normalizing the distribution of input features and reducing the impact of outliers.
QuantileTransformerUniform
Transforms features using quantile information so that they follow a uniform distribution. Useful for normalizing the distribution of input features and reducing the impact of outliers.
StandardScaler Transformer
Standardizes numeric columns by removing the mean and scaling to unit variance.
Time Series Experiments Transformers
DateOriginal Transformer
Retrieves date values such as year, quarter, month, day, day of the year, week, and weekday values.
DateTimeOriginal Transformer
Retrieves date and time values such as year, quarter, month, day, day of the year, week, weekday, hour, minute, and second values.
EwmaLags Transformer
Calculates the exponentially weighted moving average (EWMA) of target or feature lags.
LagsAggregates Transformer
Calculates aggregations of target/feature lags like mean(lag7, lag14, lag21) with support for mean, min, max, median, sum, skew, kurtosis, std. The aggregation is used as a new feature.
LagsInteraction Transformer
Creates target/feature lags and calculates interactions between the lags (lag2 - lag1, for instance). The interaction is used as a new feature.
Lags Transformer
Creates target/feature lags, possibly over groups. Each lag is used as a new feature. Lag transformers may apply to categorical (strings) features or binary/multiclass string valued targets after they have been internally numerically encoded.
LinearLagsRegression Transformer
Trains a linear model on the target or feature lags to predict the current target or feature value. The linear model prediction is used as a new feature.
TimeSeriesTargetEnc Transformer
Applies target encoding specifically for time-series group columns (TGC). Calculates the mean of the response column for each combination of group-by columns over time. Cross Validation is used to calculate mean response to prevent overfitting.
Categorical Transformers (String)
Cat Transformer
Sorts a categorical column in lexicographical order and uses the order index as a new feature. Only enabled for models with categorical feature support: LightGBM models when
enable_lightgbm_cat_supportis enabled, or custom model recipes where_can_handle_categoricalis set to True.CatOriginal Transformer
Applies an identity transformation that leaves categorical features as they are. Works with models that can handle non-numeric feature values.
CVCatNumEncode Transformer
Calculates an aggregation of a numeric column for each value in a categorical column (for example, the mean Temperature for each City) and uses this aggregation as a new feature.
CVTargetEncode Transformer (CVTE)
Calculates the mean of the response column for each value in a categorical column and uses this as a new feature. Cross Validation is used to calculate mean response to prevent overfitting.
Frequent Transformer
Calculates the frequency for each value in categorical column(s) and uses this as a new feature. The count can be either raw or normalized.
LexiLabelEncoder Transformer
Sorts a categorical column in lexicographical order and uses the order index as a new feature. To enable, set
enable_lexilabel_encodingto 《ON》.NumCatTE Transformer
Calculates the mean of the response column for several selected columns. If one of the selected columns is numeric, it is first converted to categorical by binning. The mean of the response column is used as a new feature. Cross Validation is used to calculate mean response to prevent overfitting.
OneHotEncoding Transformer
Converts a categorical column to a series of Boolean features using one-hot encoding. If there are more than a specific number of unique values in the column, they are binned to the max number (10 by default) in lexicographical order. This value can be changed with the
ohe_bin_listconfig.toml configuration option.SortedLE Transformer
Sorts a categorical column by the response column and uses the order index as a new feature.
WeightOfEvidence Transformer
Calculates the Weight of Evidence (WoE) for each value in categorical column(s) for all possible combinations. Weight of Evidence measures the 《strength》 of a grouping for separating good and bad risk, calculated by taking the log of the ratio of distributions for a binary response column.
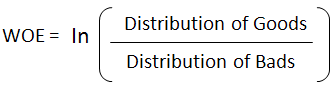
This only works with a binary target variable. The likelihood needs to be created within a stratified k-fold if a fit_transform method is used. For more information, see http://ucanalytics.com/blogs/information-value-and-weight-of-evidencebanking-case/.
StringConcat Transformer
Concatenates multiple categorical (string) columns into a single combined string column. The concatenated value is then available for further transformations like target encoding or frequency encoding.
Text Transformers (String)
BERT Transformer
Creates new features for each text column based on pre-trained BERT (Bidirectional Encoder Representations from Transformers) model embeddings. Ideally suited for datasets that contain additional important non-text features.
참고
If your dataset is large or contains many text columns, using the BERT transformer may significantly increase experiment completion time.
TextBiGRUV2 Transformer
Trains a Bidirectional GRU (Gated Recurrent Unit) model on word embeddings created from a text feature to predict the response column. The BiGRU prediction is used as a new feature. Cross Validation is used when training the BiGRU model to prevent overfitting.
참고
The original TextBiGRU transformer (TensorFlow) was removed in 2.4.0.
TextCharCNNV2 Transformer
Trains a CNN model on character embeddings created from a text feature to predict the response column. The CNN prediction is used as a new feature. Cross Validation is used when training the CNN model to prevent overfitting.
참고
The original TextCharCNN transformer (TensorFlow) was removed in 2.4.0.
TextCNNV2 Transformer
Trains a CNN model on word embeddings created from a text feature to predict the response column. The CNN prediction is used as a new feature. Cross Validation is used when training the CNN model to prevent overfitting.
참고
The original TextCNN transformer (TensorFlow) was removed in 2.4.0.
TextLinModel Transformer
Trains a linear model on a TF-IDF matrix created from a text feature to predict the response column. The linear model prediction is used as a new feature. Cross Validation is used when training to prevent overfitting.
Text Transformer
Tokenizes a text column and creates a TF-IDF matrix (term frequency-inverse document frequency), a count (word count) matrix, or a Co-Occurrence matrix (word pairs count). When the number of TF-IDF features exceeds the value specified in
text_gene_dim_reduction_choices, dimensionality reduction is performed using truncated SVD. Selected components are used as new features.TextOriginal Transformer
Performs no feature engineering on the text column. Only available for models with text feature support: ImageAutoModel, FTRL, BERT, unsupervised models, and custom model recipes where
_can_handle_textis set to True.StrFeature Transformer
Extracts statistical features from text columns such as length, word count, character counts, and other text-based metrics. These features are used as new numeric columns.
TextClustTE Transformer
Clusters text data and calculates the mean of the response column for each cluster. The mean of the response is used as a new feature. Cross Validation is used to calculate mean response to prevent overfitting.
TextClustDist Transformer
Clusters text data and uses the distance to a specific cluster as a new feature.
Time Transformers (Date, Time)
Dates Transformer
Retrieves date values, including:
Year
Quarter
Month
Day
Day of year
Week
Week day
Hour
Minute
Second
IsHoliday Transformer
Determines if a date column is a holiday and adds a Boolean feature. Creates separate features for holidays in the United States, United Kingdom, Germany, Mexico, and the European Central Bank. Other countries from the Python Holiday package can be added via the configuration file.
DateTimeDiff Transformer
Calculates the difference between two date/datetime columns. The time difference is used as a new feature. Useful for computing durations, ages, or time-between-events features.
DatePolar Transformer
Breaks down a date column into time components (hour, day of week, month, etc.) and converts these cyclic features into (x, y) coordinate pairs on a unit circle. This preserves the cyclic nature of time.
Image Transformers
ImageOriginal Transformer
Passes image paths to the model without performing any feature engineering.
ImageVectorizerV2 Transformer
Uses pre-trained HuggingFace models to convert a column with an image path or URI to an embeddings (vector) representation derived from the last linear layer of the model.
참고
Fine-tuning of the pre-trained image models can be enabled with the image-model-fine-tune expert setting.
The original ImageVectorizer transformer was deprecated in 2.3.0 and removed in 2.4.0.
Autoviz Recommendations Transformer
Applies the recommended transformations obtained by visualizing the dataset in Driverless AI. Supports square_root, log, and inverse operations (and their approximations using yeo-johnson power transformations for negative values).
The autoviz_recommended_transformation expert setting controls which transformations are applied. The syntax is a dict of transformations from Autoviz like {《DIS》:》log》,》INDUS》:》log》,》RAD》:》inverse》,》ZN》:》square_root》}. Enable or disable this transformer via the included_transformers config setting.
This transformer is supported in python scoring pipelines and mojo scoring pipelines with Java Runtime (no C++ support at the moment).
Example Transformations
This section describes some of the available transformations using the example of predicting house prices.
Date Built |
Square Footage |
Num Beds |
Num Baths |
State |
Price |
|---|---|---|---|---|---|
01/01/1920 |
1700 |
3 |
2 |
NY |
$700K |
Frequent Transformer
the count of each categorical value in the dataset
the count can be either the raw count or the normalized count
Date Built |
Square Footage |
Num Beds |
Num Baths |
State |
Price |
Freq_State |
|---|---|---|---|---|---|---|
01/01/1920 |
1700 |
3 |
2 |
NY |
700,000 |
4,500 |
There are 4,500 properties in this dataset with state = NY.
Interactions Transformer
Adds, divides, multiplies, and subtracts two columns in the data
Date Built |
Square Footage |
Num Beds |
Num Baths |
State |
Price |
Interaction_NumBeds#subtract#NumBaths |
|---|---|---|---|---|---|---|
01/01/1920 |
1700 |
3 |
2 |
NY |
700,000 |
1 |
There is one more bedroom than there are number of bathrooms for this property.
Truncated SVD Numeric Transformer
truncated SVD trained on selected numeric columns of the data
the components of the truncated SVD will be new features
Date Built |
Square Footage |
Num Beds |
Num Baths |
State |
Price |
TruncSVD_Price_NumBeds_NumBaths_1 |
|---|---|---|---|---|---|---|
01/01/1920 |
1700 |
3 |
2 |
NY |
700,000 |
0.632 |
The first component of the truncated SVD of the columns Price, Number of Beds, Number of Baths.
Dates Transformer
get year, get quarter, get month, get day, get day of year, get week, get week day, get hour, get minute, get second
Date Built |
Square Footage |
Num Beds |
Num Baths |
State |
Price |
DateBuilt_Month |
|---|---|---|---|---|---|---|
01/01/1920 |
1700 |
3 |
2 |
NY |
700,000 |
1 |
The home was built in the month January.
Text Transformer
transform text column using methods: TFIDF, count (count of the word) or Co-Occurrence (count of word pairs)
this may be followed by dimensionality reduction using truncated SVD
Categorical Target Encoding Transformer
cross validation target encoding done on a categorical column
Date Built |
Square Footage |
Num Beds |
Num Baths |
State |
Price |
CV_TE_State |
|---|---|---|---|---|---|---|
01/01/1920 |
1700 |
3 |
2 |
NY |
700,000 |
550,000 |
The average price of properties in NY state is $550,000*.
*In order to prevent overfitting, Driverless AI calculates this average on out-of-fold data using cross validation.
Numeric to Categorical Target Encoding Transformer
numeric column converted to categorical by binning
cross validation target encoding done on the binned numeric column
Date Built |
Square Footage |
Num Beds |
Num Baths |
State |
Price |
CV_TE_SquareFootage |
|---|---|---|---|---|---|---|
01/01/1920 |
1700 |
3 |
2 |
NY |
700,000 |
345,000 |
The column Square Footage has been bucketed into 10 equally populated bins. This property lies in the Square Footage bucket 1,572 to 1,749. The average price of properties with this range of square footage is $345,000*.
*In order to prevent overfitting, Driverless AI calculates this average on out-of-fold data using cross validation.
Cluster Target Encoding Transformer
selected columns in the data are clustered
target encoding is done on the cluster ID
Date Built |
Square Footage |
Num Beds |
Num Baths |
State |
Price |
ClusterTE_4_NumBeds_NumBaths_SquareFootage |
|---|---|---|---|---|---|---|
01/01/1920 |
1700 |
3 |
2 |
NY |
700,000 |
450,000 |
The columns: Num Beds, Num Baths, Square Footage have been segmented into 4 clusters. The average price of properties in the same cluster as the selected property is $450,000*.
*In order to prevent overfitting, Driverless AI calculates this average on out-of-fold data using cross validation.
Cluster Distance Transformer
selected columns in the data are clustered
the distance to a chosen cluster center is calculated
Date Built |
Square Footage |
Num Beds |
Num Baths |
State |
Price |
ClusterDist_4_NumBeds_NumBaths_SquareFootage_1 |
|---|---|---|---|---|---|---|
01/01/1920 |
1700 |
3 |
2 |
NY |
700,000 |
0.83 |
The columns: Num Beds, Num Baths, Square Footage have been segmented into 4 clusters. The difference from this record to Cluster 1 is 0.83.
Binner Transformer
Splits a numeric column into bins with piecewise linear or binary encoding
Each bin becomes a new feature column
Date Built |
Square Footage |
Num Beds |
Price |
Binner_SquareFootage_1 |
Binner_SquareFootage_2 |
|---|---|---|---|---|---|
01/01/1920 |
1700 |
3 |
700,000 |
0.85 |
0.0 |
The numeric column Square Footage has been binned. Using piecewise linear encoding, bin 1 shows 0.85 (value is 85% through the bin range), and bin 2 shows 0.0 (value is below this bin’s range).
DateTimeDiff Transformer
Calculates the difference between two date columns
Output is in nanoseconds (1 day = 86,400,000,000,000 nanoseconds)
Start Date |
End Date |
Price |
DateTimeDiff:Start:End |
|---|---|---|---|
01/01/2020 |
03/15/2020 |
700,000 |
6393600000000000 |
The difference between End Date and Start Date is calculated in nanoseconds. In this example, 6,393,600,000,000,000 nanoseconds equals 74 days. The nanosecond precision allows for accurate time differences down to sub-second granularity when working with datetime columns.