Evaluation
Overview
The Evaluation page enables you to assess model performance through evaluation dashboards created in H2O Eval Studio. These dashboards showcase comparisons of models using diverse benchmarks and evaluation methods within H2O Eval Studio. Each dashboard contains one or more result tables per evaluation method.
Evaluations provide a preview of Enterprise h2oGPTe model performances using various benchmarks and evaluation techniques using H2O Eval Studio.
Access the Evaluations page
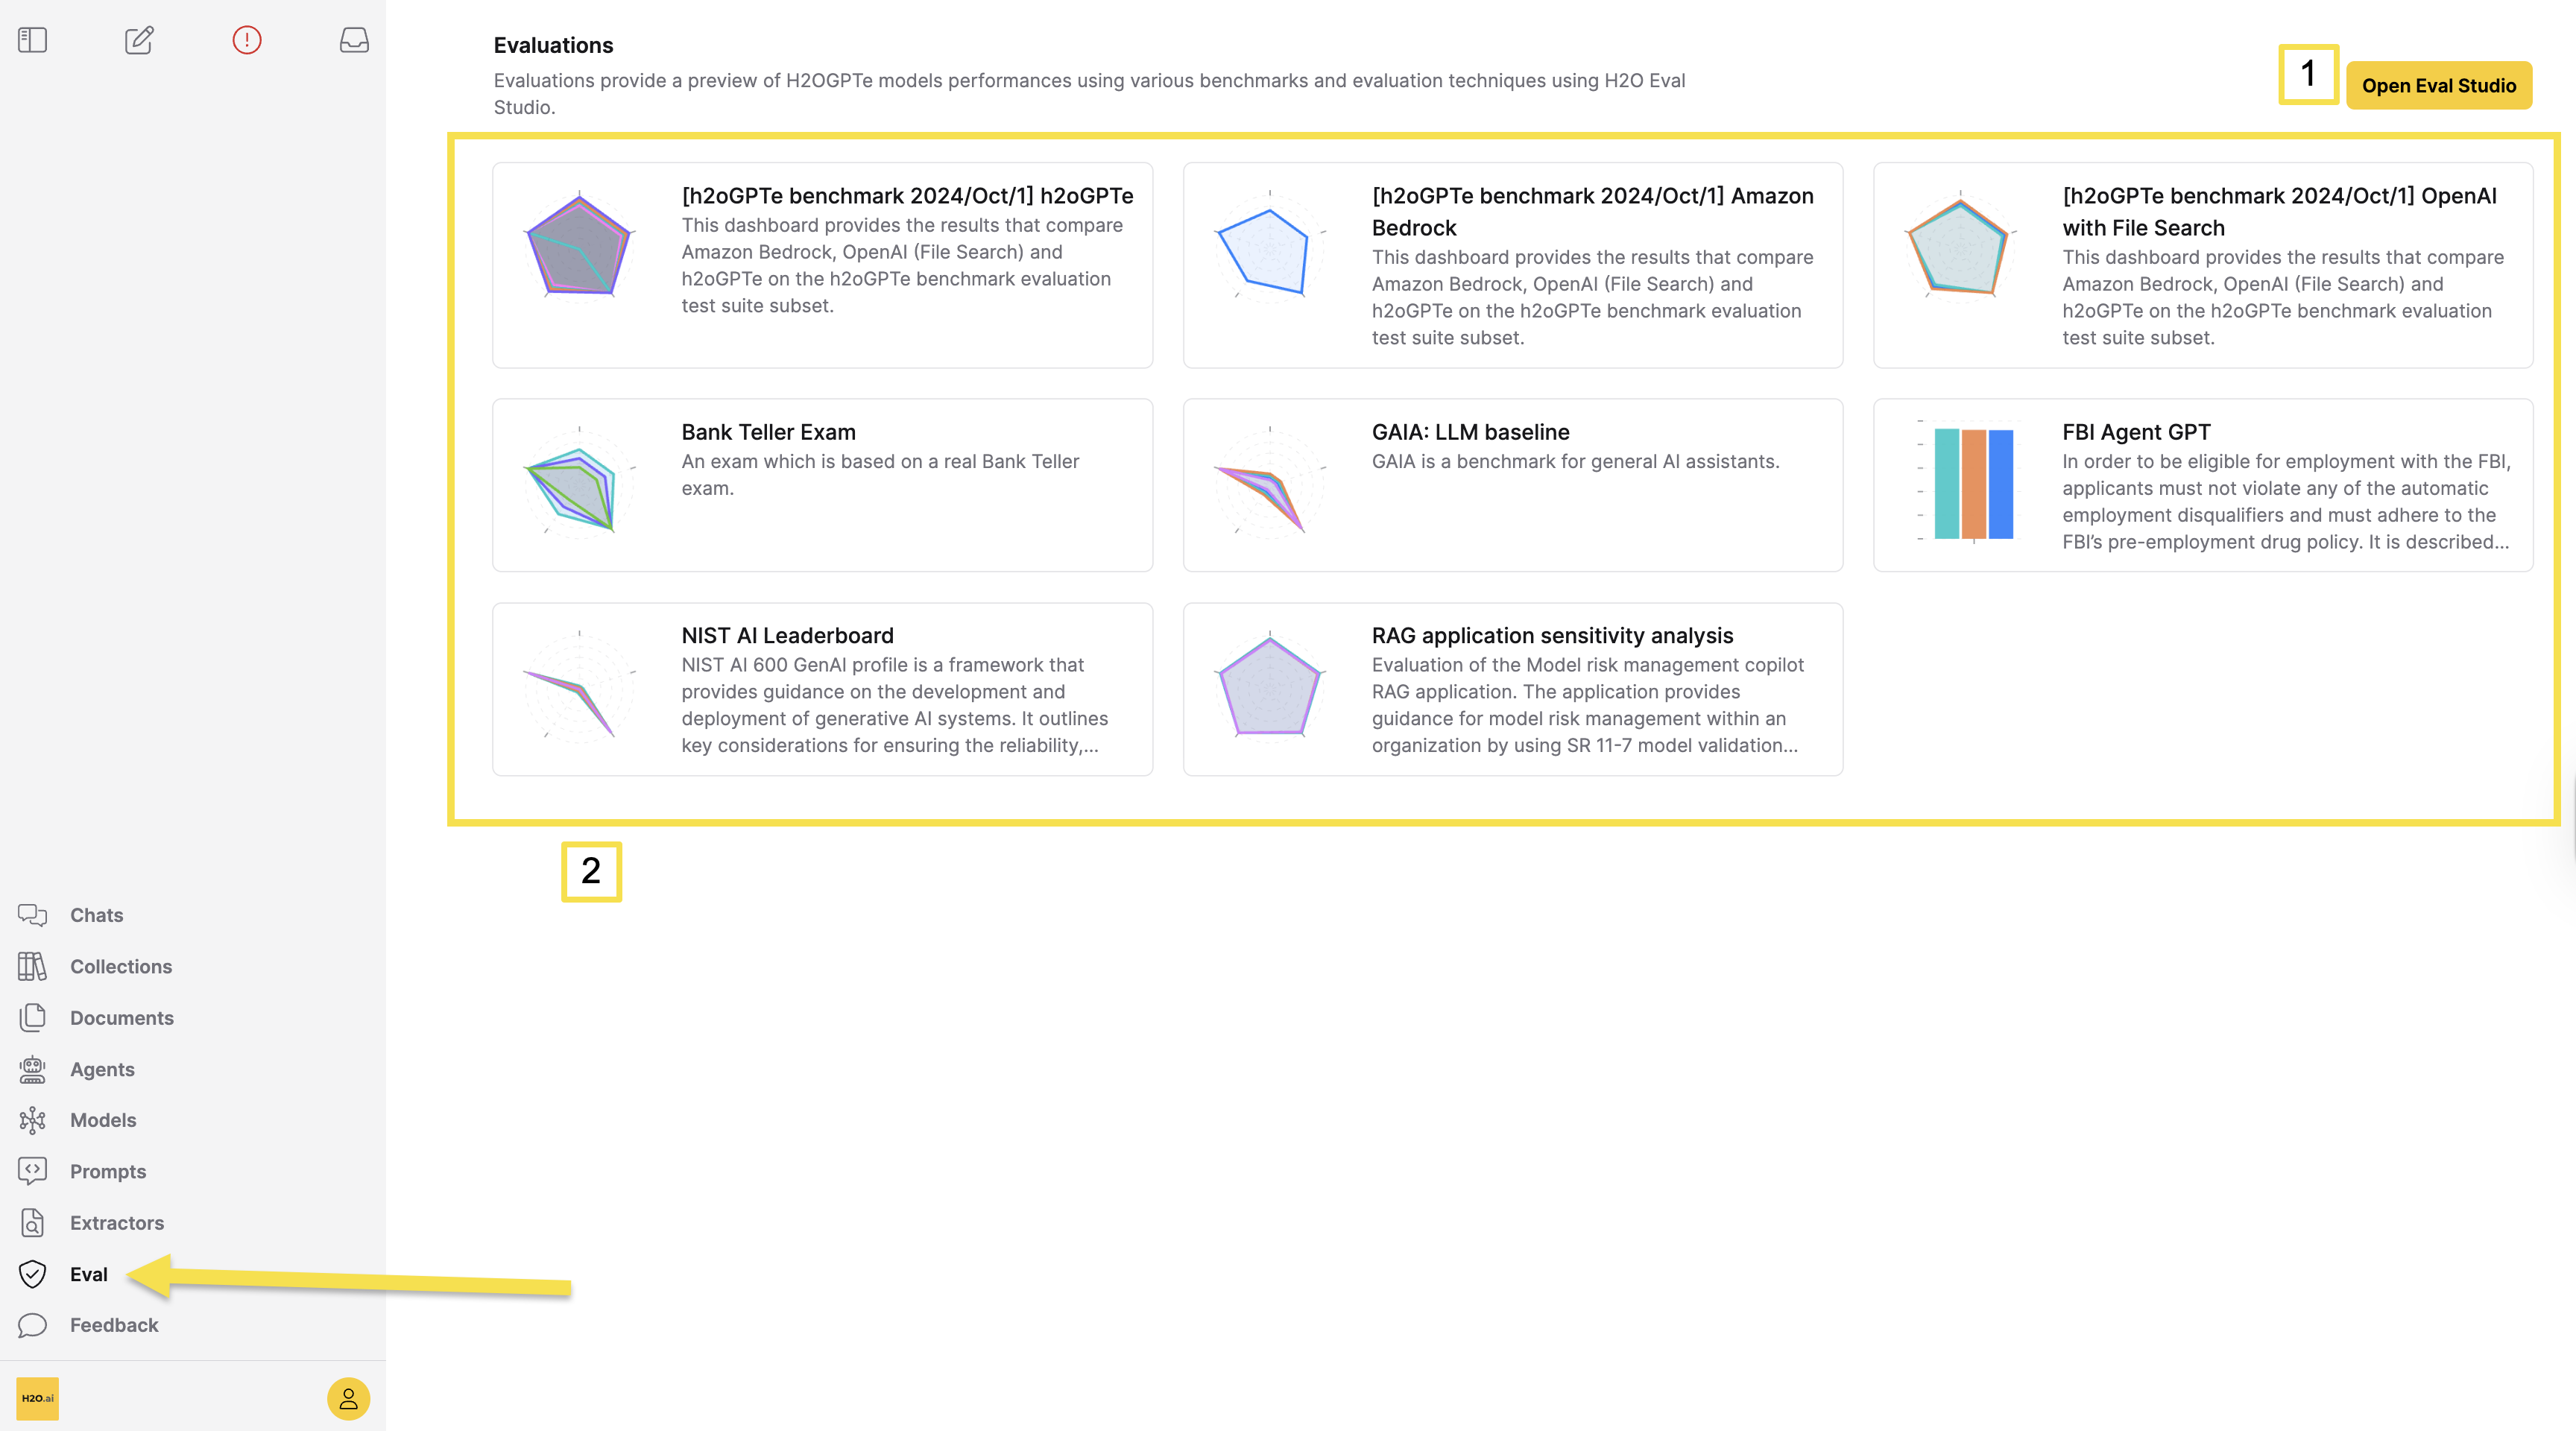
To access the Evaluations page, in the Enterprise h2oGPTe navigation menu, click Eval.
The Evaluations page provides a centralized location to view and manage evaluation dashboards. The following numbered elements are available on the page:
-
Open Eval Studio: Click this button to open H2O Eval Studio in a new page. Use H2O Eval Studio to create new evaluation dashboards, configure benchmarks, and manage evaluation settings.
-
Evaluation cards grid: This grid displays all available evaluation dashboards. Each card represents a benchmark or evaluation and includes:
- Title: The name of the evaluation or benchmark.
- Icon: A visual indicator (radar chart, bar chart, or line chart) representing the evaluation type.
- Description: A brief description of what the evaluation measures or compares.
Click on any evaluation card to view detailed results and performance metrics.
View evaluation details
To view detailed results for an evaluation, consider the following steps:
In the evaluation cards grid (2), click on the evaluation card you want to view. The evaluation details page displays the selected evaluation with the following elements:
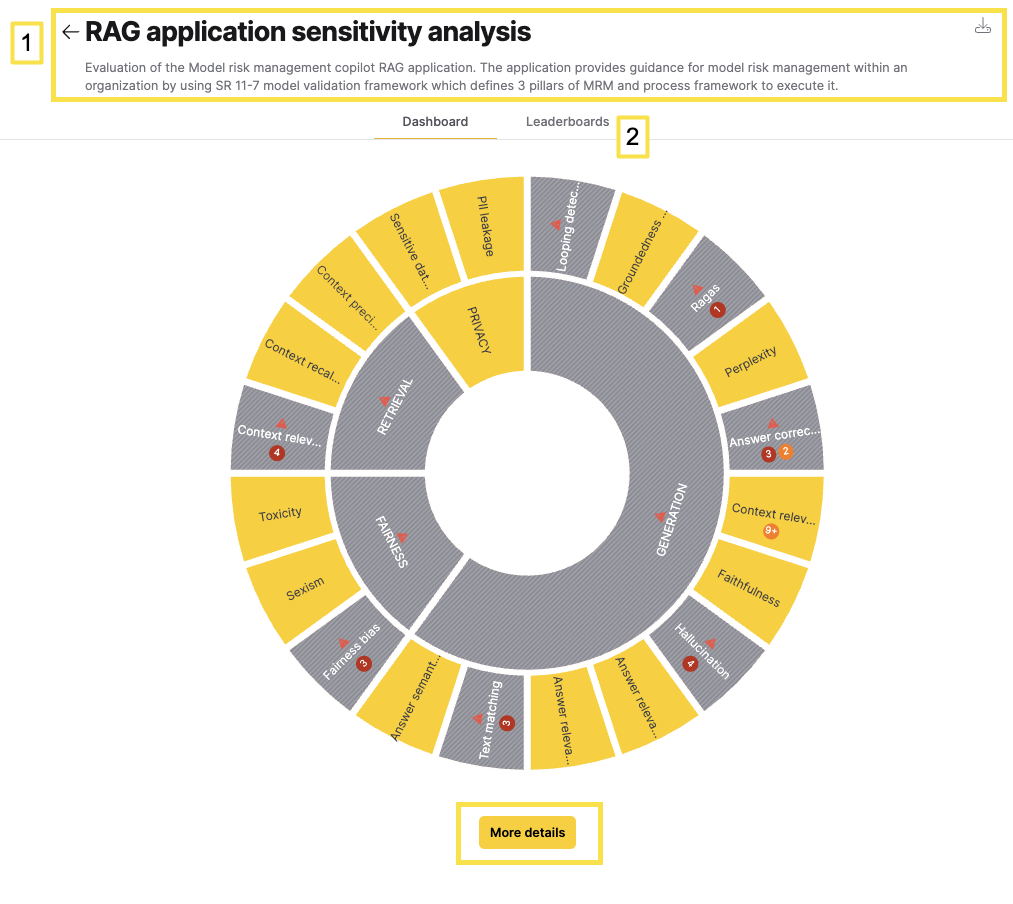
- Header: Displays the evaluation title with a back arrow to return to the Evaluations page and a download icon to export results in a zip.
- Description: Provides context about what the evaluation measures or compares.
- Navigation tabs: Use the Dashboard tab or the Result tables tab to view different perspectives of the evaluation results:
- Dashboard: Displays a visual overview of the evaluation results, including circular charts and performance metrics.
- Result tables: Displays the detailed tables for each evaluation method.
- More details button: Located at the bottom of both tabs. Click this button to open the full evaluation in H2O Eval Studio for advanced analysis and configuration options.
Add a new evaluation dashboard
To add a new evaluation dashboard in H2O Eval Studio, consider the following steps:
- In the Enterprise h2oGPTe navigation menu, click Eval.
- Click Open Eval Studio (1). H2O Eval Studio opens on a new page.
- In H2O Eval Studio, create a new evaluation or workflow that will generate the dashboard and its result tables.
note
Result tables are created as part of the evaluation process in H2O Eval Studio. To learn more about creating evaluations and dashboards, see the H2O Eval Studio documentation.
- Click Create.
- Submit and view feedback for this page
- Send feedback about Enterprise h2oGPTe to cloud-feedback@h2o.ai