Live logs
Overview
The Live logs page streams platform events in real time, giving you immediate visibility into what the system is doing. Use it to monitor document ingestion progress, investigate failed jobs, trace user activity, and verify that services are operating normally after configuration changes.
The Live logs page requires the Show live logs permission. Only an administrator can assign this permission. If you do not have access, contact your administrator.
Access live logs
- In Enterprise h2oGPTe, click Account Circle.
- Select System Dashboard.
- In the System overview section, click Live logs.
The log viewer opens and begins streaming events in real time.
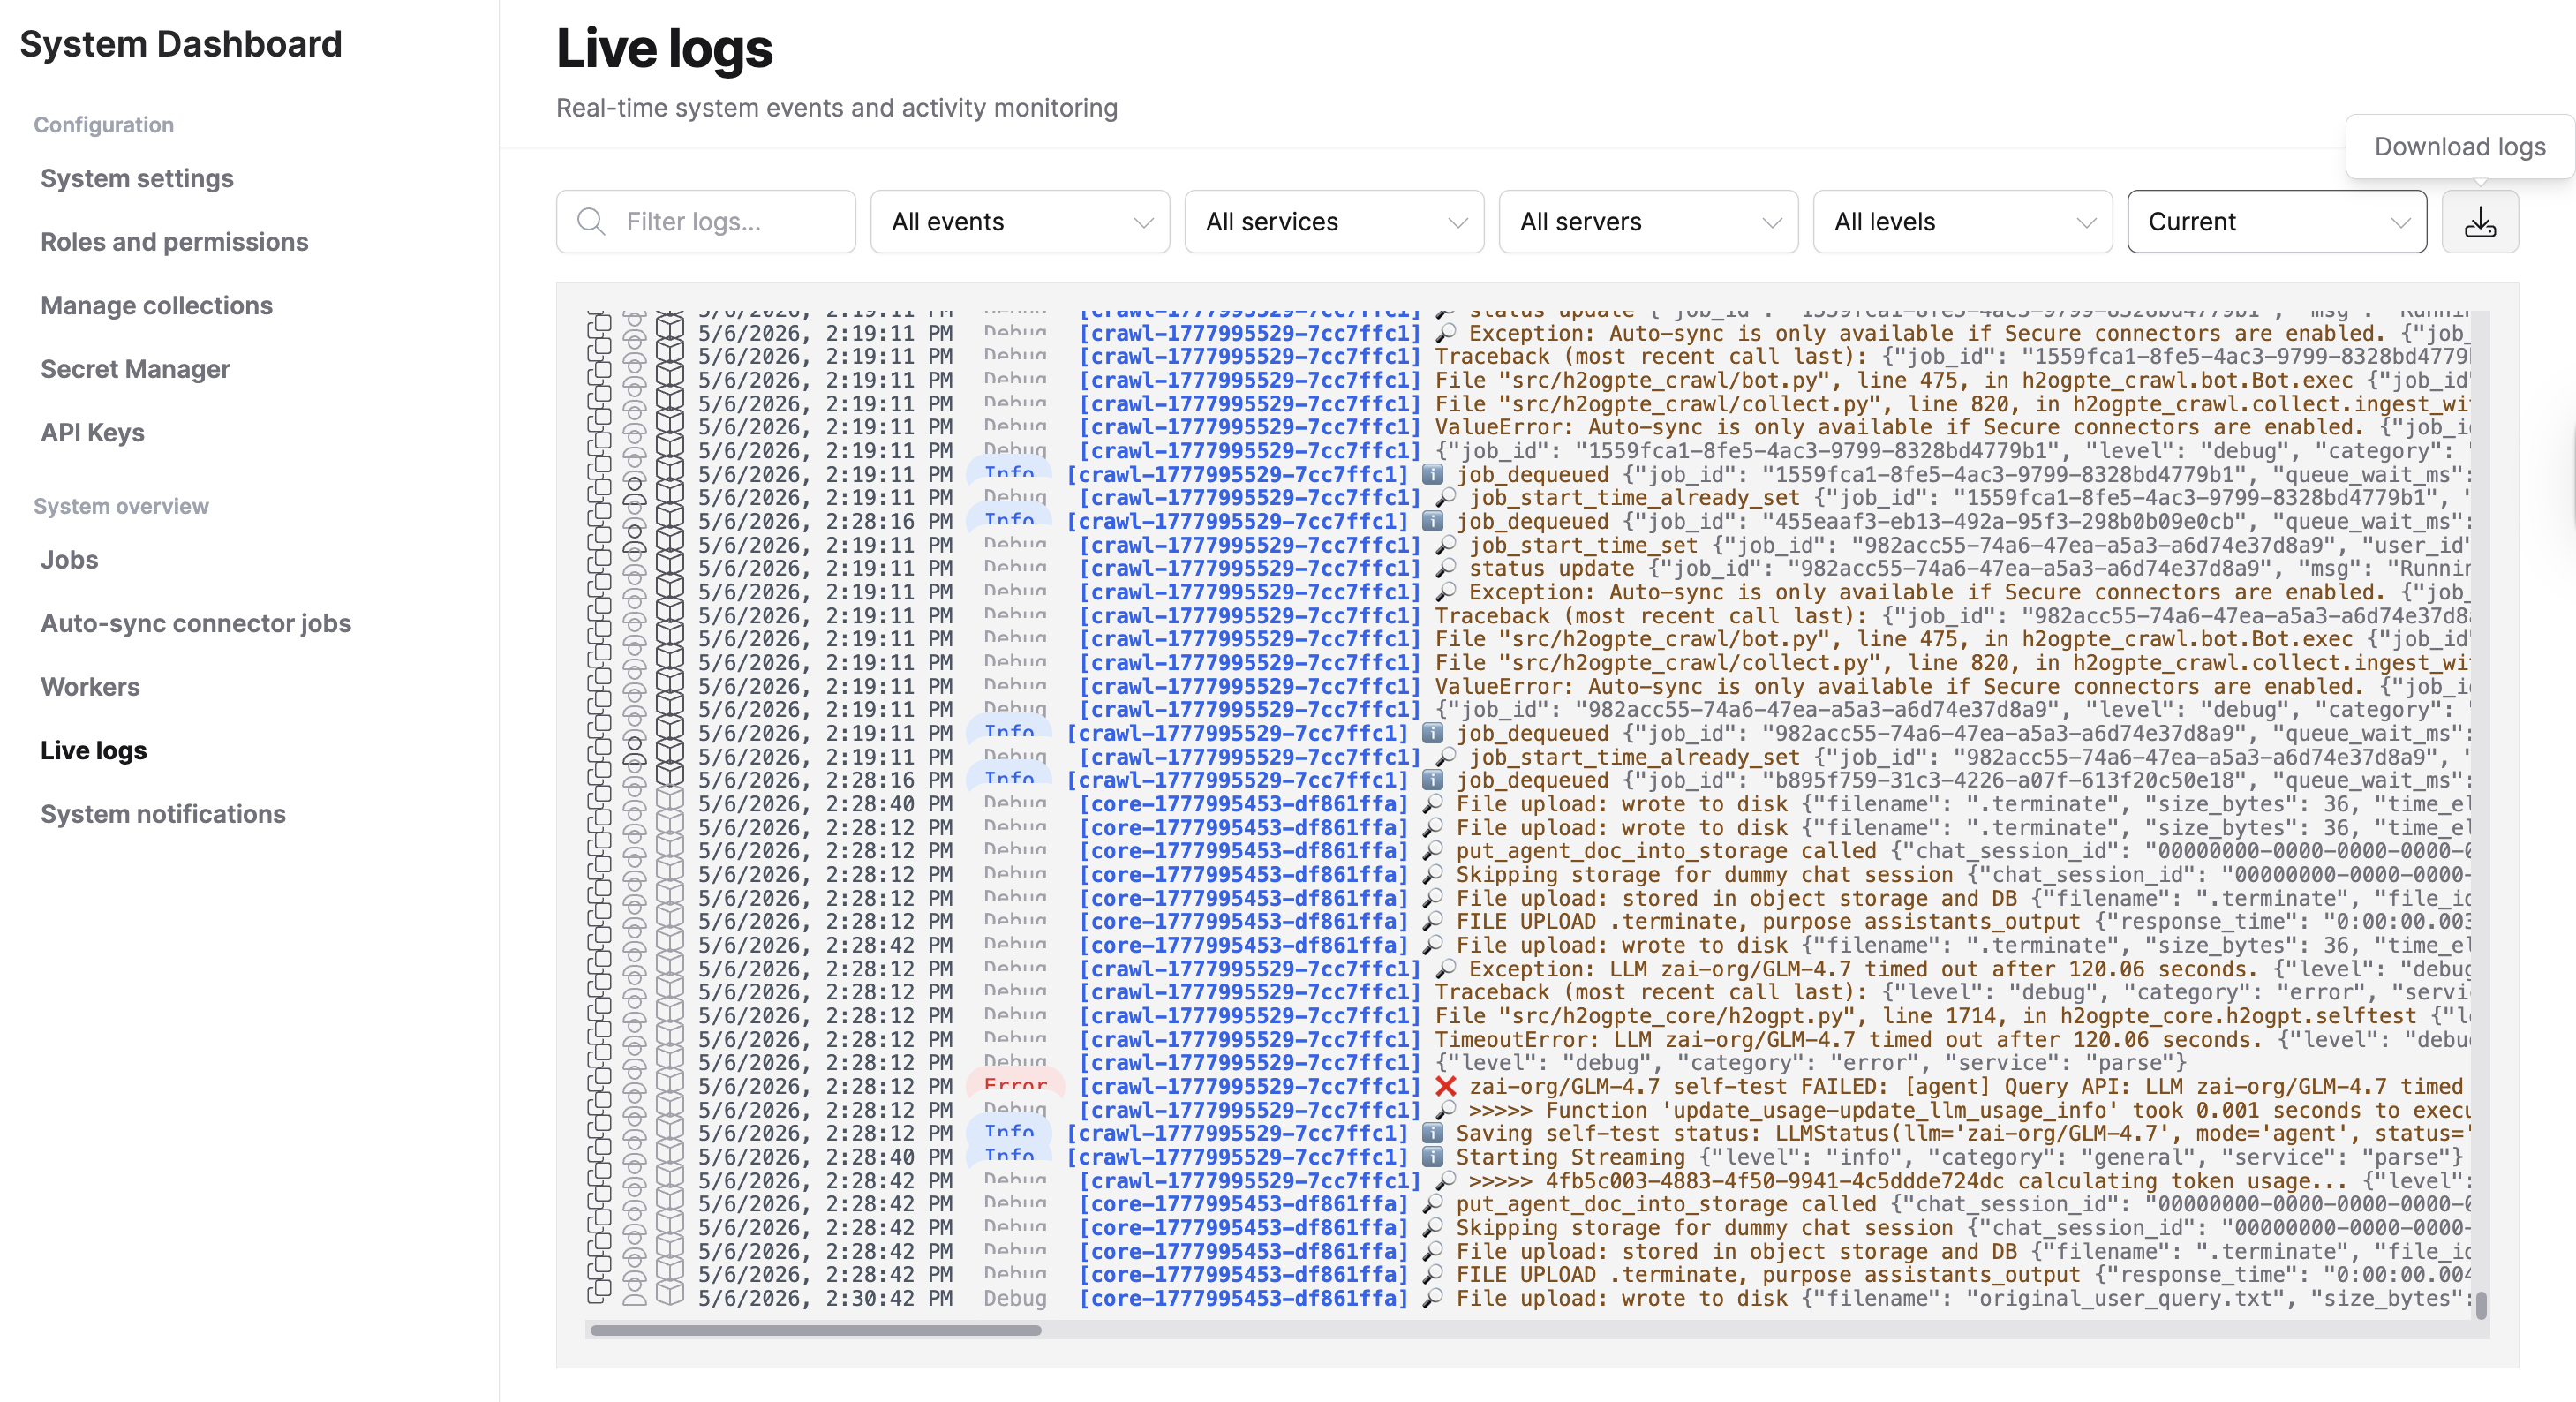
Filter and search logs
The toolbar above the log viewer provides several controls to narrow the displayed entries:
| Control | Description |
|---|---|
| Text filter | Free-text search across log entries, service names, job IDs, user IDs, and arguments. |
| Event dropdown | Filter by a specific log event message. |
| Service dropdown | Filter by service group: crawl, vex, core, chat, or parse. |
| Server dropdown | Filter by a specific service instance. |
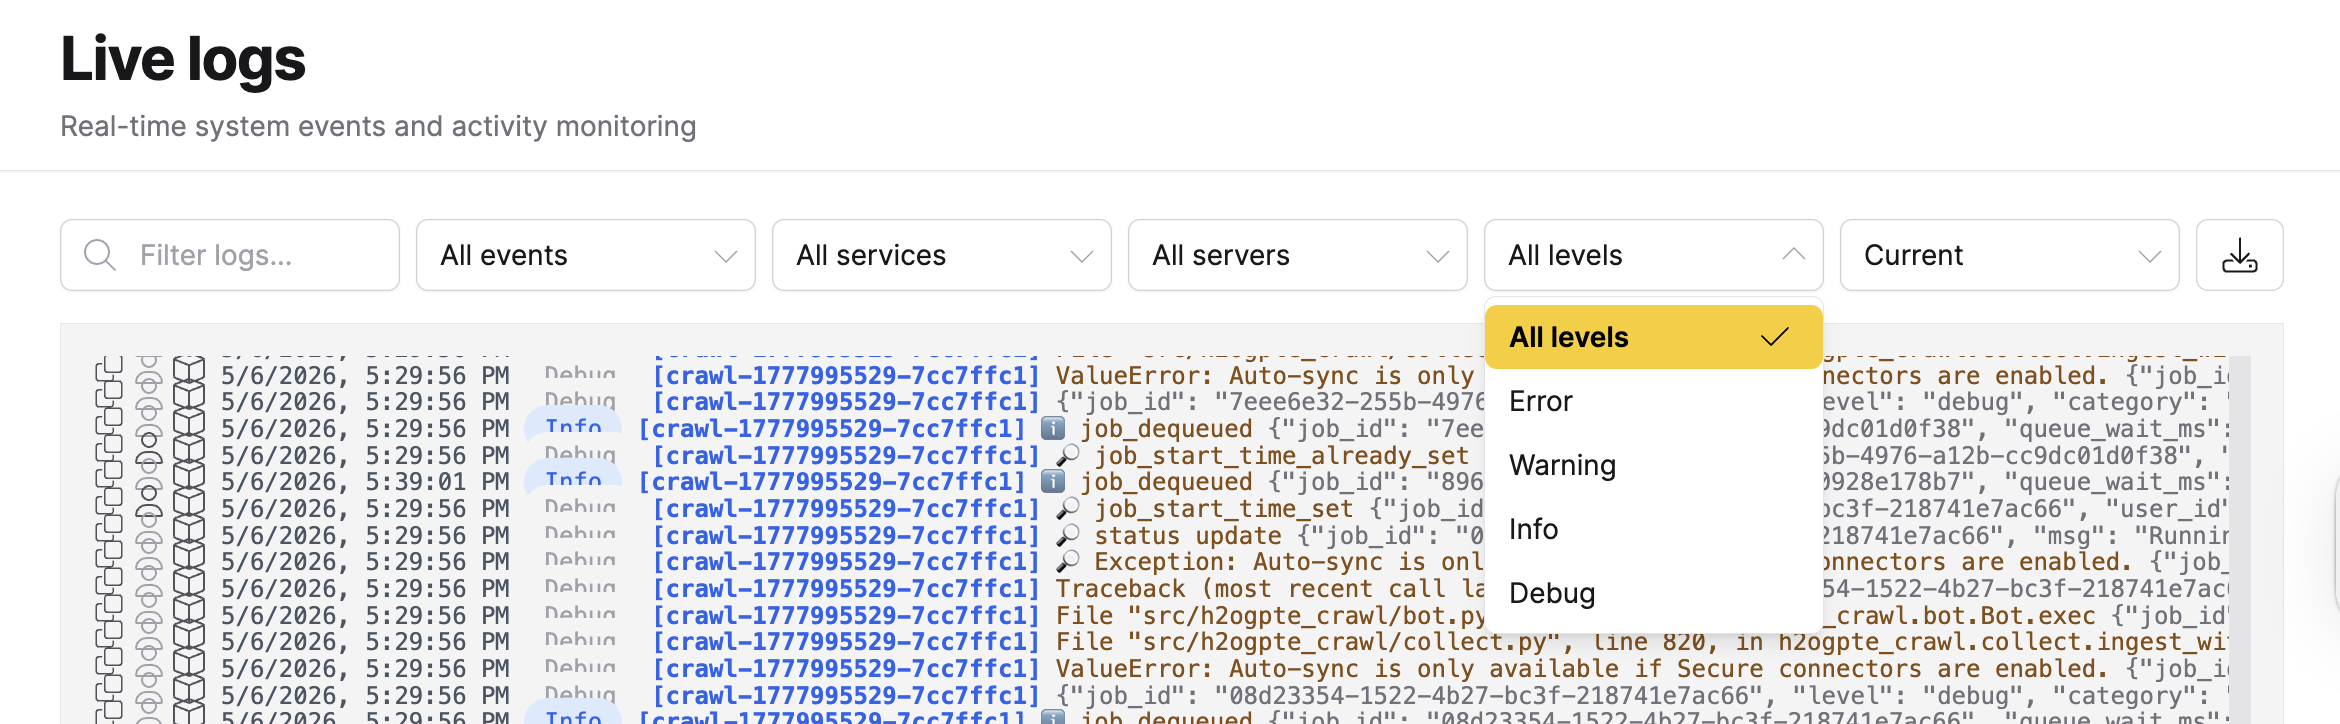
| Log level dropdown | Filter by severity: Error, Warning, Info, or Debug. |
| Time range dropdown | Select a historical time window or stream current events only. |
| Download logs button | Export the currently filtered log entries as a .log file. |
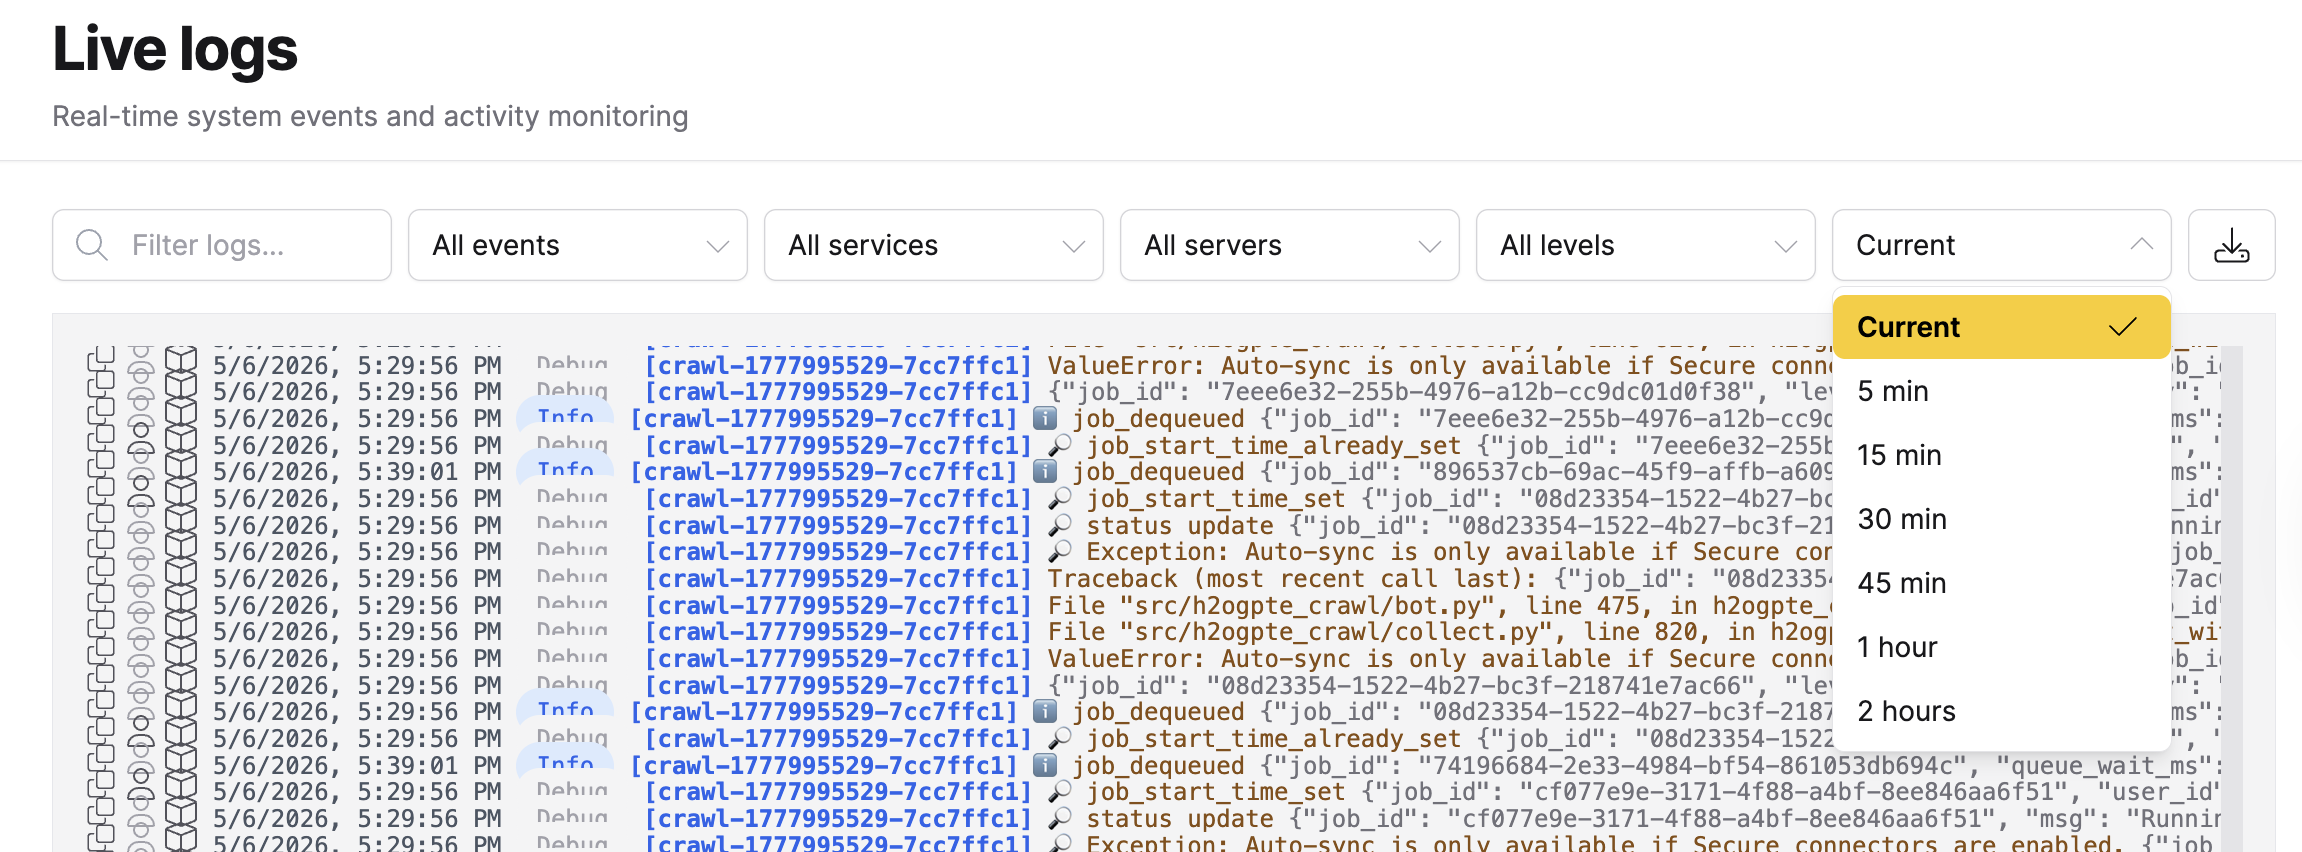
Select a time range
The time range dropdown controls how far back the log viewer displays entries:
| Option | Behavior |
|---|---|
| Current | Stream new events only. The viewer does not load historical entries. |
| 5 min through 2 hours | Load historical entries from the selected window, then continue streaming new events. |
Download logs
Click Download logs in the toolbar to export the currently filtered log entries as a .log file. Download logs is disabled when no log entries match the current filters.
Log entry fields
Three action icons appear to the left of every entry:
![]()
- Copy: Copies the full log entry to your clipboard.
- User: Filters the log view to entries from the same user. Appears grayed out when the entry has no associated user.
- Job: Filters the log view to entries from the same job. Appears grayed out when the entry has no associated job.
Each log entry displays the following information:
| Field | Description |
|---|---|
| Timestamp | Date and time the event occurred, displayed in your local time zone. |
| Log level | Severity of the event, displayed as a color-coded badge. |
| Service name | The service and instance that generated the event (for example, core-a1b2c3). |
| Log entry | A descriptive message about the event. |
| Arguments | Structured data attached to the event, if available. |
Log levels
Log entries are classified by severity. Use the log level to prioritize which entries to investigate:
| Level | Color | Description |
|---|---|---|
| Error | Red | A failure that prevented an operation from completing. Investigate immediately. |
| Warning | Amber | A condition that may lead to errors if not addressed. Review when triaging issues. |
| Info | Blue | Normal operational events such as job completion or configuration changes. |
| Debug | Gray | Verbose diagnostic output. Useful when troubleshooting a specific issue. |
Related topics
- Workers - Monitor service health and worker availability
- Jobs - View and manage background processing jobs
- System settings - Configure platform settings that generate log events
- Submit and view feedback for this page
- Send feedback about Enterprise h2oGPTe to cloud-feedback@h2o.ai