Workers
Overview
A worker is a background process that handles a specific type of task, such as crawling documents, running chat requests, or serving LLM inference. Enterprise h2oGPTe runs eight service types distributed across one or more nodes (machines).
The Workers page gives you a real-time view of every active worker, the nodes they run on, and the task queues they serve. Use it to verify that all required services are running, identify resource constraints, spot overloaded queues, and confirm that new nodes have registered after scaling.
The Workers page requires the Show worker status permission. Only an administrator can assign this permission. If you do not have access, contact your administrator.
Access the Workers page
- In Enterprise h2oGPTe, click Account Circle.
- Select System Dashboard.
- In the System overview section, click Workers.
The Workers page opens and displays system stats and a visual worker grid.
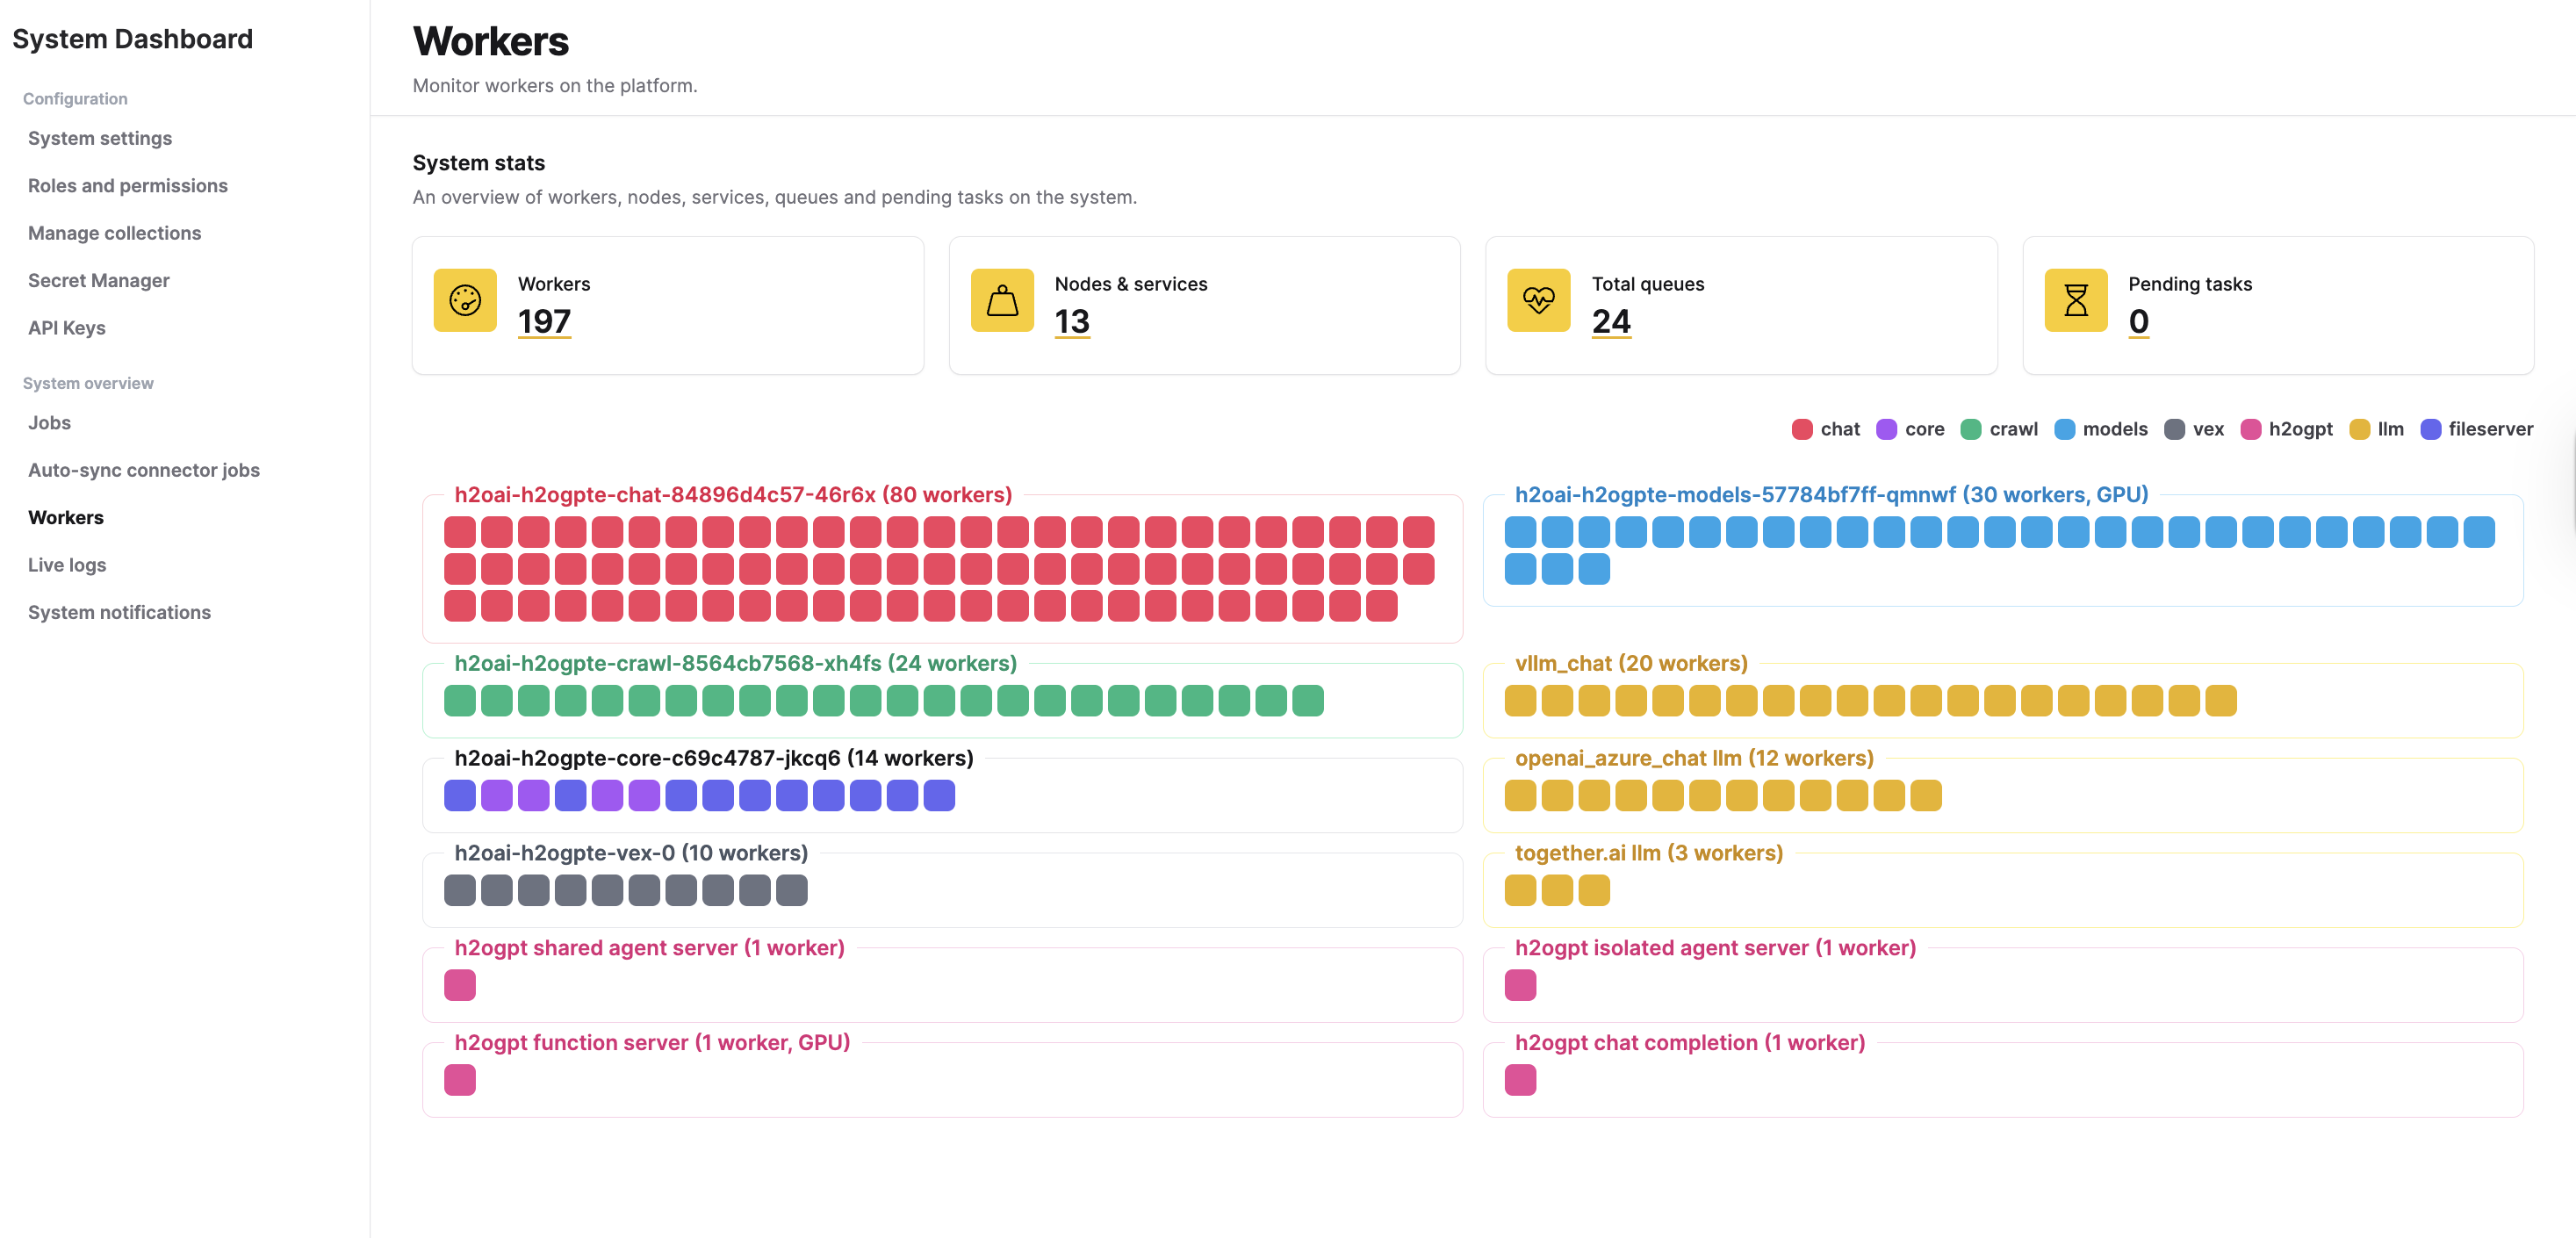
System stats
Four summary cards appear at the top of the page. Click any card to open a dialog with a detailed JSON breakdown.
| Card | Description |
|---|---|
| Workers | Total number of active workers across all nodes. Click to view the full worker list with hostname, queue, PID (process ID), GPU count, and CPU count for each worker. |
| Nodes & services | Number of unique node-service combinations. Click to see the worker count for each node-service pair. |
| Total queues | Number of distinct task queues that have at least one worker assigned. Click to see the worker count per queue. |
| Pending tasks | Total number of tasks waiting in all queues. Click to see the per-queue breakdown of pending tasks. A sustained increase may indicate that workers are not keeping up with demand. |
Worker types
Enterprise h2oGPTe runs eight service types, each displayed with a distinct color in the worker grid:
| Service | Color | Description |
|---|---|---|
| chat | Rose | Chat request handling, LLM prompt execution, and response streaming. |
| core | Purple | Core platform operations, including embedding generation and document processing. |
| crawl | Green | Document ingestion, web crawling, and file processing. |
| models | Sky blue | Model server management and model lifecycle operations. |
| vex | Gray | Vector store operations, including similarity search and index management. |
| h2ogpt | Pink | Agent execution and h2oGPT-based agentic workflows. |
| llm | Yellow | LLM inference serving. |
| fileserver | Indigo | File storage and retrieval operations. |
All eight services must have at least one active worker for the platform to operate normally. If a service has no workers, the system raises a degraded-service warning in the sidebar's system-health indicator.
Worker grid
Below the stat cards, the worker grid displays each node as a bordered card. Workers within a node appear as color-coded squares matching their service type. A color legend appears above the grid.
Each node card shows:
- Node label: The hostname, service type, worker count, and whether the node has GPU resources.
- Worker squares: One square per worker. Hover over a square to view the full worker details, including hostname, IP address, PID, queue assignment, GPU count, and CPU count.
Nodes are sorted by worker count, with the largest nodes first.
If no workers are registered, the grid displays No workers to display. When workers are detected, they appear here.
Real-time updates
The Workers page refreshes automatically every 30 seconds. The system also pushes updates to the page immediately when a worker registers or expires, so you see node changes without waiting for the next refresh interval.
If a worker stops responding, the system removes it from the dashboard after 4 minutes and flags any dependent service as degraded.
Interpret common patterns
Use the following table to diagnose common patterns on the Workers page:
| What you see | What it means | Recommended action |
|---|---|---|
| All eight services have active workers | The platform is operating normally. | No action required. |
| A service type has no workers | That service is degraded. Dependent features are unavailable. | Check the node running that service. Review Live logs for error details. |
| Pending tasks count is growing | Workers are not processing tasks fast enough. | Check whether workers are healthy. Consider scaling the affected service. |
| A node card shows fewer workers than expected | A worker process may have crashed or an operator may have stopped it. | Review logs on that node. The worker restarts automatically when managed by an orchestrator. |
| Pending tasks count is zero | All queues are empty and workers are idle. | Normal during low-traffic periods. |
Related topics
- Live logs - Monitor real-time platform events and troubleshoot issues
- Jobs - View and manage background processing jobs
- System settings - Configure platform settings including service-level parameters
- Submit and view feedback for this page
- Send feedback about Enterprise h2oGPTe to cloud-feedback@h2o.ai