Interactive visualizations
Overview
Enterprise h2oGPTe can render interactive HTML visualizations inline within chat responses. When using the Interactive Visualizer prompt template, the LLM generates self-contained HTML/CSS/JavaScript demos that appear as embedded, interactive elements in the conversation. These visualizations can include charts, data explorers, animated diagrams, and other interactive content.
A secure, sandboxed environment renders each visualization and automatically adapts to your current theme (light or dark mode).
Using interactive visualizations
Select the Interactive Visualizer prompt template
To enable interactive visualizations in your chat responses:
- Start a new chat or open an existing chat session.
- Click Customize.
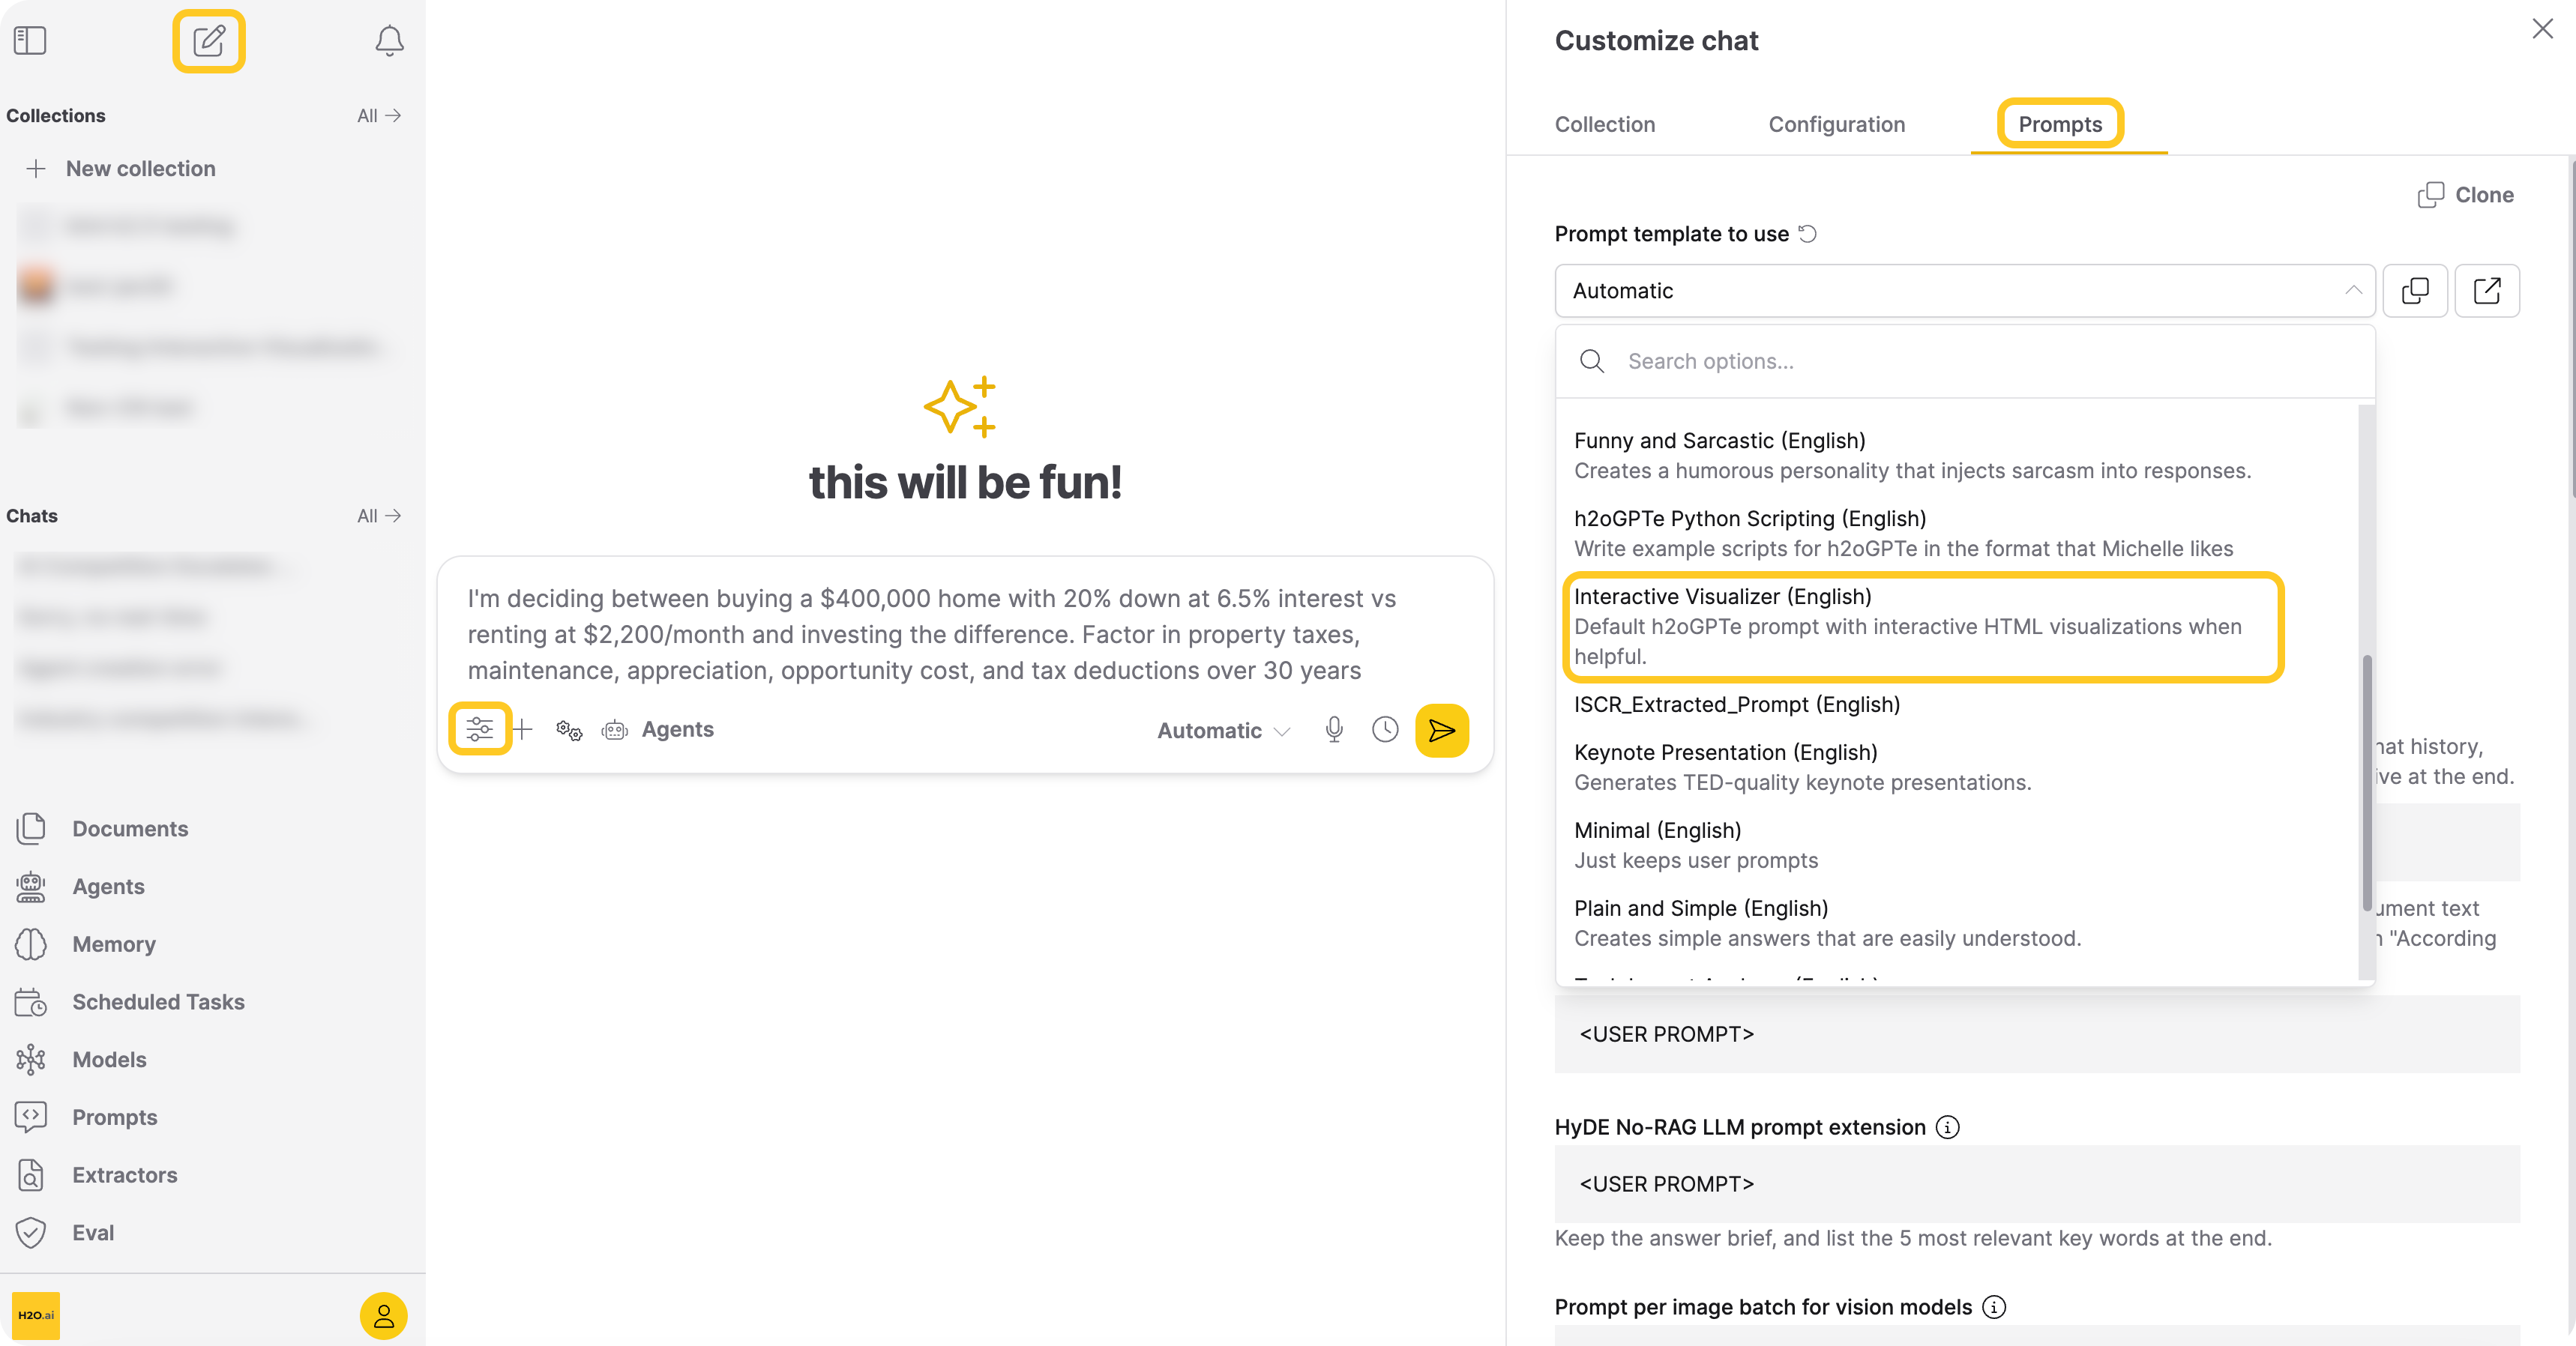
- Go to the Prompts tab.
- In the Prompt template to use dropdown, select Interactive Visualizer.
- Ask a question where an interactive demo would help understanding—for example, about data distributions, algorithms, or comparisons.
The LLM includes an interactive visualization in its response when it determines a visual would help explain the answer.
You don't need to explicitly ask for a visualization. The Interactive Visualizer prompt template instructs the model to include one whenever it would aid understanding. You can also request one directly—for example, "Show me an interactive chart of…"
Interact with visualizations
Each interactive visualization appears as an embedded panel within the chat response. You can:
- Interact with the content—click buttons, adjust sliders, hover over chart elements, and explore the visualization directly.
- Refresh—hover over the visualization and click the refresh button in the top-right corner to re-render the visualization.
- Copy source—hover over the visualization and click the copy button to copy the underlying HTML source code to your clipboard.
Edits made within an interactive visualization (for example, adjusting a slider or entering values) are not saved. Refreshing the visualization or reloading the page resets it to its initial state.
Streaming behavior
Interactive visualizations support real-time streaming. A Generating… indicator appears in the top-left corner of the visualization panel while the LLM is generating, and disappears once the visualization is fully interactive.
If a visualization fails to generate or appears incomplete, try increasing the Output Token Limit in Customize > Configuration > Show Expert Settings. Code generation for interactive visualizations can require higher output token counts than typical responses. See Customize a Chat session for details.
Theme support
Interactive visualizations automatically adapt to your current Enterprise h2oGPTe theme. When you switch between light and dark mode, all visualizations in the conversation re-render to match the new theme. The visualizations use your app's color palette, based on CSS variables such as --color-primary and --color-secondary, for backgrounds, text, borders, and accent colors. You can refer to the built-in Interactive Visualizer prompt template for the full list of supported variables.
Supported libraries
The Interactive Visualizer prompt template instructs the LLM to use the following CDN-hosted libraries when generating visualizations:
| Library | Use case |
|---|---|
| Tailwind CSS | Utility-first CSS framework for responsive layouts |
| Chart.js | Charts and data visualizations |
| Three.js | 3D graphics and animations |
| Font Awesome | Icons |
Tailwind CSS is automatically included in every visualization. The LLM selects other libraries as needed based on the content it generates.
Creating a custom interactive visualizer prompt
You can create your own prompt template based on the built-in Interactive Visualizer template. This allows you to customize the system prompt while keeping the interactive visualization capability. To learn how to create custom prompt templates, see Prompts.
When creating a custom template, include the <interactive_viz> tag instructions in your system prompt to enable visualization rendering. The built-in Interactive Visualizer template provides a reference for the required format and rules.
Security
Interactive visualizations run inside a sandboxed iframe with the allow-scripts policy. This means:
- Visualizations can run JavaScript for interactivity (charts, animations, controls).
- Visualizations cannot access the parent page, your cookies, or any Enterprise h2oGPTe data.
- Visualizations cannot display browser dialogs (
alert,prompt,confirm). - The prompt template instructs the LLM to use only approved CDN-hosted libraries.
- Submit and view feedback for this page
- Send feedback about Enterprise h2oGPTe to cloud-feedback@h2o.ai