Usage Insights
The Usage Insights page lets you track chat activity, model cost, quota, guardrails, and feedback across your workspace.
To open the page, click the profile icon at the bottom of the sidebar, then click Usage Insights.
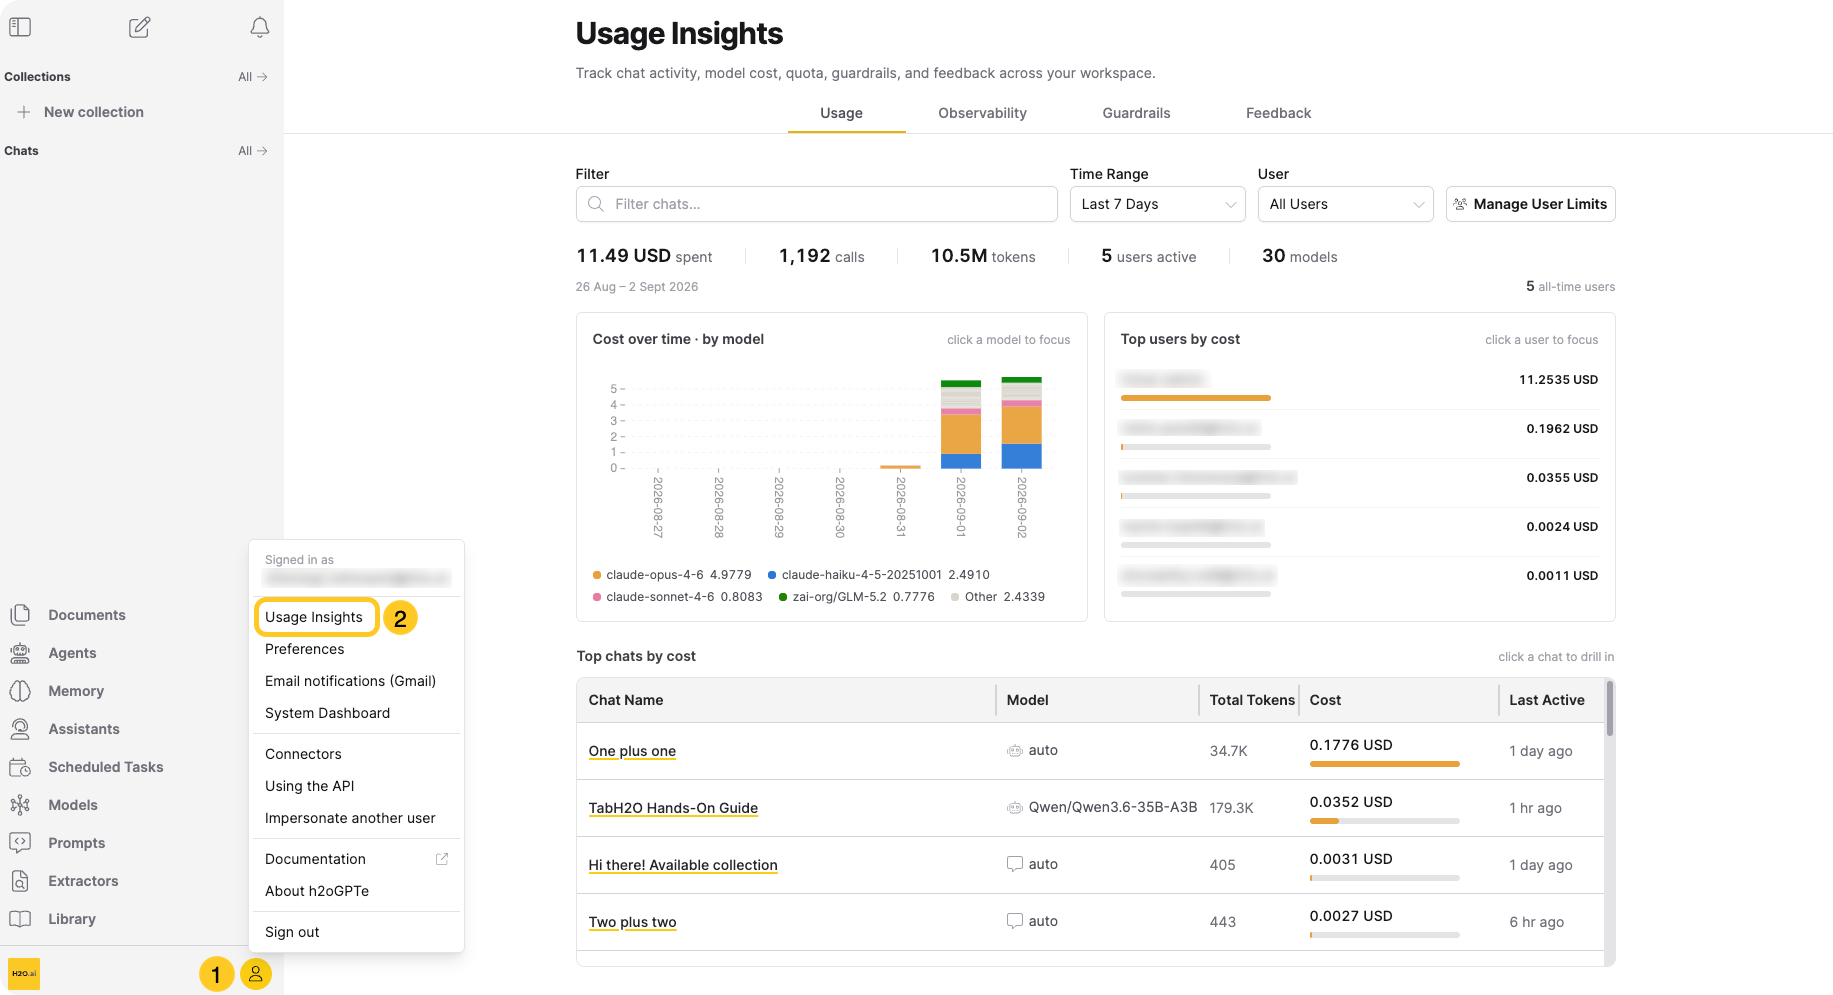
Usage Insights requires the Display chat insights page permission. The Default and User roles have this permission by default. The Guest role doesn't. To configure role permissions, see Roles and permissions.
The page has the following tabs:
- Usage (default)
- Observability
- Guardrails (administrator only)
- Feedback
Page-level controls
A Time Range dropdown, and a User dropdown for administrators, appear in the toolbar of every tab. Both persist as you switch tabs, so narrowing to a user or a time window carries across Usage, Observability, and Guardrails.
- Time Range: Last 24 Hours, Last 7 Days (default), Last 30 Days, Last 90 Days.
- User (administrator only): Filter every tab to a single user's activity. Defaults to All Users.
The Feedback tab has its own Time Range dropdown and no User dropdown. It's the only tab that offers an All time option, defaulting to Last 90 Days.
Usage Insights doesn't refresh on its own. Data reloads when you switch tabs or change the time range or user.
Usage
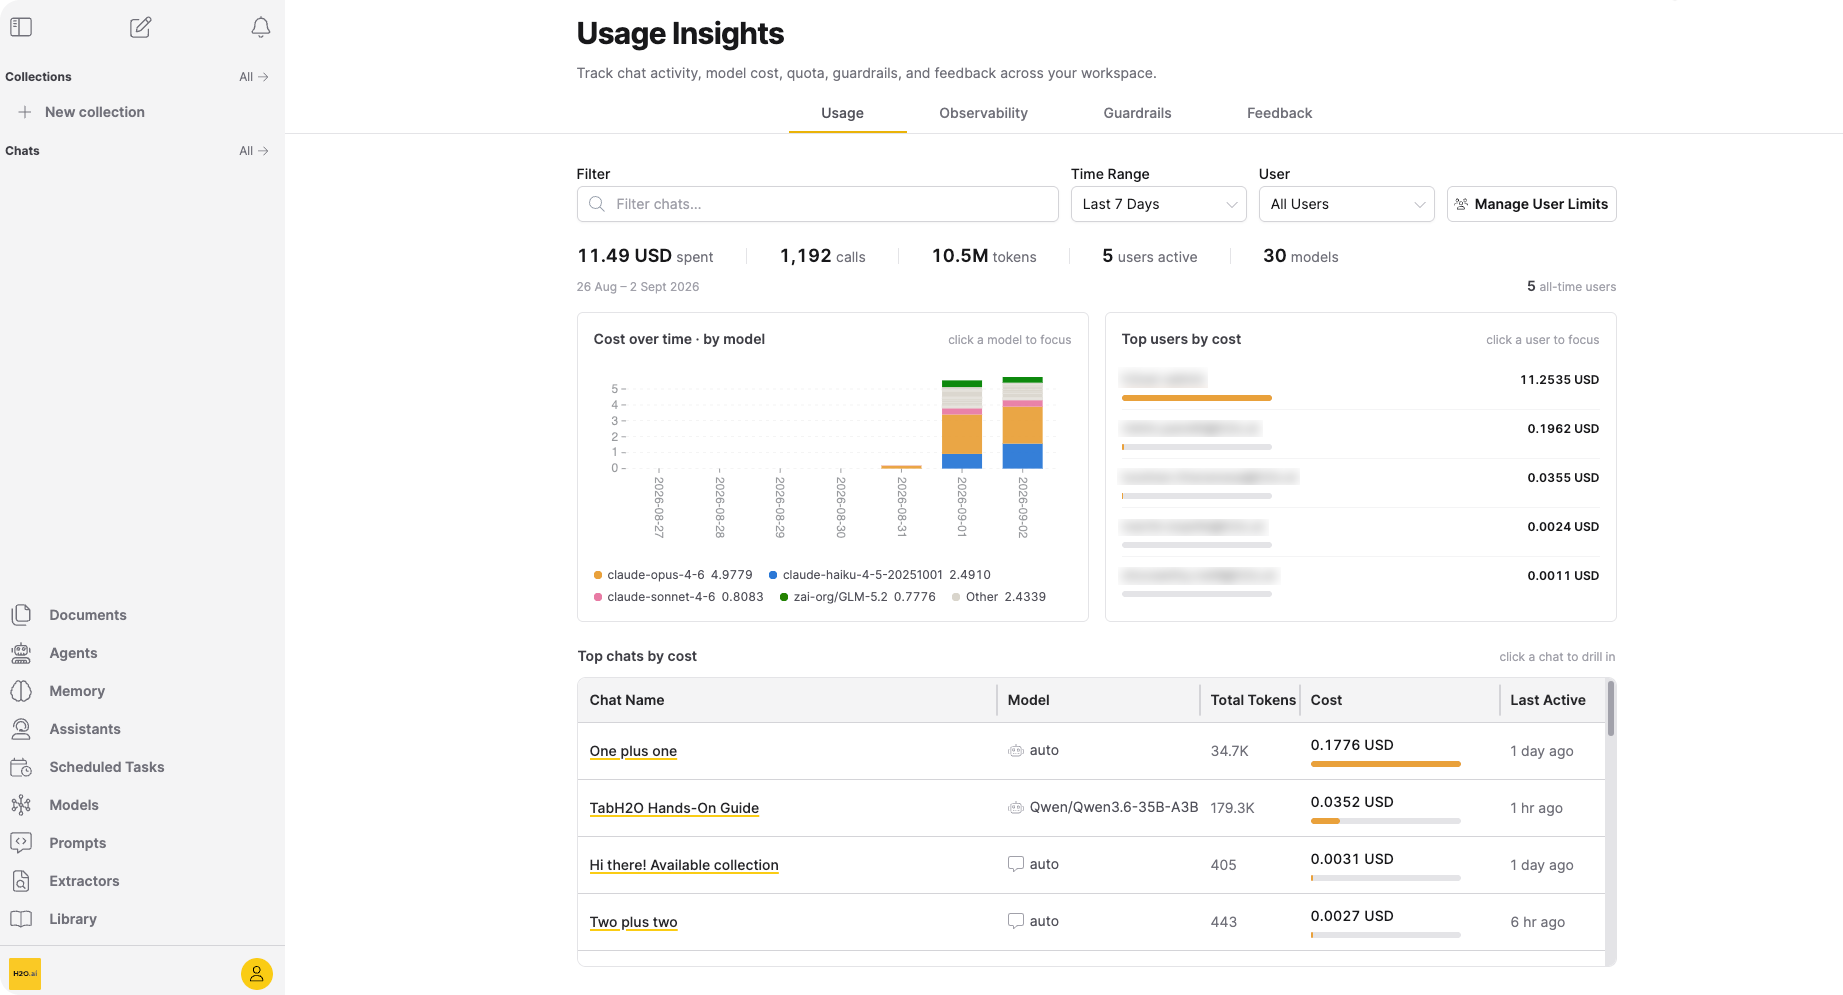
The Usage tab shows cost, tokens, and quota. This tab opens by default, with a chart of cost over time, a ranked list of top users, and a table of chats ranked by cost that you can open for a full cost breakdown.
Filters
- Filter: Text search across chats or usernames.
- Time Range / User: See Page-level controls.
Administrators also see a Manage User Limits button (see Manage user limits).
Summary strip
A single line preceding the chart reports, for the selected time range:
- Spent: Combined LLM cost.
- Calls: Number of LLM API calls.
- Tokens: Sum of input and output tokens.
- Users active (administrator only, hidden when a single user is selected): Number of distinct users with activity.
- Models: Number of distinct models used.
Each metric except Models also shows its change against the immediately preceding period of the same length. Guardrail and feedback rates change in percentage points; hover the change to see the two rates it compares.
Below the metrics, a line shows the exact dates the selected range covers.
Administrators also see the all-time user count for the workspace. Non-administrators see their own quota usage appended instead (for example, "$1.20 of $5.00 USD usage limit used", or "$1.20 spent to date · no usage limit" when no cap is set). See Usage and quota for how your own usage limit is set.
Guest activity counts toward Spent, Calls, and Tokens, but guests aren't counted in Users active or in the all-time user total. Both user counts report signed-in users only, so a workspace with heavy guest traffic shows cost without a matching rise in users.
Cost over time chart
A stacked chart shows daily cost broken down by model. The legend lists the four costliest models; everything else rolls into a grey Other series. Click a model in the chart or the legend to focus on it alone, and click again to clear.
Top users by cost (administrator only)
Administrators see a ranked list of the top five users by cost beside the chart whenever the period has any activity, each with an inline cost bar. Click a user to filter the page to that user, the same as selecting them from the page-level User dropdown.
Top chats by cost
A table below the chart and top-users list ranks chats by cost, with the following columns:
- Chat Name: Click to open the cost drill-in for that chat.
- Model: The LLM used for the chat.
- Total Tokens
- Cost: Value with an inline cost bar relative to the highest-cost chat shown.
- Last Active: Relative time.
If the ranking only covers the most recent chats in the selected time range, a note reads "Only the most recent chats in this range are ranked. Narrow the time range for a complete ranking."
When there's no cost data at all for the period, the chart, top-users list, and table are replaced together with "No cost data available." and the hint "Cost and token usage will appear here as sessions run." When a filter or search narrows just the table to nothing, the table alone displays "No matching chats."
Cost drill-in
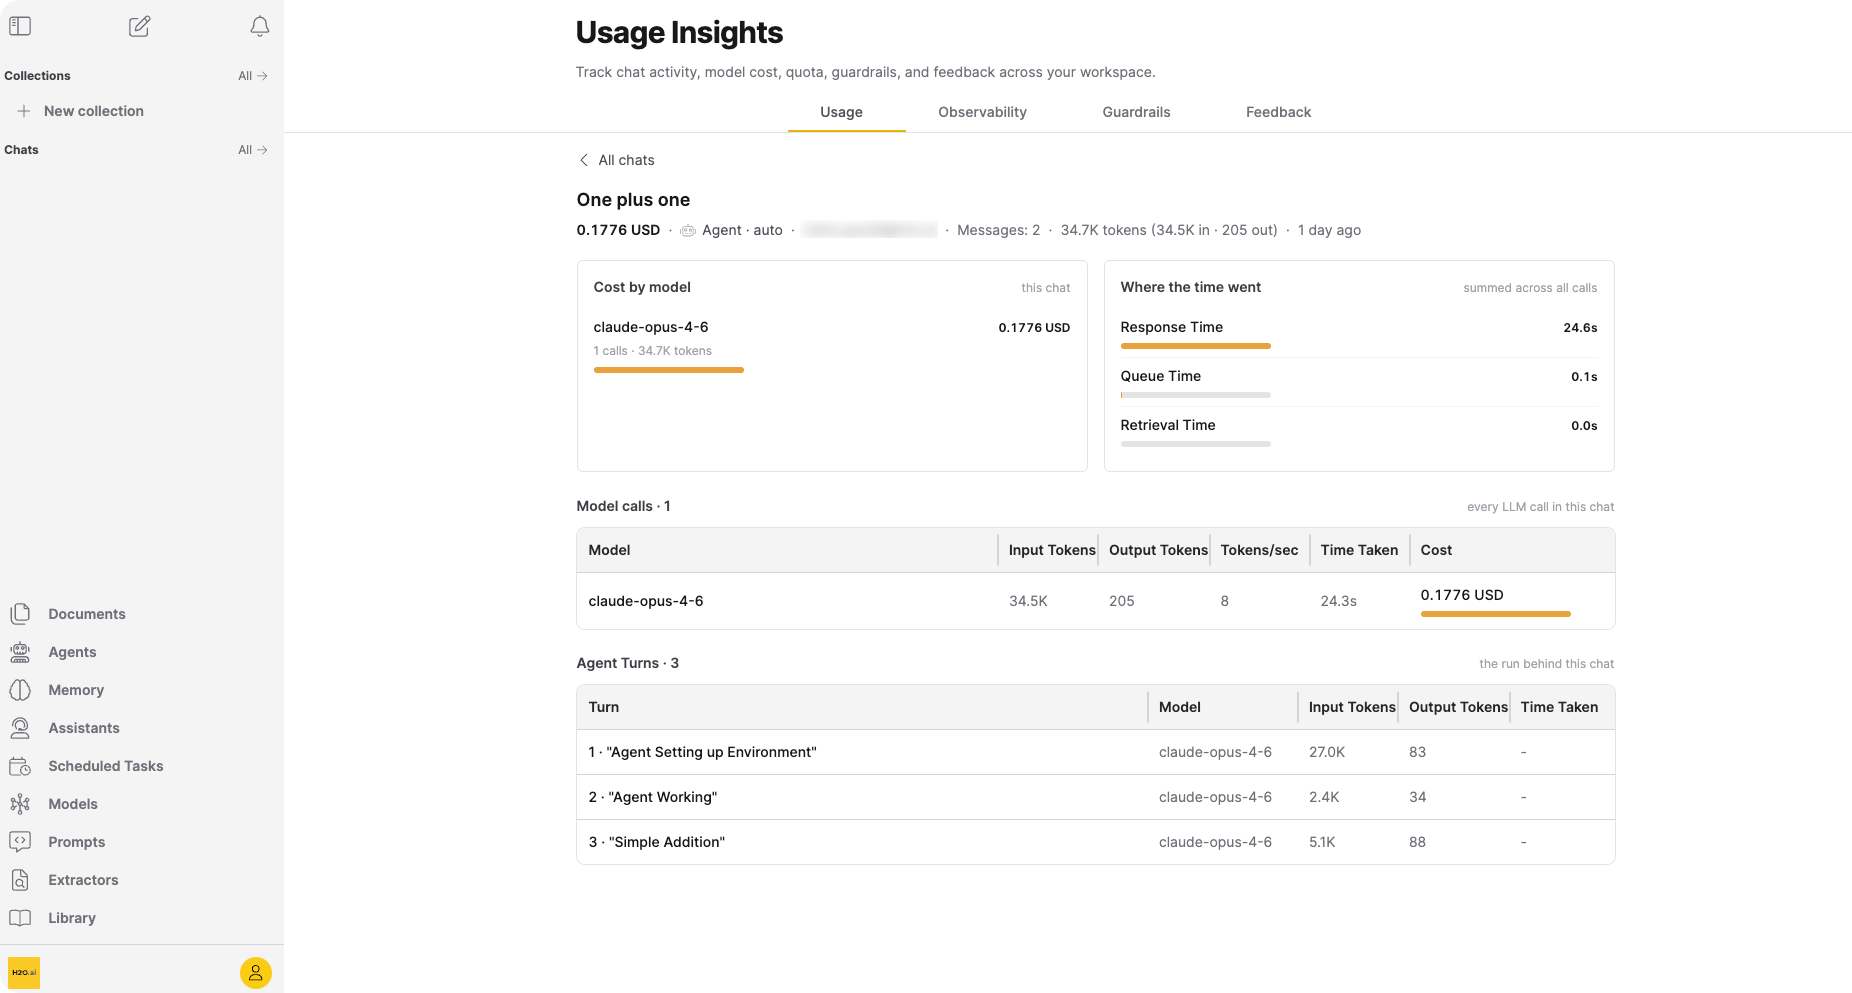
Click a chat's name to open its cost breakdown. The header shows an All chats link, the chat name, and a summary line with total cost, type/model, user, message count, token breakdown, and last-active time.
Below the header:
- Cost by model: Per-model cost rank for this chat (calls, tokens, cost), with an inline bar.
- Where the time went: Response time, queue time, and retrieval time, summed across all calls in the chat, with an inline bar.
- Model calls (section header shows the call count, for example, "Model calls · 5"): A table of every LLM call in the chat, with columns Model, Input Tokens, Output Tokens, Tokens/sec, Time Taken, Cost.
- Agent Turns (agent sessions only): Section header shows the turn count (for example, "Agent Turns · 5"). Below it, an Agent Query Analysis line appears when available, followed by a per-turn table with columns Turn (the turn number and its title), Model, Input Tokens, Output Tokens, Time Taken.
Manage user limits (administrator only)
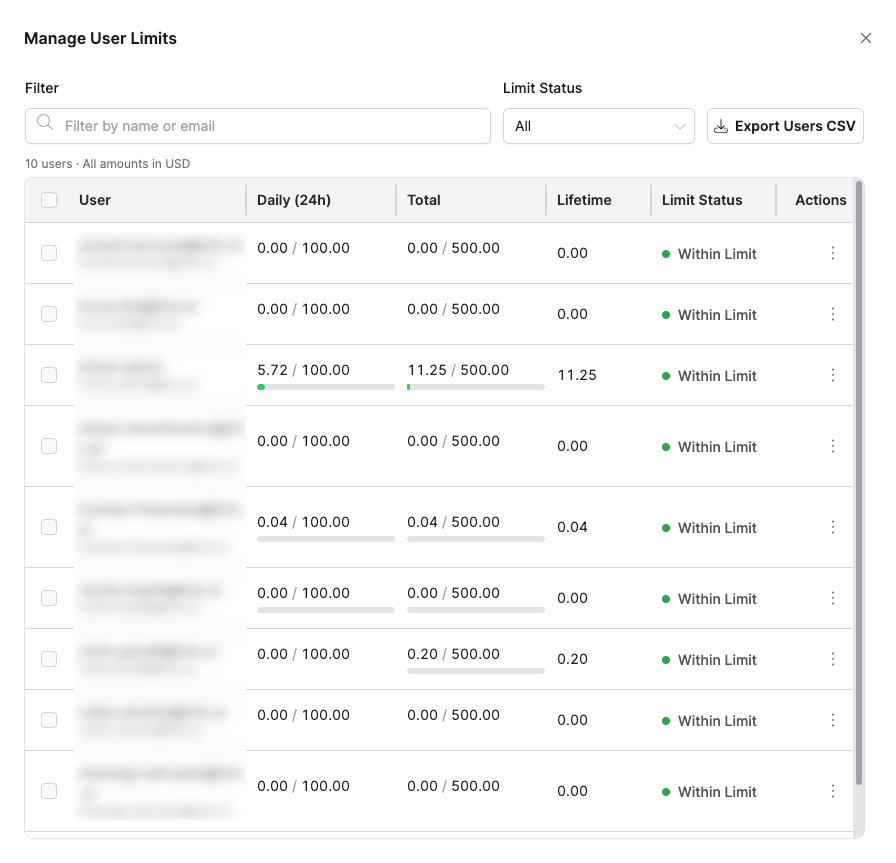
Click Manage User Limits in the Usage tab's toolbar to open the Manage User Limits dialog, which lists all users alongside their current spending status.
Filters
- Filter: Text search by name or email.
- Limit Status: Dropdown to filter by Within Limit, Approaching, or Blocked. Defaults to all statuses.
Each row shows:
- Daily (24h): The user's daily spending cap and current spend, with a progress bar.
- Total: The user's cumulative spending cap and current spend, with a progress bar.
- Lifetime: The user's total cost to date.
- Limit Status: Within Limit, Approaching, or Blocked.
Each row's Actions menu offers:
- Edit daily limit: Opens a dialog to set the user's daily spending cap. If a per-user override already exists, the dialog also offers a Reset to Global Default button.
- Edit total limit: Opens a dialog to set the user's cumulative spending cap. If a per-user override already exists, the dialog also offers a Reset to Global Default button.
- Reset Total Usage: Resets the user's cumulative spend to zero.
A line preceding the table reports how many users are in scope and confirms amounts are shown in USD (for example, "42 users selected · All amounts in USD").
Click Export Users CSV preceding the table to open a confirmation dialog showing how many users will be exported. Confirm to download the CSV for the selected users, or for every user if none are selected. The button is disabled when there are no rows in scope.
Observability
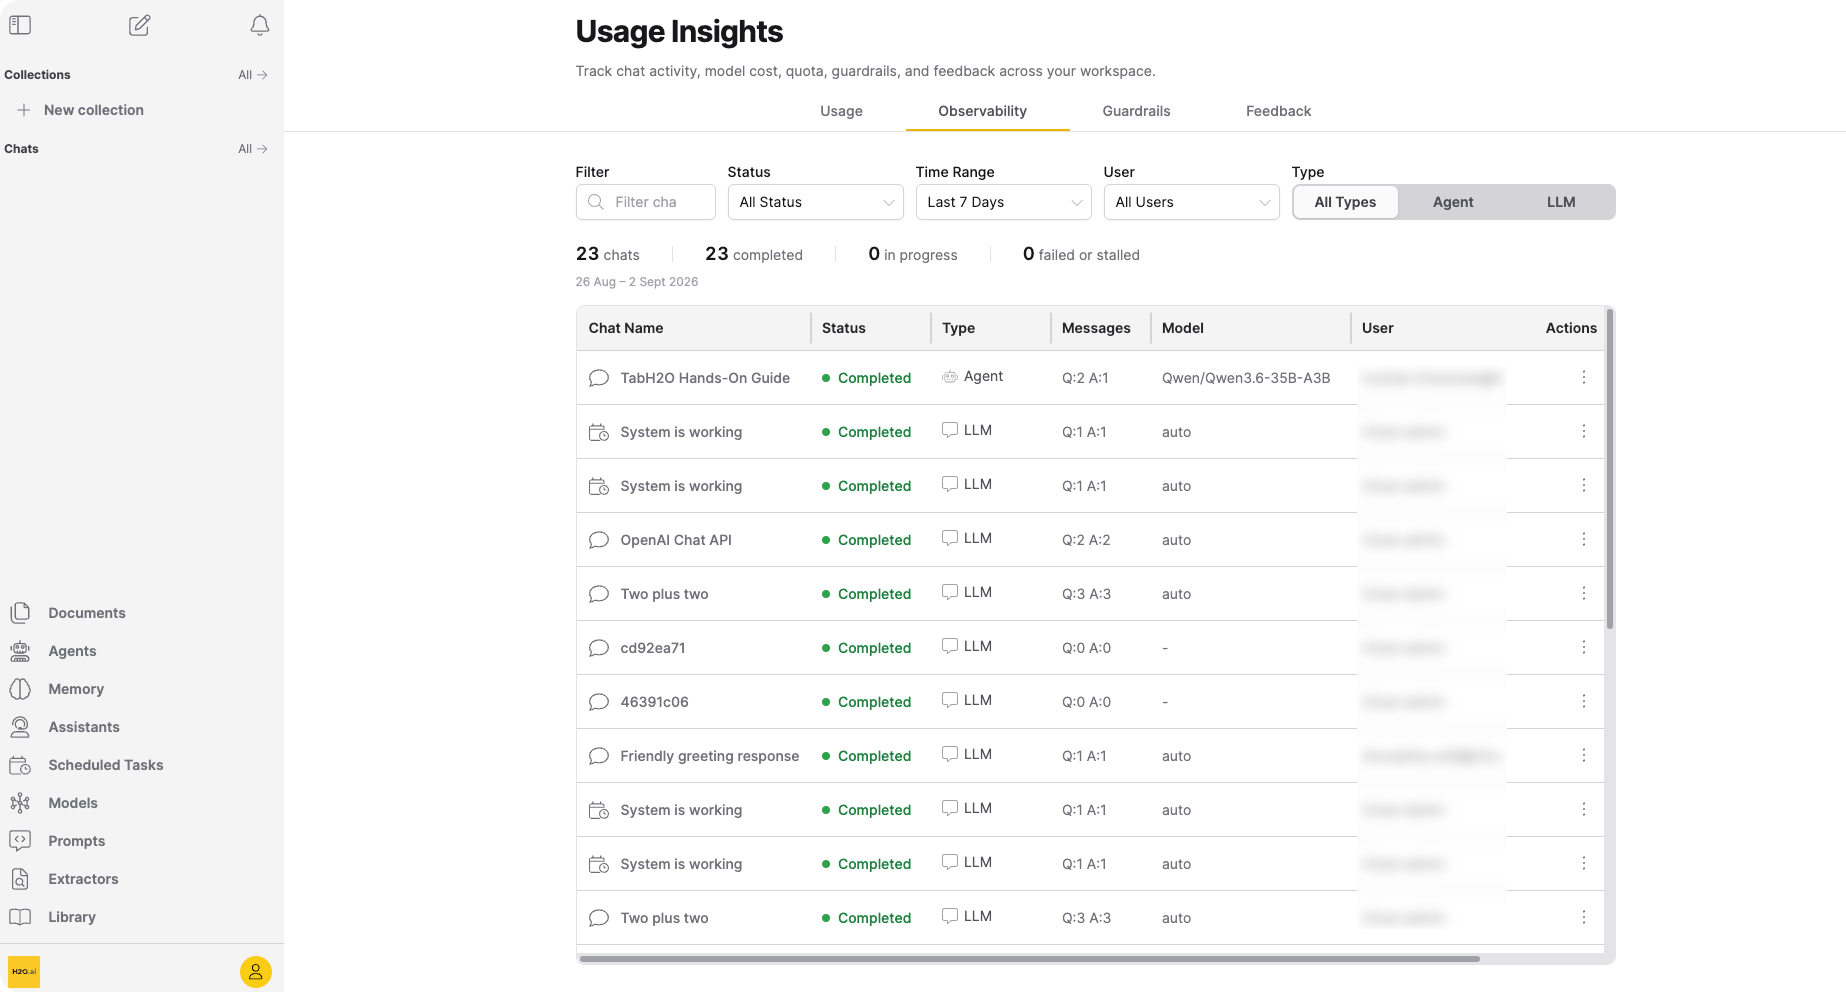
The Observability tab shows live session status, errors, and message counts.
Filters
- Filter: Text search across sessions.
- Status: All Status (default), Failed or stalled, In Progress, Completed.
- Time Range / User: See Page-level controls.
- Type: All Types (default), Agent, or LLM, as segmented toggle buttons rather than a dropdown like the other filters. Sessions of type RAG (see Session table) can't be filtered individually; filter by Agent, LLM, or leave it at All Types.
Summary strip
A single line preceding the table reports, for the selected time range: total chats, completed, in progress, and failed or stalled counts.
Below the metrics, a line shows the exact dates the selected range covers.
Session table
The table lists each session with the following columns:
- Chat Name: Clickable link that opens the chat session. Only clickable for your own chats.
- Status: Completed (green), In Progress (amber, animated), Stalled (gray), or Error (red).
- Type: Whether the chat used an Agent, RAG, or a plain LLM.
- Messages: Format "Q:1 A:1".
- Model: The LLM used for the session.
- User: The user who created the session. Non-administrators see their own username; administrators see the session owner.
- Last Active: Relative time. Hover for the absolute timestamp.
Each row has an Actions menu. Open Chat and View Details appear only for your own chats:
- Open Chat: Opens the chat session.
- View Details: Opens the session detail view.
- Copy ID: Copies the session ID to the clipboard.
- Error Message: Opens a dialog with the full error text. Appears only when the session has an error.
- Open Collection: Opens the linked collection. Appears only when the session has a linked collection.
When there are no sessions yet, the table displays "No chat sessions yet." with the hint "Start chatting to see insights here." When a filter or search narrows the results to nothing, the table displays "No matching chat sessions."
Session detail view
Click View Details on any session to open the detail view. The header shows a Back to list button, the session name, and an Open Chat link (own chats only).
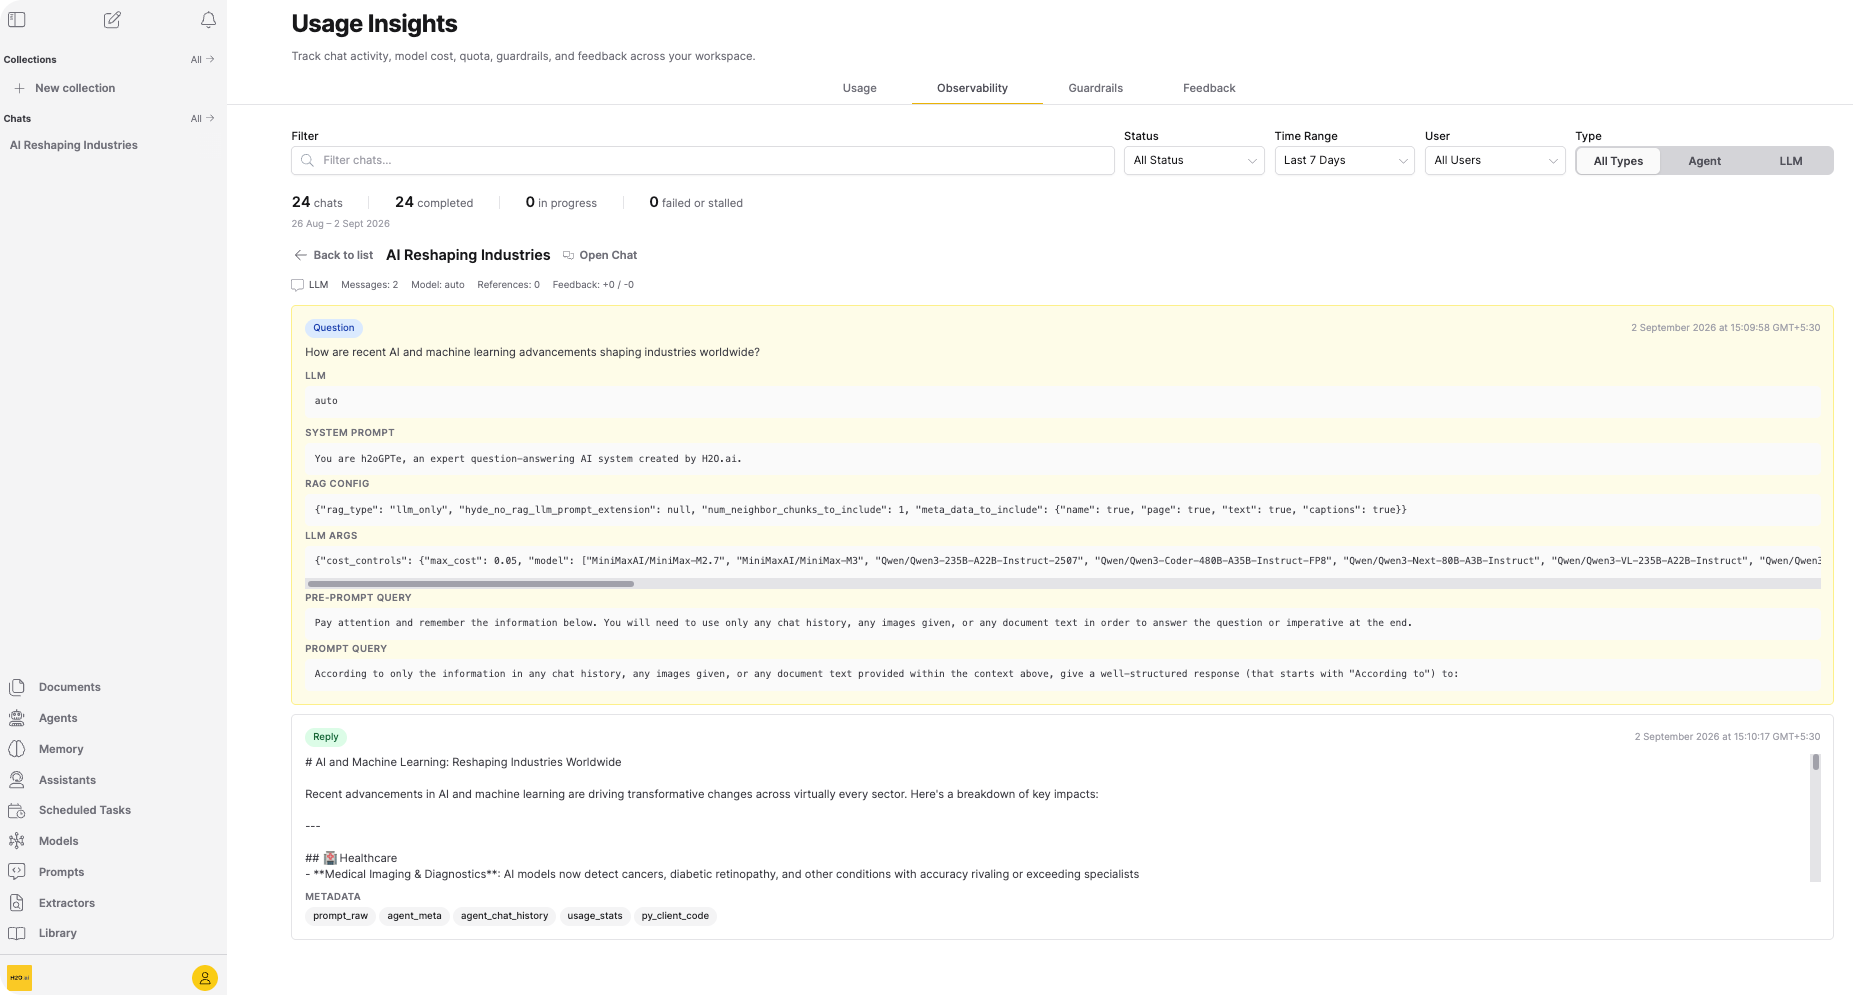
A single line below the header reports: type, message count, model, reference count, and feedback (+/- vote counts).
Each message in the session appears as a card with:
- Badges: Question (blue) or Reply (green), plus Agent (indigo), Error (red), and Votes when applicable.
- Content: The message text. Errors appear in a separate section below.
- Config sections (question messages only): Collapsible sections for LLM, System Prompt, RAG Config, LLM Args, Self Reflection, Pre-prompt Query, and Prompt Query. Each section appears only when data exists.
- Metadata: Message type badges and reference count.
Guardrails
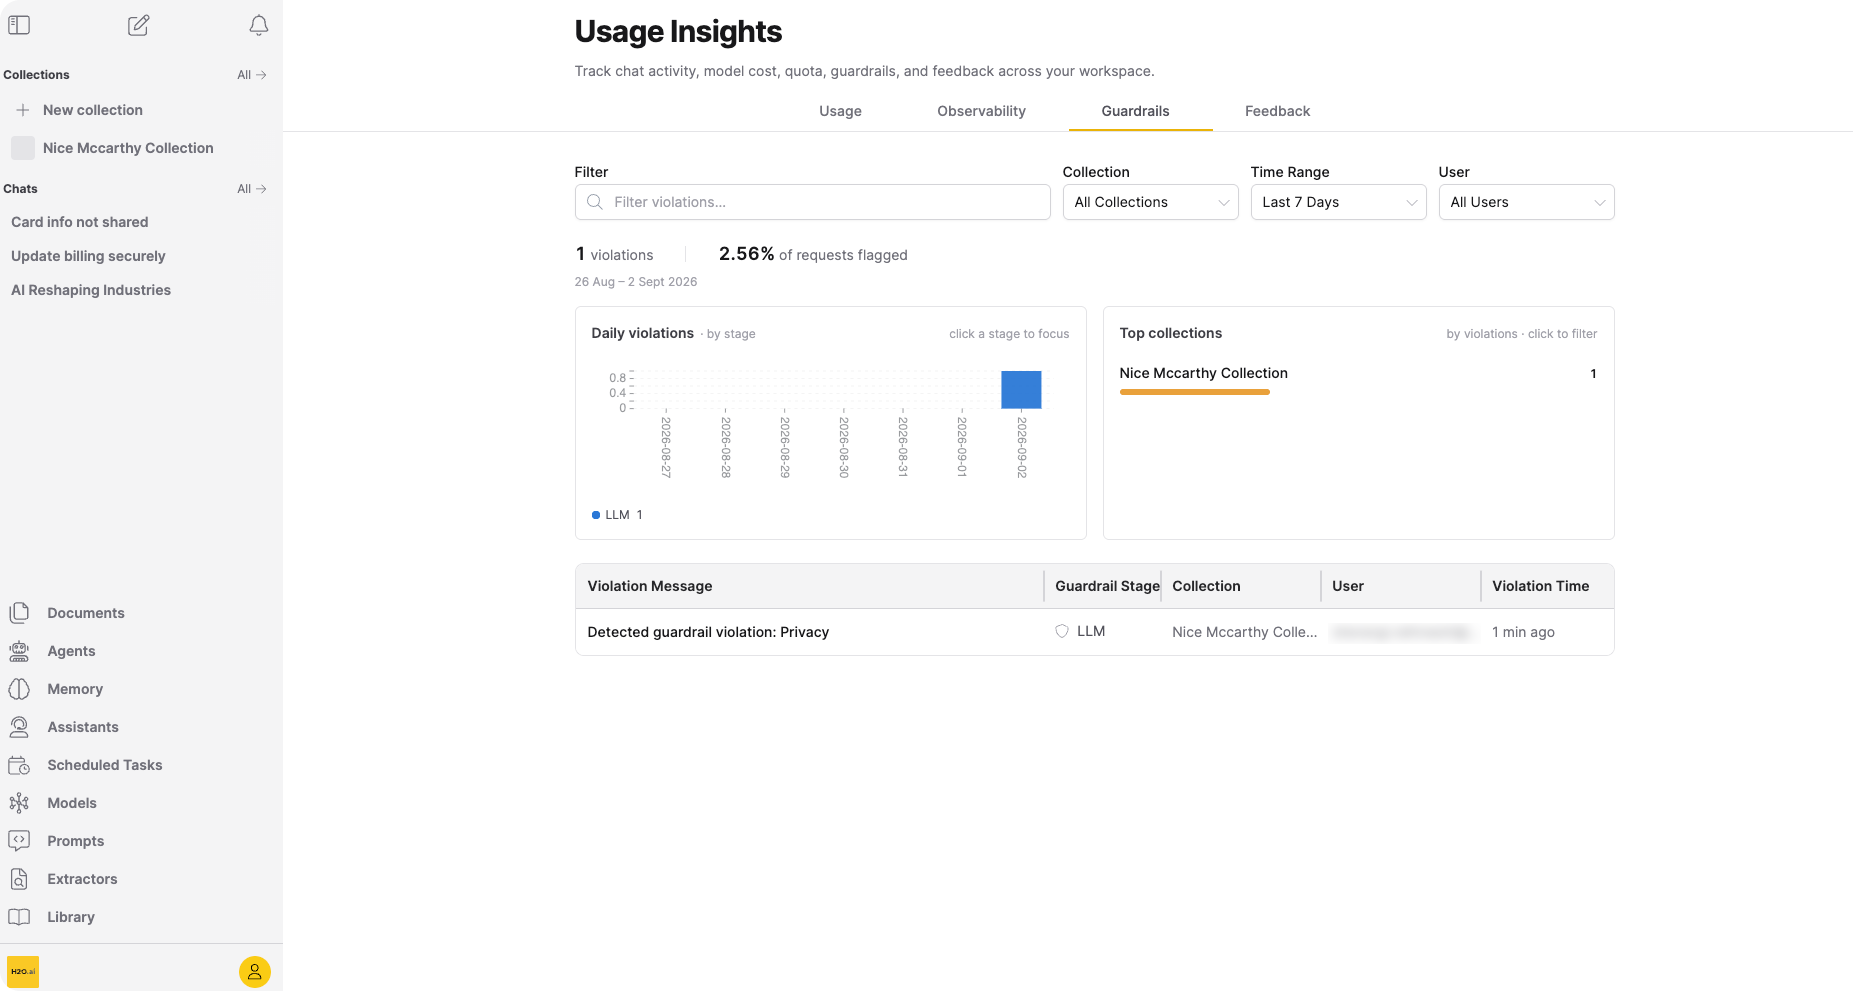
The Guardrails tab gives administrators visibility into guardrail violations across the platform.
This tab requires administrator access. To configure role permissions, see Roles and permissions.
Filters
- Filter: Text search across violations or usernames.
- Collection: Searchable single-select dropdown. Defaults to all collections.
- Time Range / User: See Page-level controls.
Summary strip
A single line preceding the charts reports total violations and the percentage of requests flagged, for the selected time range. A period with zero violations still shows the strip (as "0 violations") rather than disappearing. See Summary strip under Usage for how the period-over-period change is shown.
Below the metrics, a line shows the exact dates the selected range covers.
Charts
When violations exist in the selected period, two cards appear side by side:
- Daily violations · by stage: A bar chart stacked by guardrail stage: Regex, Presidio, ModernBERT, LLM, or LLM (Vision). Each stage keeps a fixed color. A legend below the chart shows each stage's count; click a stage (in the chart or the legend) to focus the chart and filter the table to that stage.
- Top collections: The top five collections by violation count, each with an inline bar. Click a collection to filter the page to it. The row for chats with no collection isn't clickable.
Violations table
A paginated table lists individual violations with the following columns:
- Violation Message: A truncated description of the violation.
- Guardrail Stage: The guardrail stage that flagged the violation: Regex, Presidio, ModernBERT, LLM, or LLM (Vision).
- Collection: The collection linked to the chat, or "No associated collection".
- User: The username. Hover for the email address.
- Violation Time: Relative time. Hover for the absolute timestamp.
When there are no violations yet, the table displays "No violations found in the selected time period." When a filter or search narrows the results to nothing, the table displays "No matching violations."
To configure guardrails, see Global Guardrails.
Feedback
The Feedback tab displays thumbs-up and thumbs-down votes that users have left on chat responses.
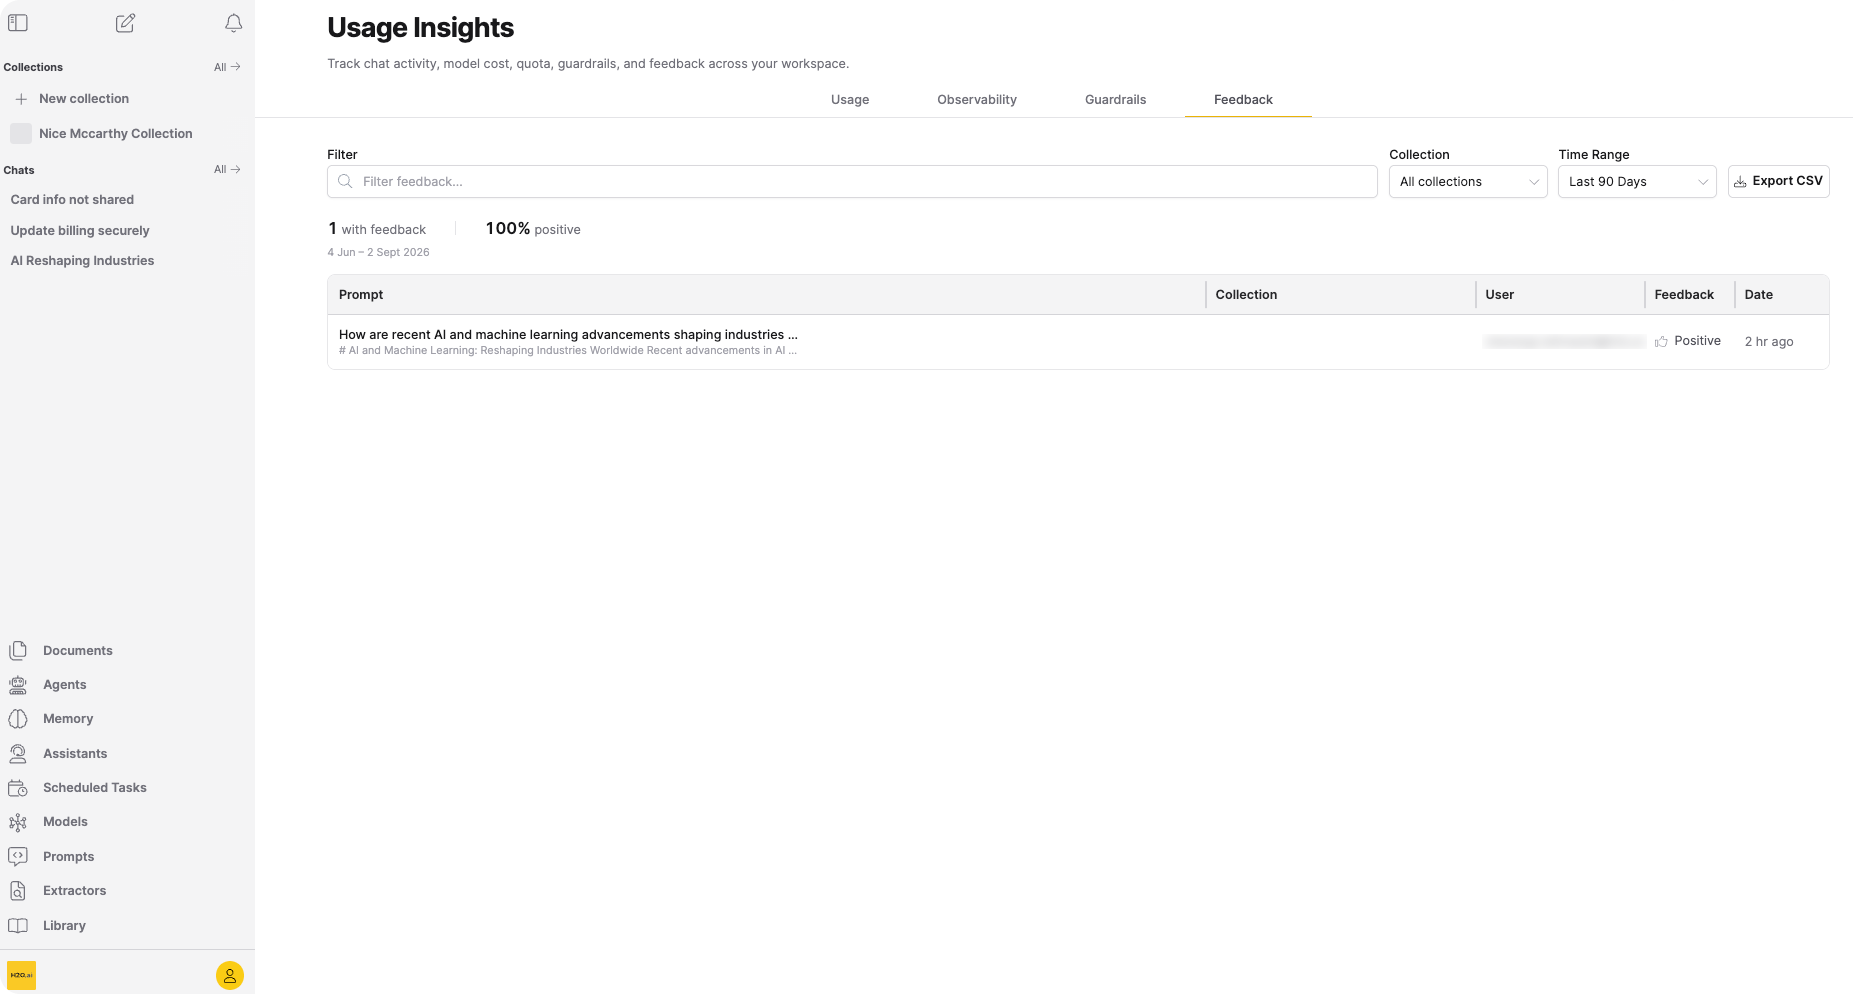
This tab shows feedback across all collections on the platform. To learn how to leave feedback on a response, see Feedback.
Filters
- Filter: Text search across feedback.
- Collection: Searchable dropdown. Options include all collections (default), no collection, and all available collections.
- Time Range: Last 24 Hours, Last 7 Days, Last 30 Days, Last 90 Days (default), All time. This tab has its own Time Range control (see Page-level controls).
Summary strip
A single line preceding the table reports the total number of messages with feedback and the percentage that were positive, for the selected time range. See Summary strip under Usage for how the period-over-period change is shown.
Below the metrics, a line shows the exact dates the selected range covers.
Export feedback
Click Export CSV in the filter bar to export all feedback matching the current filters.
The export runs as a background job. A notification appears: "Feedback export started. Check the notification tray for progress." The notification tray opens automatically, and the CSV file downloads when the job completes.
The exported file is named feedback_export_YYYY-MM-DD.csv and contains the following columns:
| Column | Description |
|---|---|
| Date | Timestamp of the response. |
| Collection | Collection the chat belonged to, if any. |
| Chat ID | Unique identifier of the chat session. |
| Message ID | Unique identifier of the rated message. |
| Prompt | The question that was asked. |
| Response | The model's reply. |
| Feedback | Vote value: 1 for thumbs up, -1 for thumbs down. |
| Expected Answer | The ideal response entered by the user, if provided. |
| Comment | The user's comment, if provided. |
| Voted By | Username of the person who left the vote. |
Feedback table
The table lists each feedback entry with the following columns:
- Prompt: Clickable. Shows the question and a one-line reply preview. Opens the feedback detail pane.
- Collection: Clickable link to the collection page.
- User: The user who left the feedback.
- Feedback: "Positive" or "Negative," with a thumbs icon.
- Date: Relative time. Hover for the absolute timestamp.
When there's no feedback yet, the table displays "You have no messages with feedback." with the hint "Chat messages with thumbs up or thumbs down feedback will appear here." When a filter or search narrows the results to nothing, the table displays "No matching feedback messages."
Feedback detail pane
Click any row in the Prompt column to open a detail pane on the right side of the page.
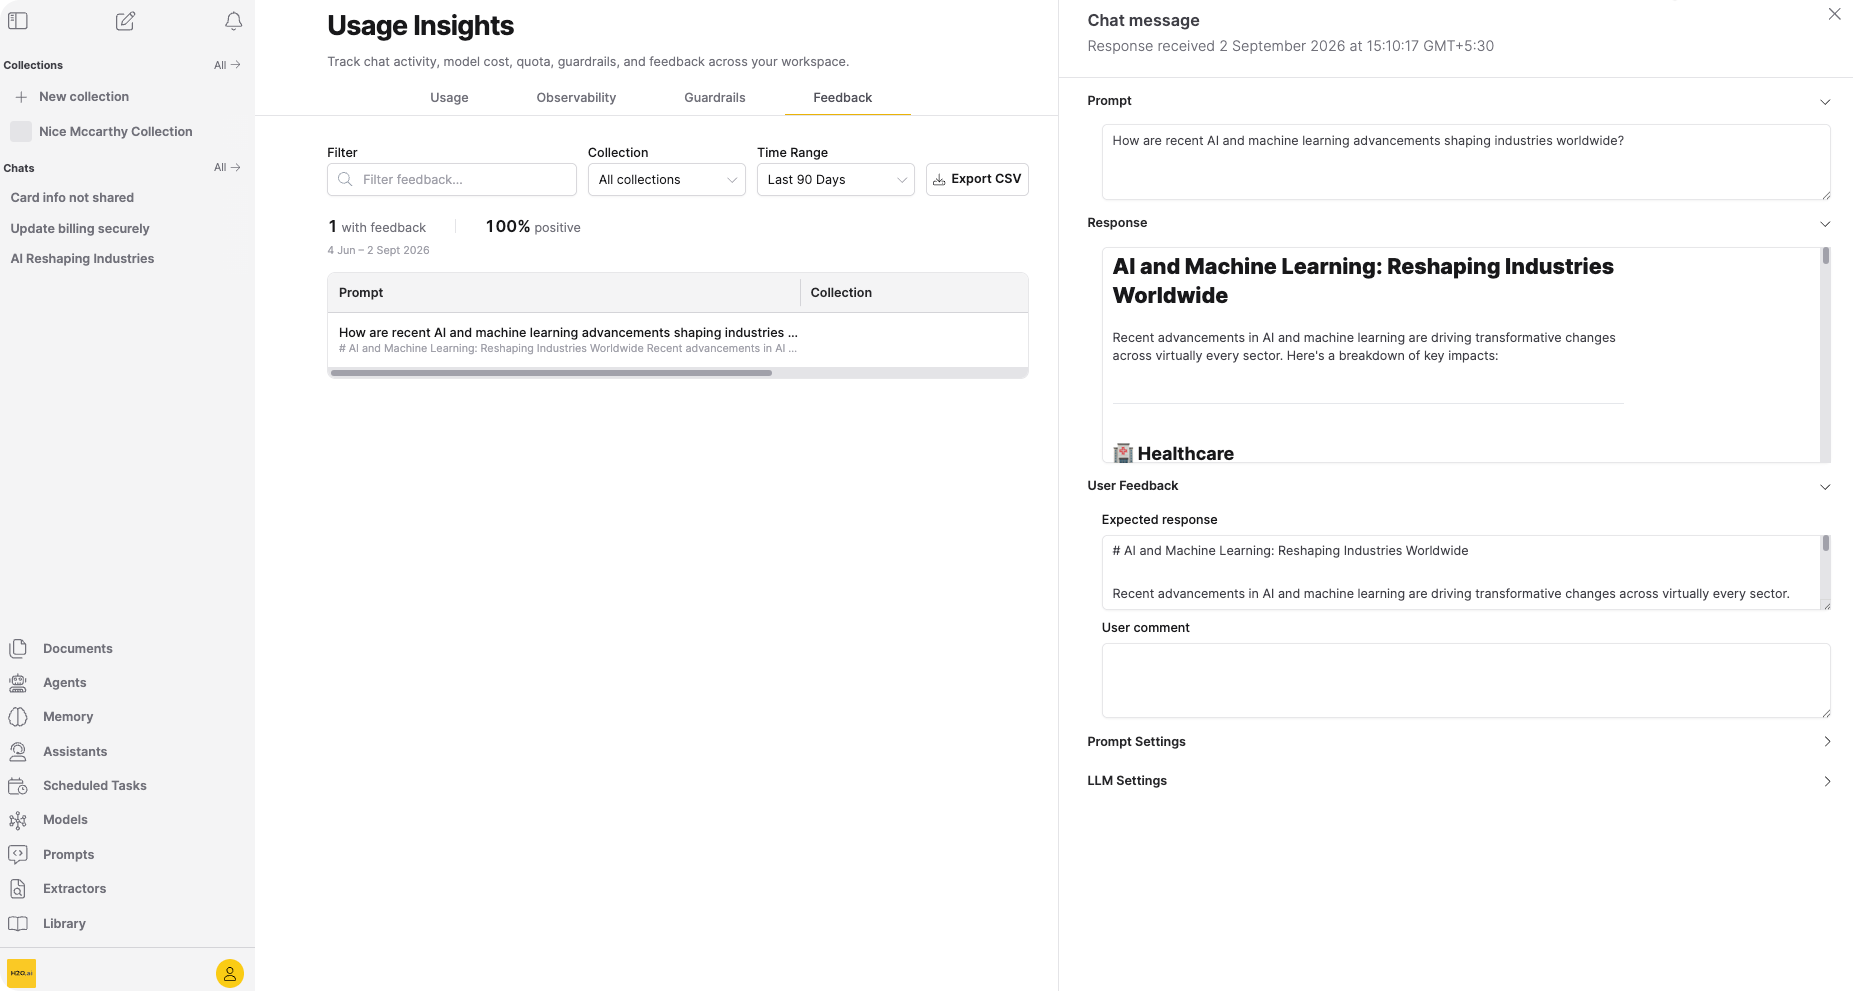
The pane contains the following collapsible sections:
- Prompt: The full question text.
- Response: The model's reply rendered as text.
- User Feedback: Contains Expected response and User comment text areas.
- Prompt Settings (collapsed by default): Contains Personality (System Prompt), RAG prompt before context, and RAG prompt after context.
- LLM Settings (collapsed by default): Contains the LLM model name and RAG Config (JSON).
Related topics
- Chats: Start and manage chat sessions.
- Agents: Build and run AI agents.
- Feedback: Leave thumbs-up or thumbs-down votes on chat responses.
- Roles and permissions: Configure access to Usage Insights.
- Submit and view feedback for this page
- Send feedback about Enterprise h2oGPTe to cloud-feedback@h2o.ai