AI Unit Hourly
This section provides detailed information on the daily cumulative hourly peak usage of AI units that are used in your H2O AI Managed Cloud (HAMC) environment.
To access this page, select AI unit hourly in the left navigation bar.
The page header displays the following information:
- Environment start date: The start date of the HAMC environment where the app is installed.
- Environment expiration date: The expiration date of the HAMC environment where the app is installed.
- Purchased AI units: The total number of AI units purchased.
AI unit data is updated twice daily.
The AI unit hourly page contains two tabs:
Cumulative summary
The Cumulative summary tab displays the daily cumulative hourly usage of AI units.
The Cumulative summary tab contains two integrated plots that provide complementary views of AI unit usage:
- Plot 1: Shows usage over the entire contract period
- Plot 2: Shows monthly usage breakdowns
To switch between views, use the dropdown menu in the top-right corner of each plot.

Plot 1: Contract period
This chart displays the cumulative hourly peak usage of AI units over the entire contract period, from the environment start date to the expiration date.
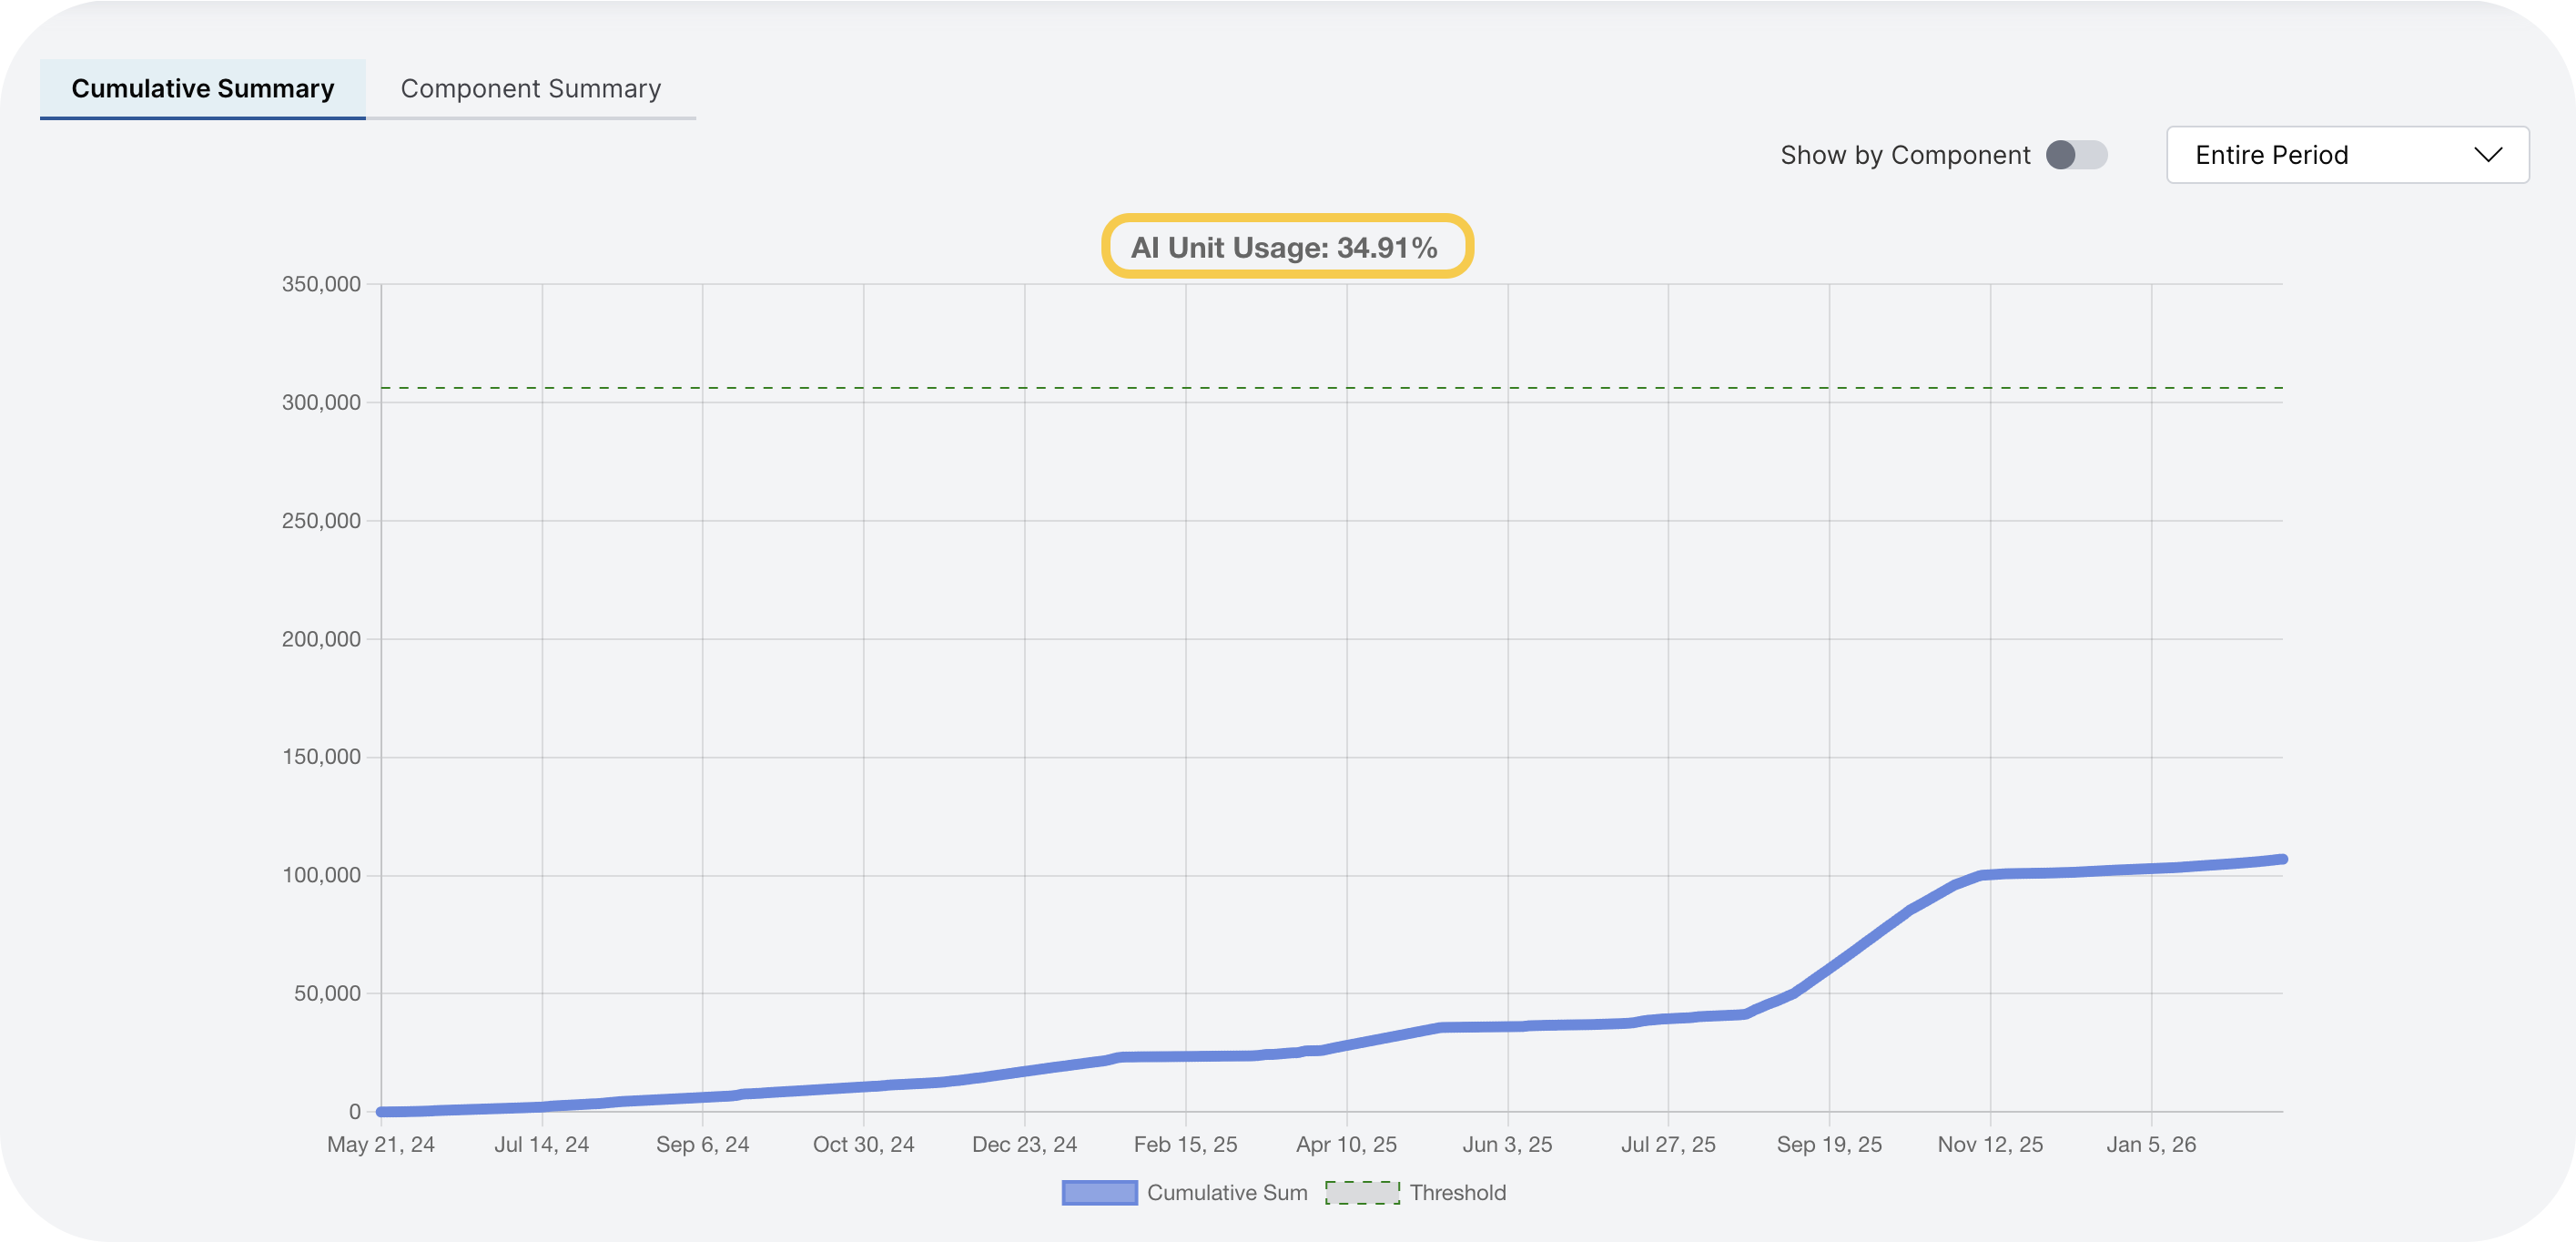
The chart displays:
- AI unit usage: The actual maximum hourly consumption of AI units, shown as a percentage of the threshold value.
- Threshold value: The green line that represents the maximum number of cumulative AI units allowed for the entire contract period.
- Cumulative sum value: The line that shows the total cumulative value of AI units consumed over time.
Component breakdown
This chart breaks down the cumulative hourly peak usage of AI units by component. You can view data for the entire contract period or select a specific month from the dropdown menu.
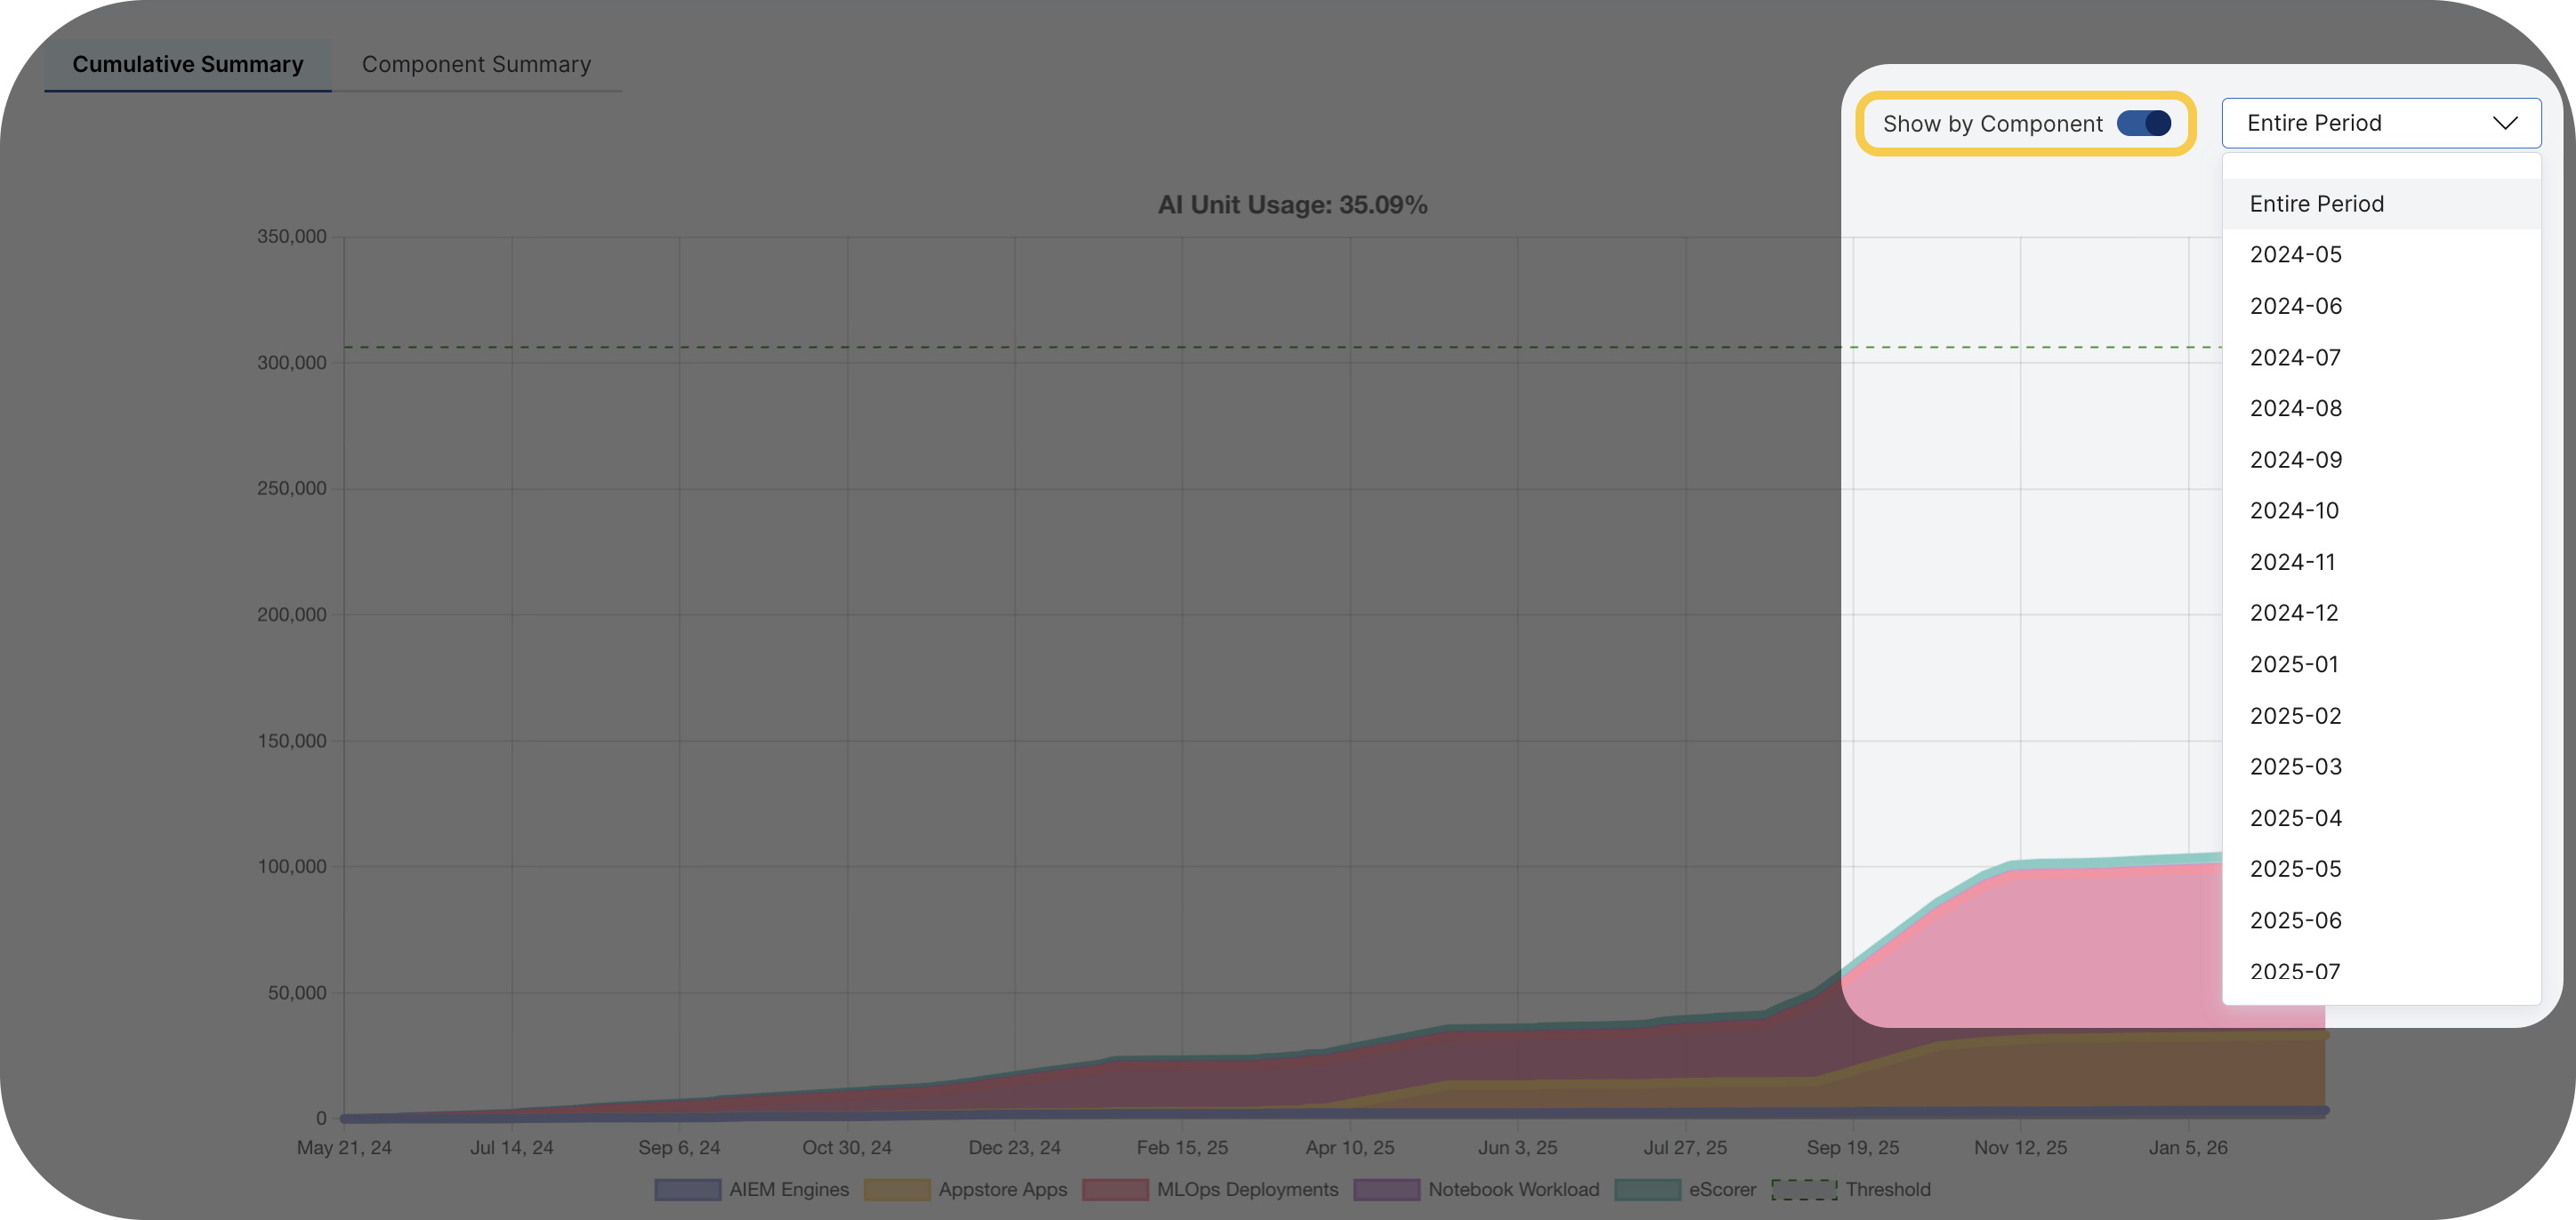
To hide specific components from the chart, select the component names in the legend below the chart:

Plot 2: Monthly view
This chart displays the cumulative hourly peak usage of AI units for a selected month. Use the dropdown menu to select a specific month.
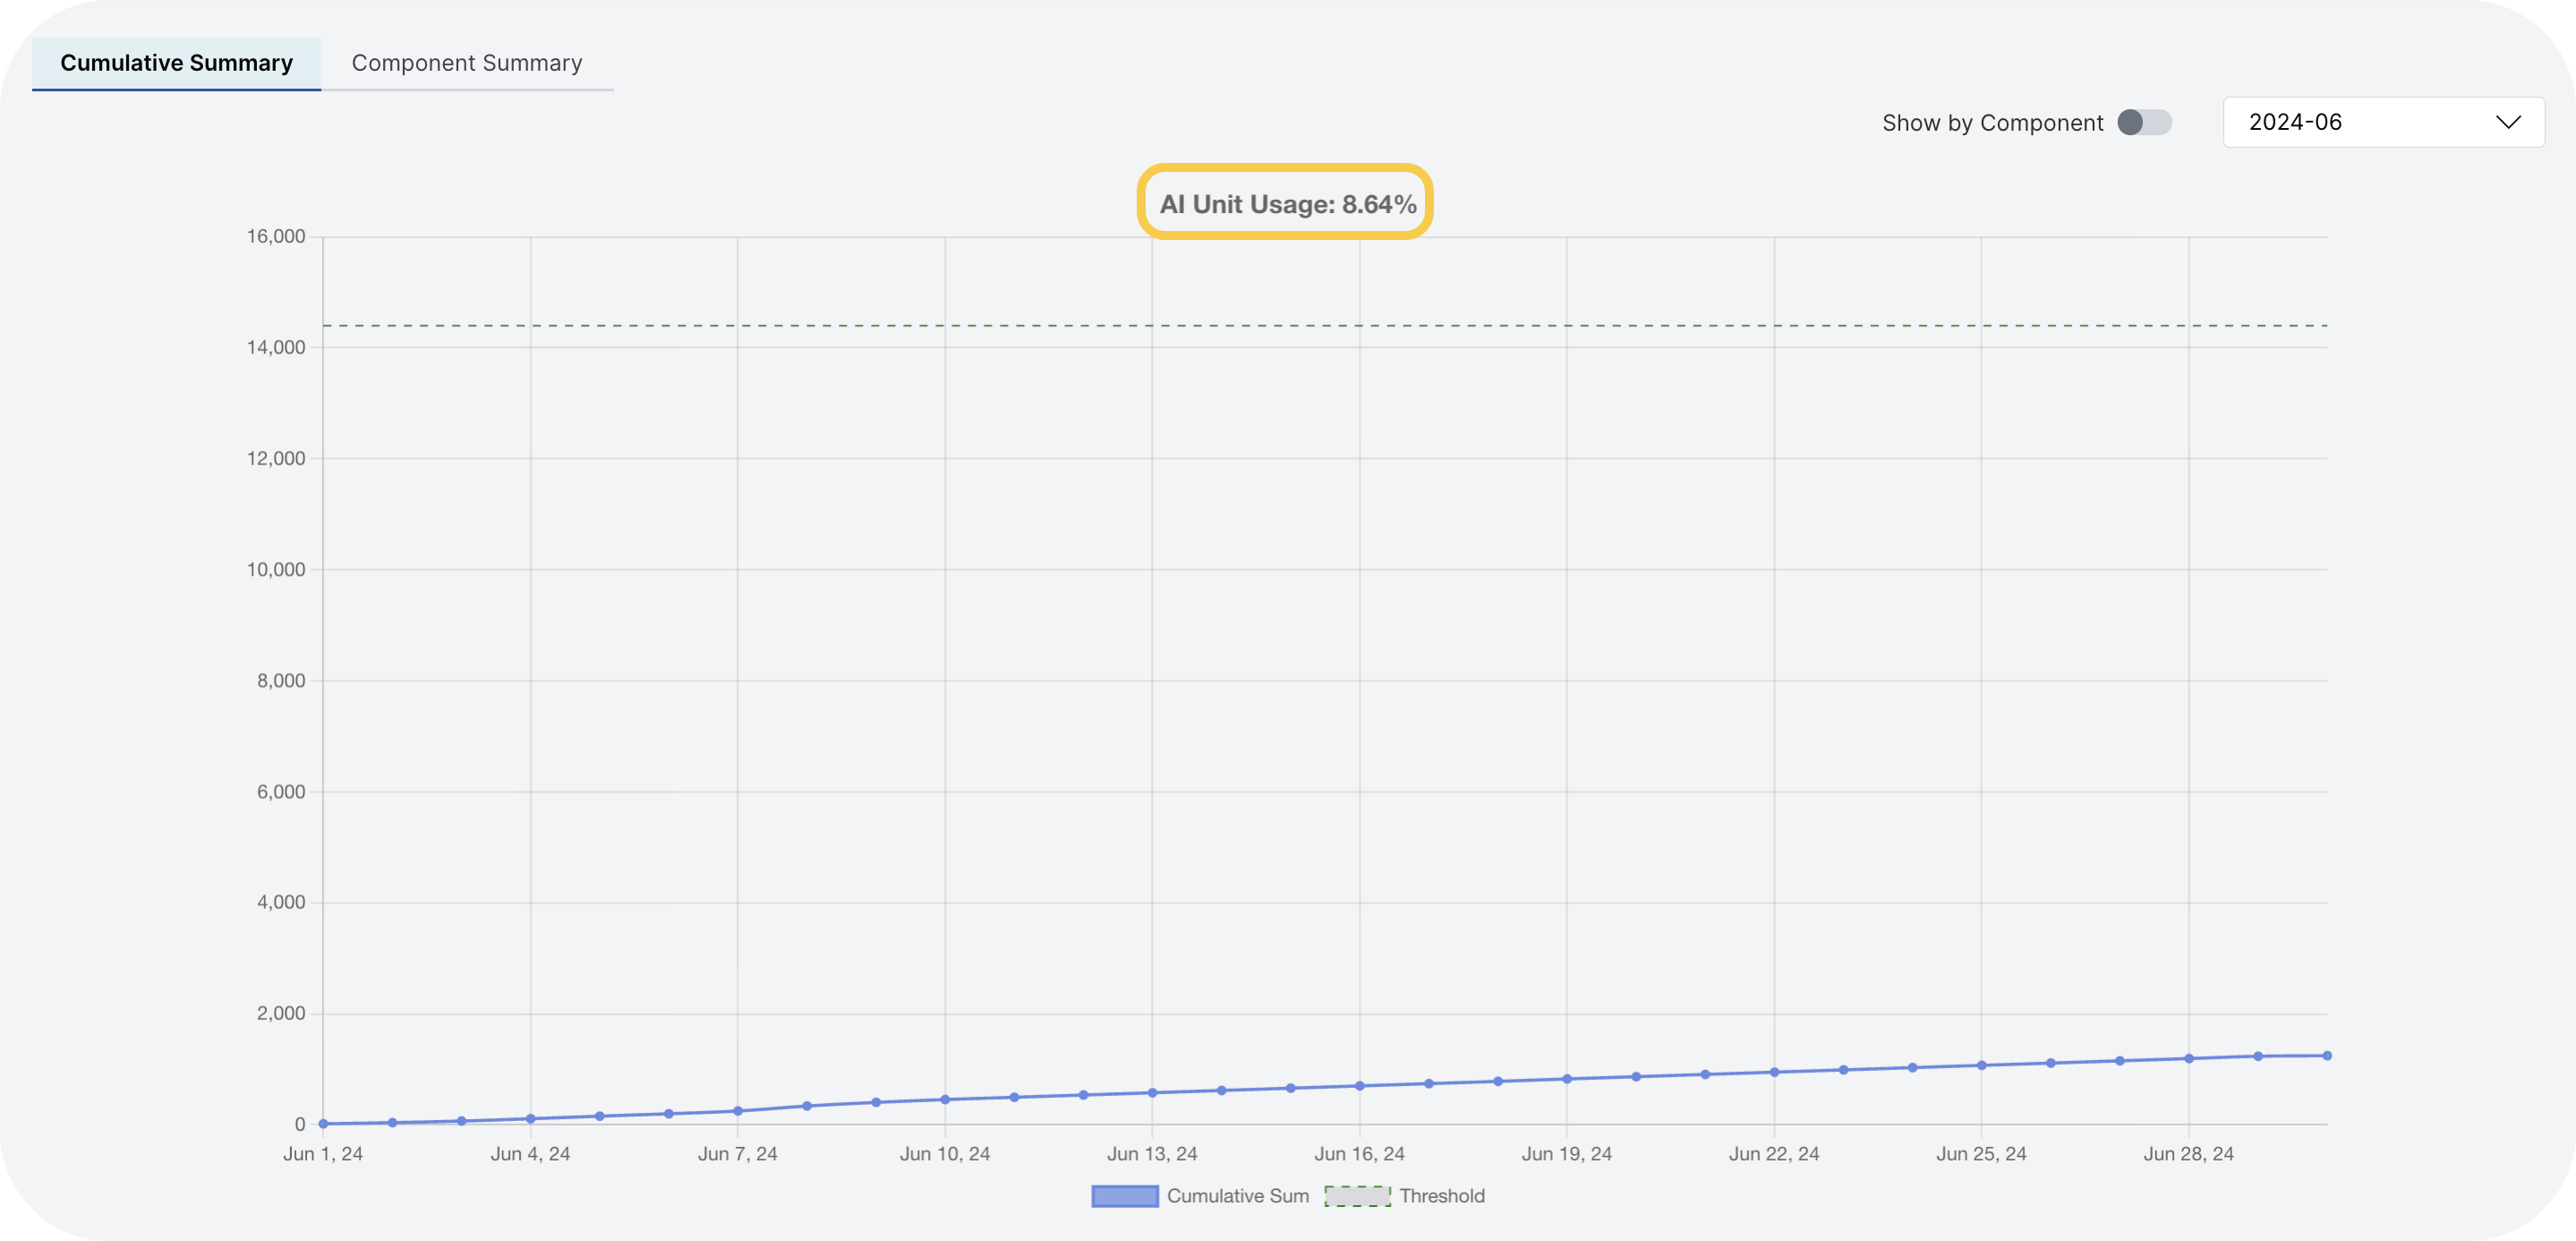
The chart displays:
- AI unit usage: The actual maximum hourly consumption of AI units as a percentage of the monthly threshold value.
- Threshold value: The green line that represents the maximum number of cumulative AI units allowed for the selected month.
- Cumulative sum value: The red line that shows the total cumulative value of AI units consumed over time.
Component breakdown
This chart breaks down the cumulative hourly peak usage of AI units by component for the selected month.
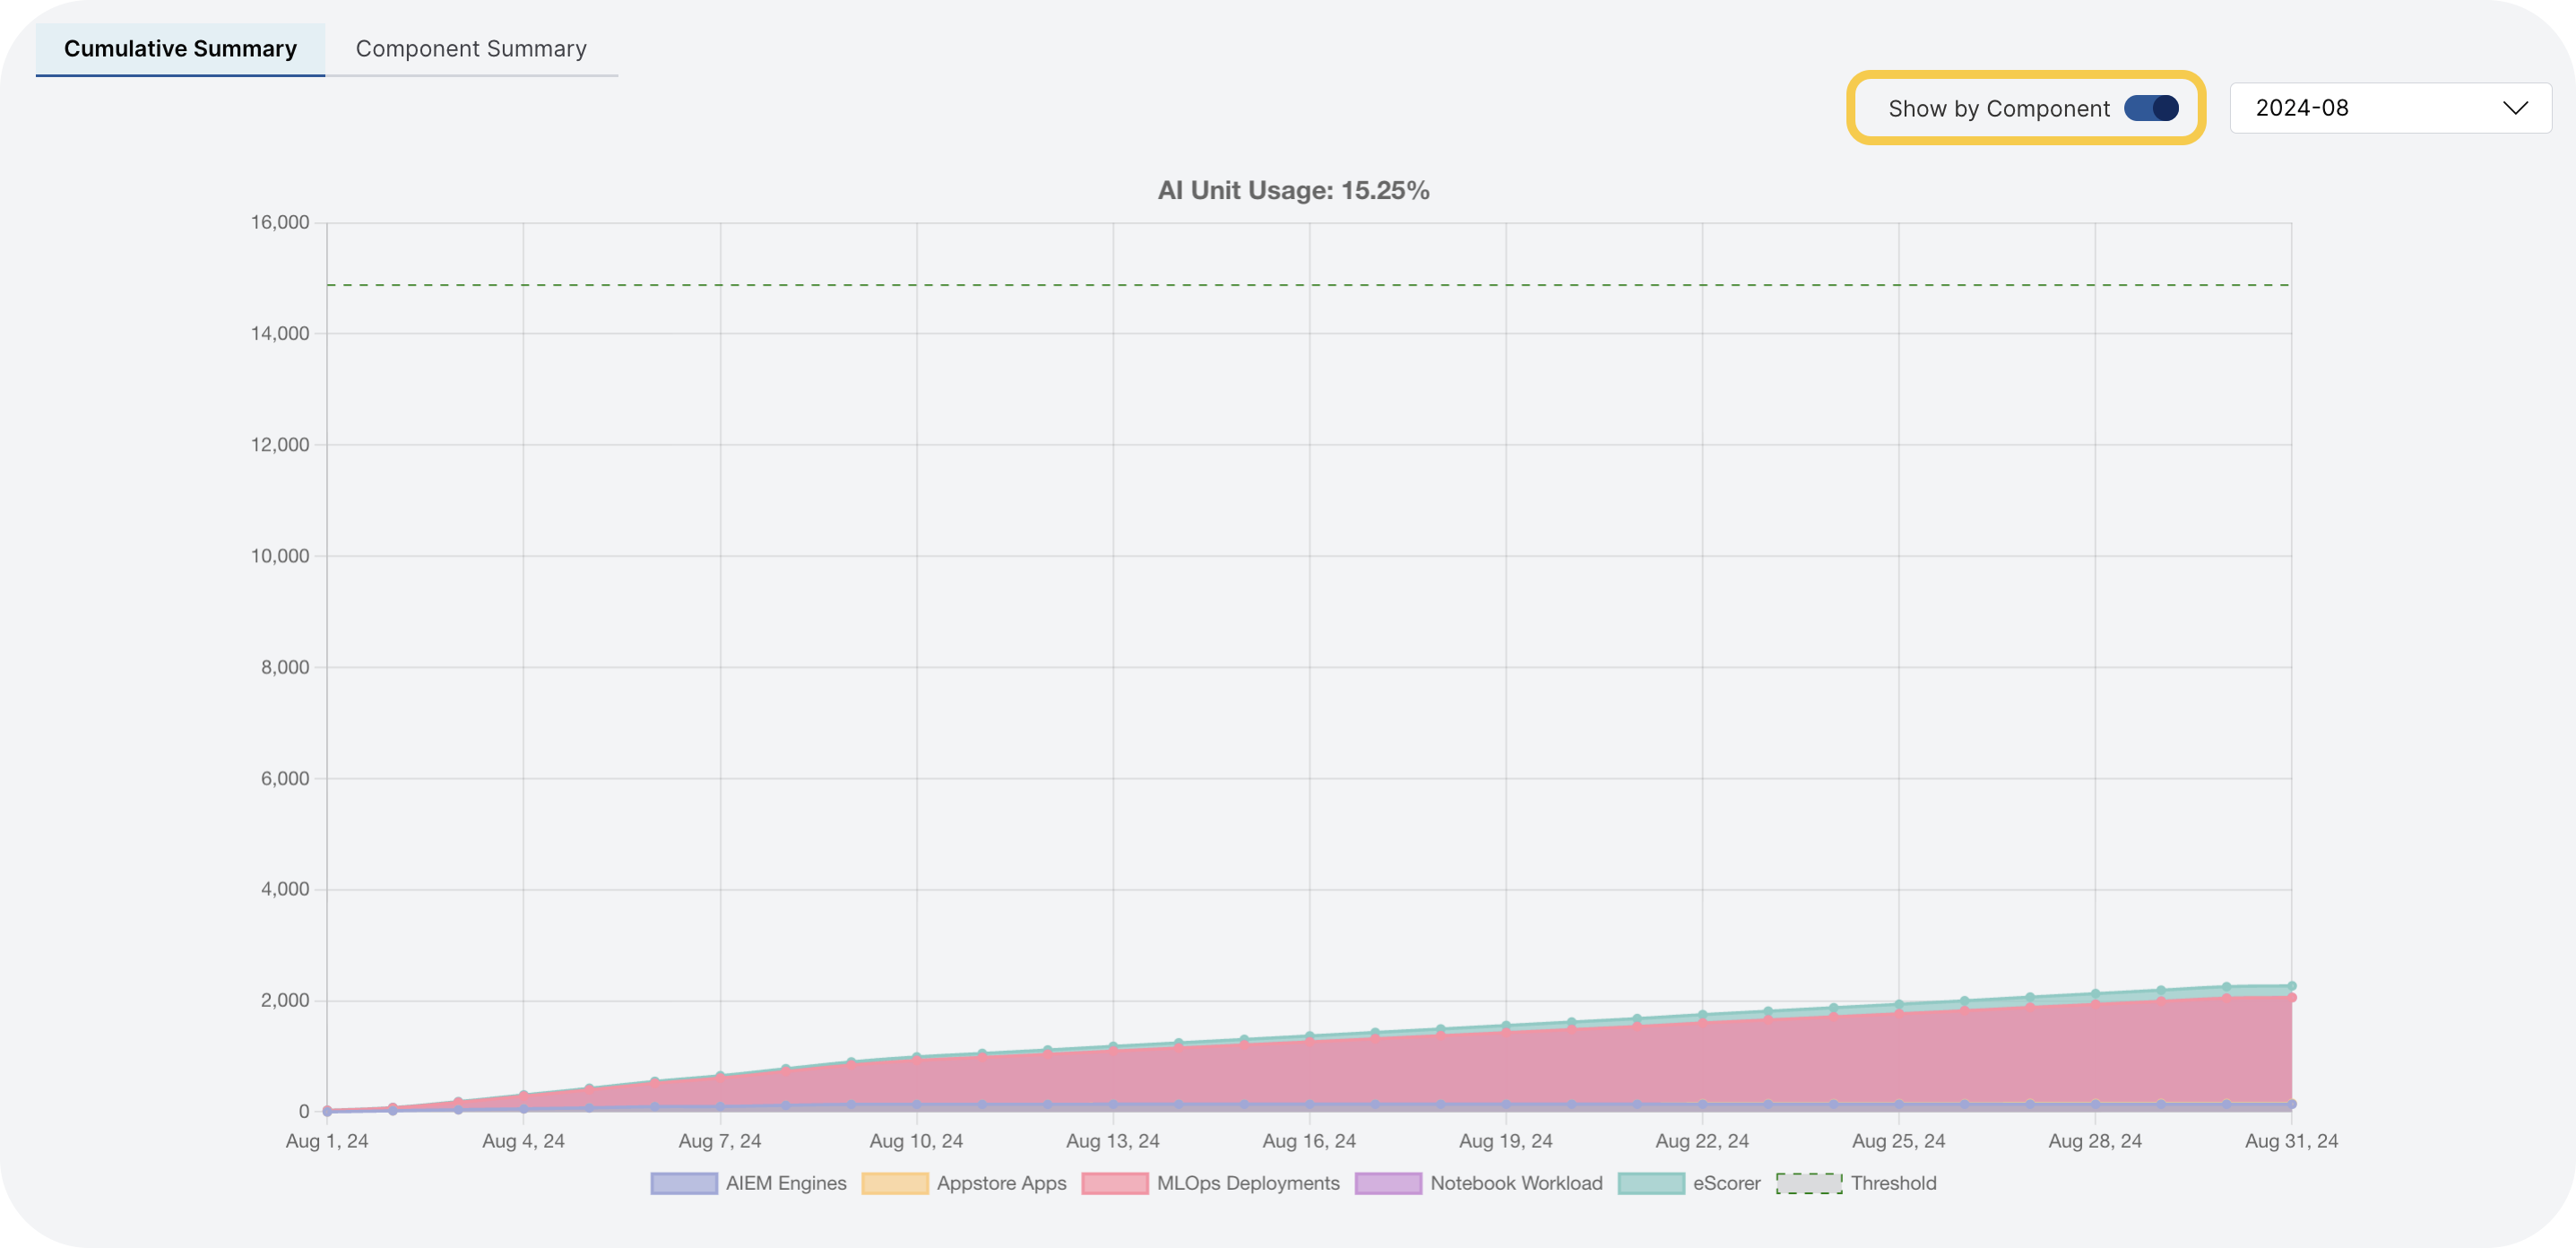
To hide specific components from the chart, select the component names in the legend below the chart:
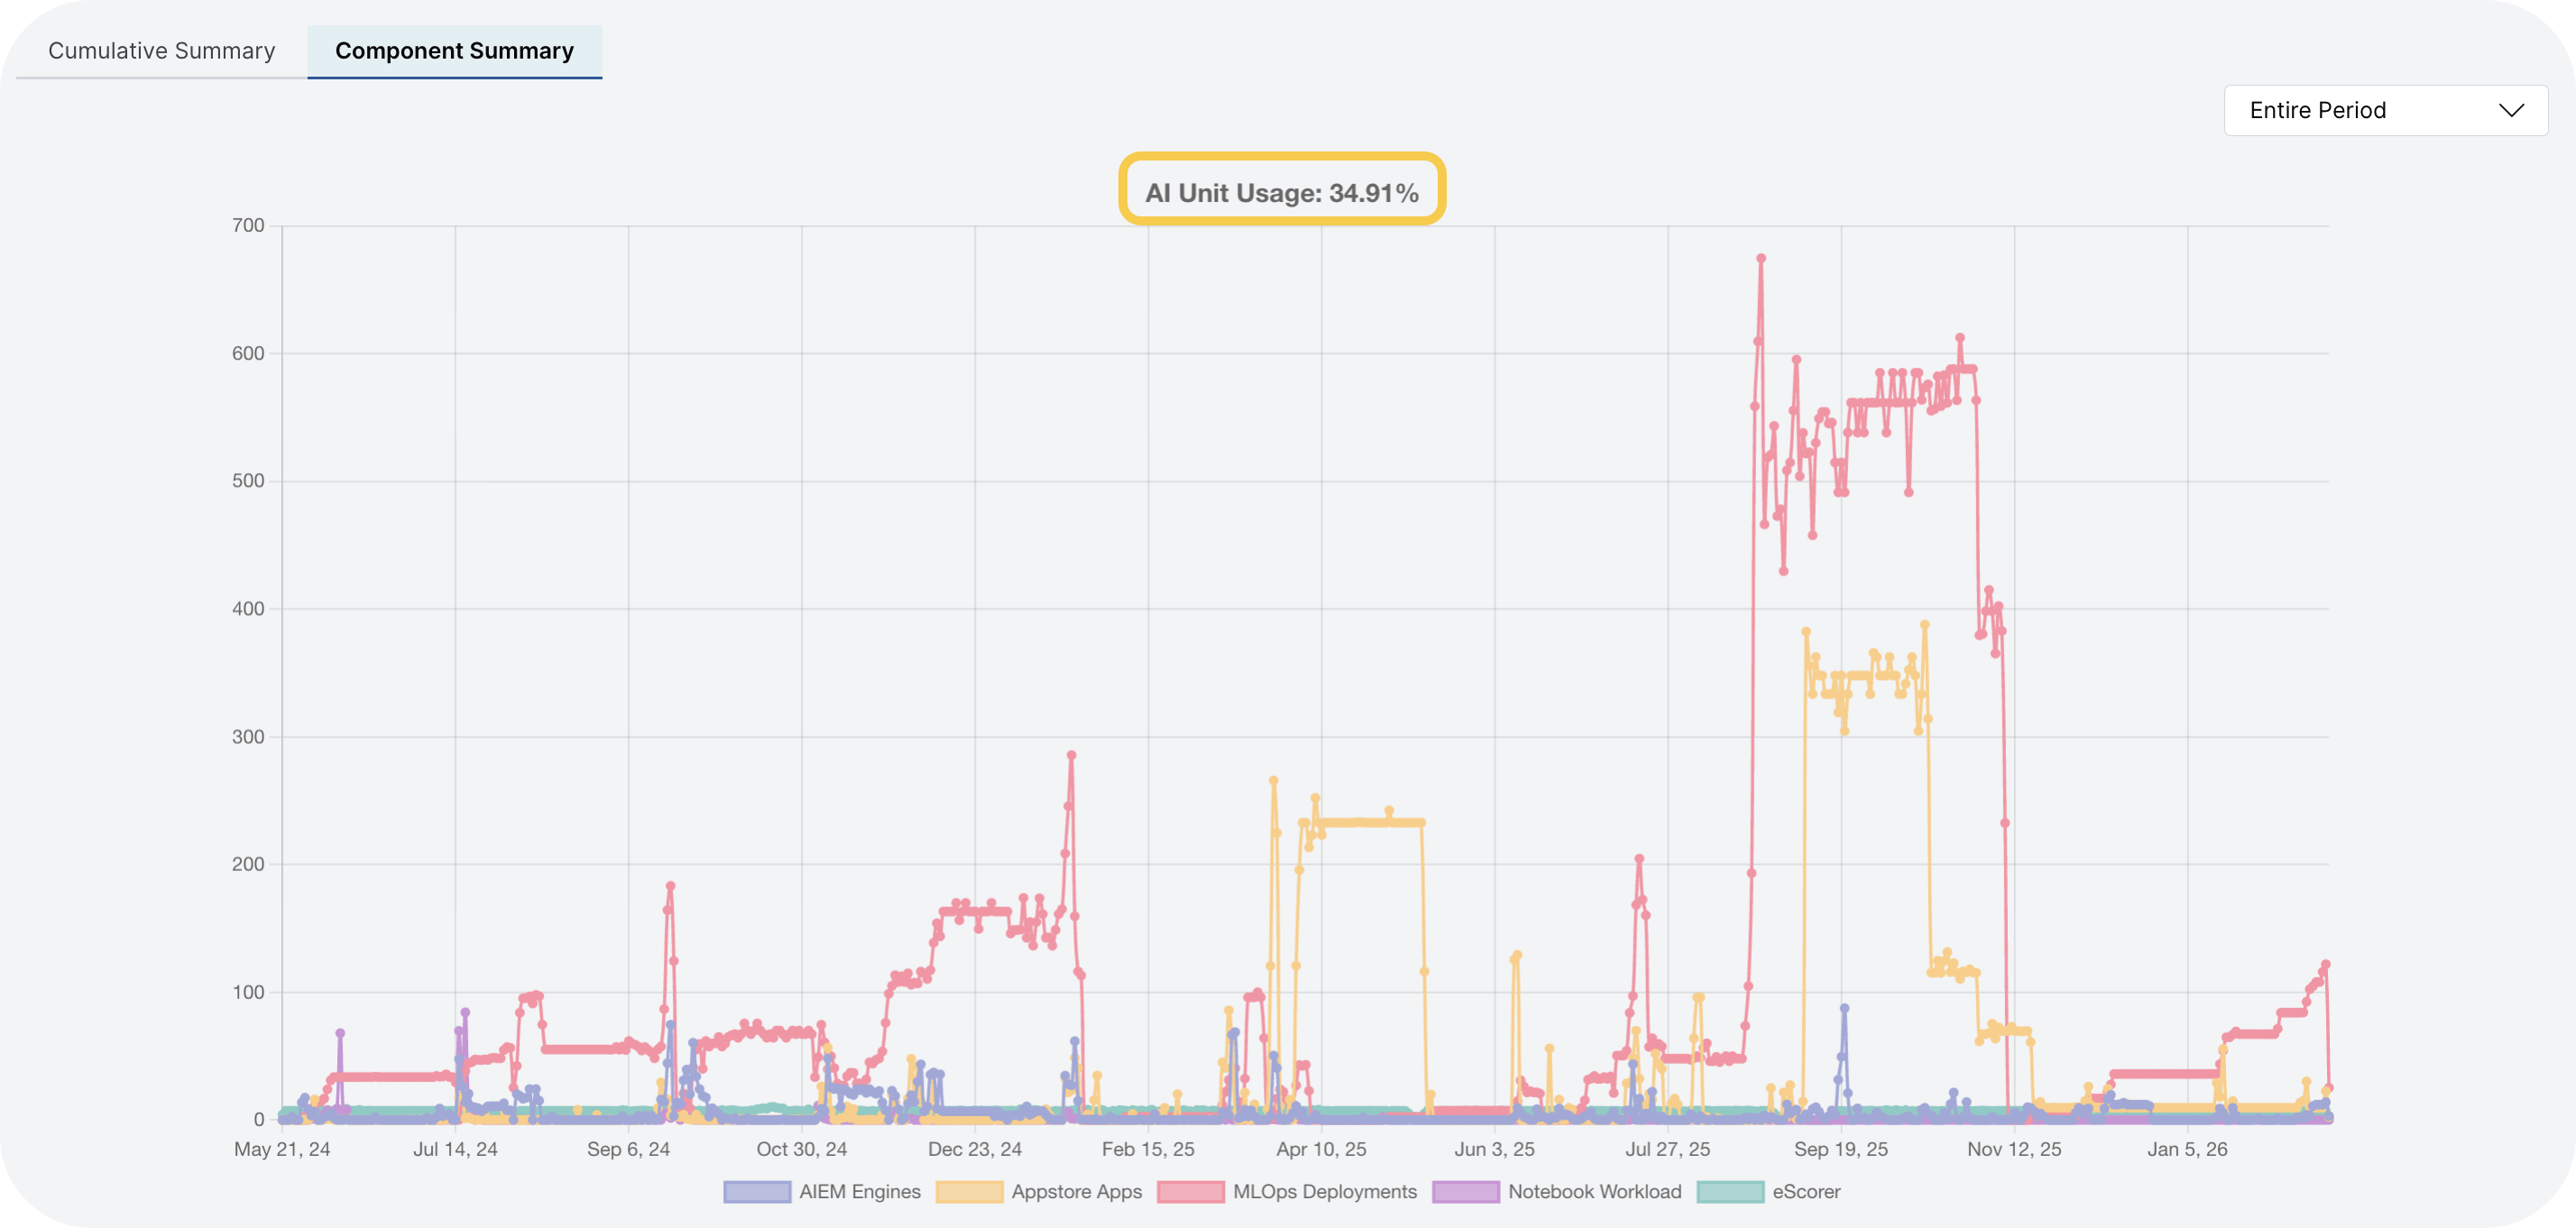
Component summary
The Component summary tab displays the daily cumulative hourly peak usage of AI units for each application or product component installed in the environment.
This section contains two integrated plots that provide complementary views of AI unit usage by component:
- Plot 1: Shows usage over the entire contract period
- Plot 2: Shows monthly usage breakdowns
To switch between views, use the dropdown menu in the top-right corner of each plot.

Plot 1: Contract period
This chart displays the daily cumulative hourly peak usage of AI units for each component over the entire contract period.
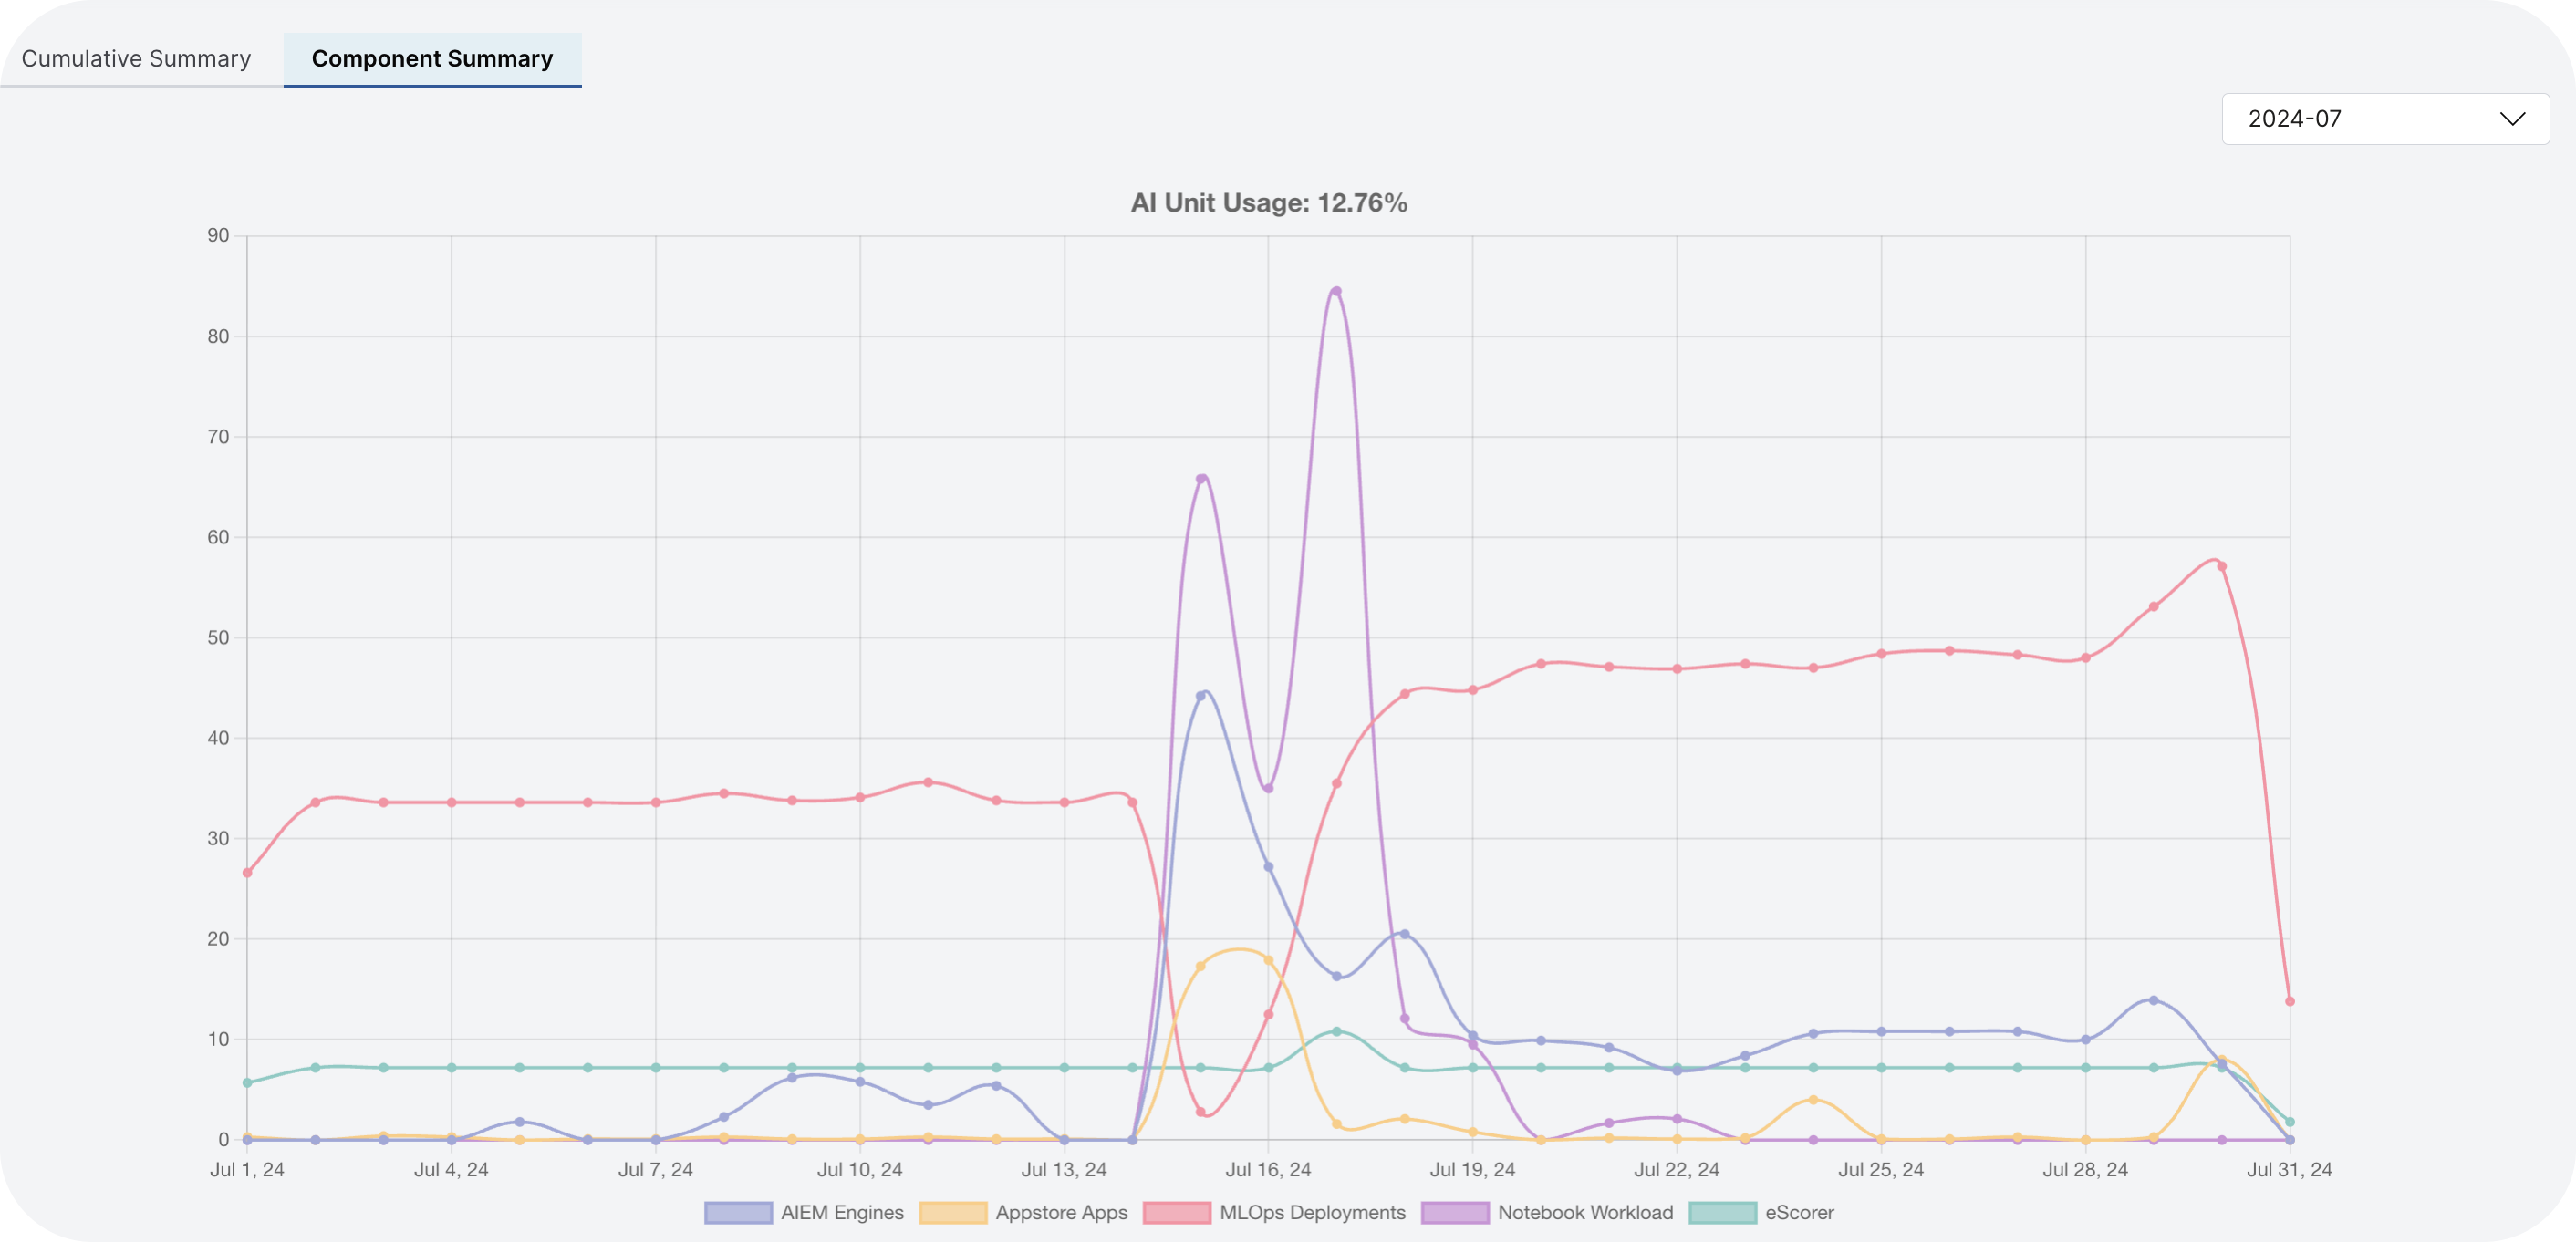
Plot 2: Monthly view
This chart displays the daily cumulative hourly peak usage of AI units for each component in a selected month. Use the dropdown menu to select a specific month.
- Submit and view feedback for this page
- Send feedback about H2O Admin Center to cloud-feedback@h2o.ai