MLOps
This guide explains how to view H2O MLOps gauge metrics over a selected time frame and how to toggle individual resource types in the chart.
note
MLOps data is updated every 10 minutes.
Click MLOps (under Analytics) on the left-navigation bar to open the MLOps page.
Gauge metric view
The chart plots the cumulative count of each gauge metric type over the selected time frame.
To filter the data:
- From the Select Time Frame dropdown, select a preset range (for example, Last Week, Month to Date, Last Quarter, Year to Date) or select Custom to set specific dates.
- If you selected Custom, pick a Start date and an End date.
note
Date filters are applied in your local timezone.
The chart displays the following:
- Gauge type: The type of H2O MLOps gauge metric. Each type is plotted in a different color.
- Total count: The cumulative total count for each gauge type on each date.
- Date: The date corresponding to each data point.
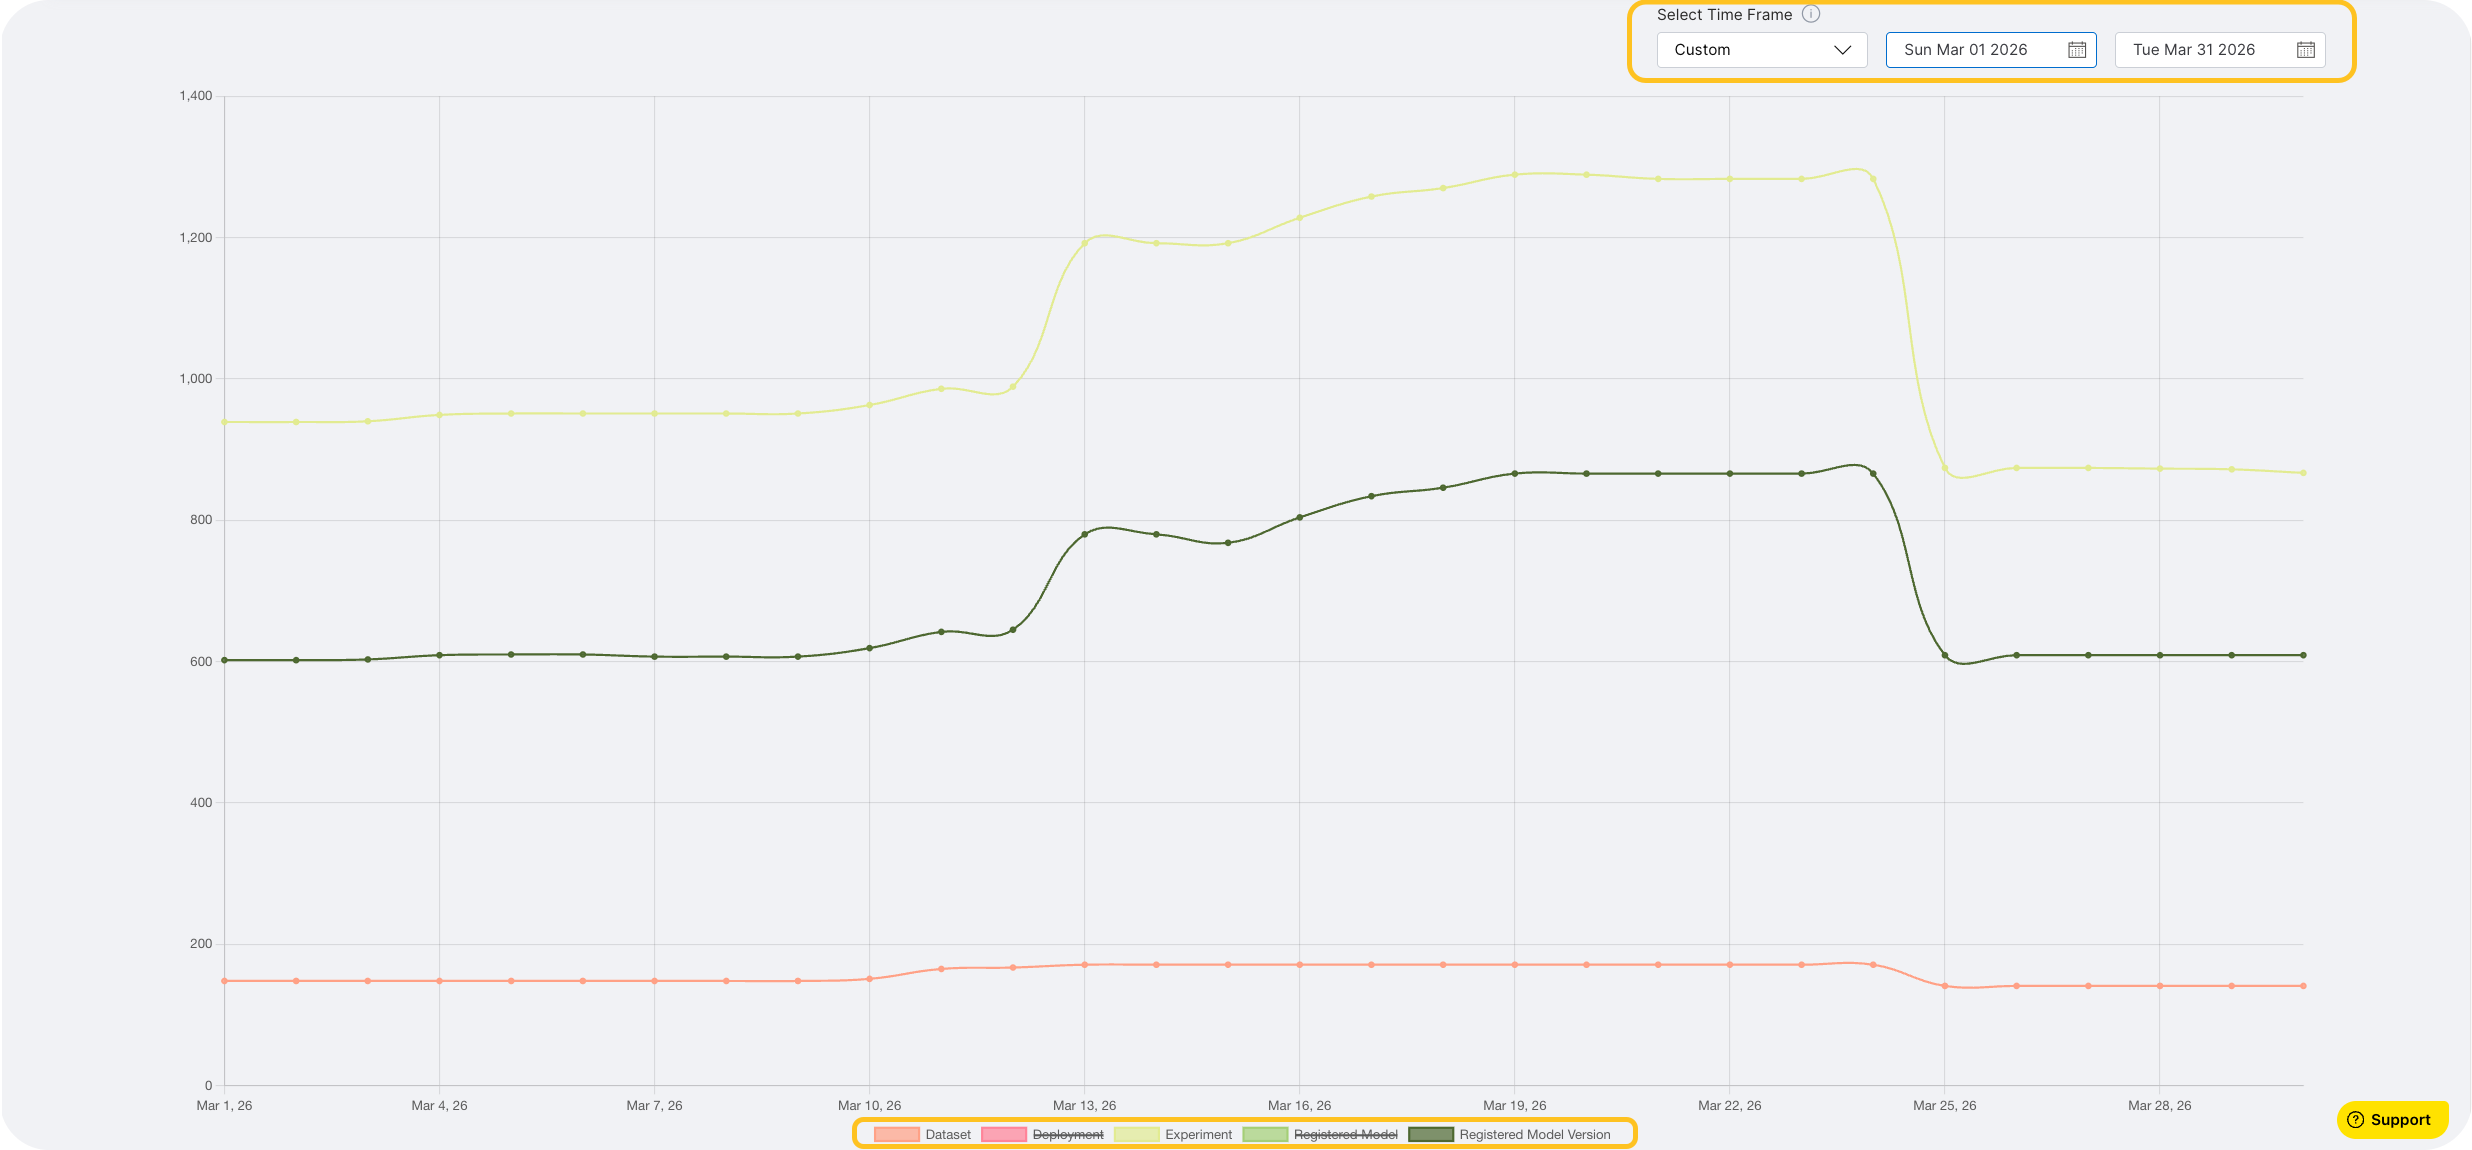
note
Click a gauge type in the legend at the bottom of the chart to hide it. Click it again to bring it back. Use this to focus on the resource types that matter for your view.
Feedback
- Submit and view feedback for this page
- Send feedback about H2O Admin Center to cloud-feedback@h2o.ai