User Journey
The User Journey page displays a selected user's activity across Driverless AI, H2O-3, Notebooks, MLOps, Appstore, and Logins within your H2O AI Managed Cloud (HAMC) environment. The activity data is visualized in a scatter plot and listed in an event table.
Click User Journey on the left-navigation bar to open the User Journey page.
- Telemetry data on this page is updated twice daily.
- The dates and times are displayed in the user's particular time zone.
Select a user and date range
Use the Select a User dropdown to select a user. The dropdown supports typing to search.
Select a date range by picking a start date and an end date to filter activity within a specific time frame. 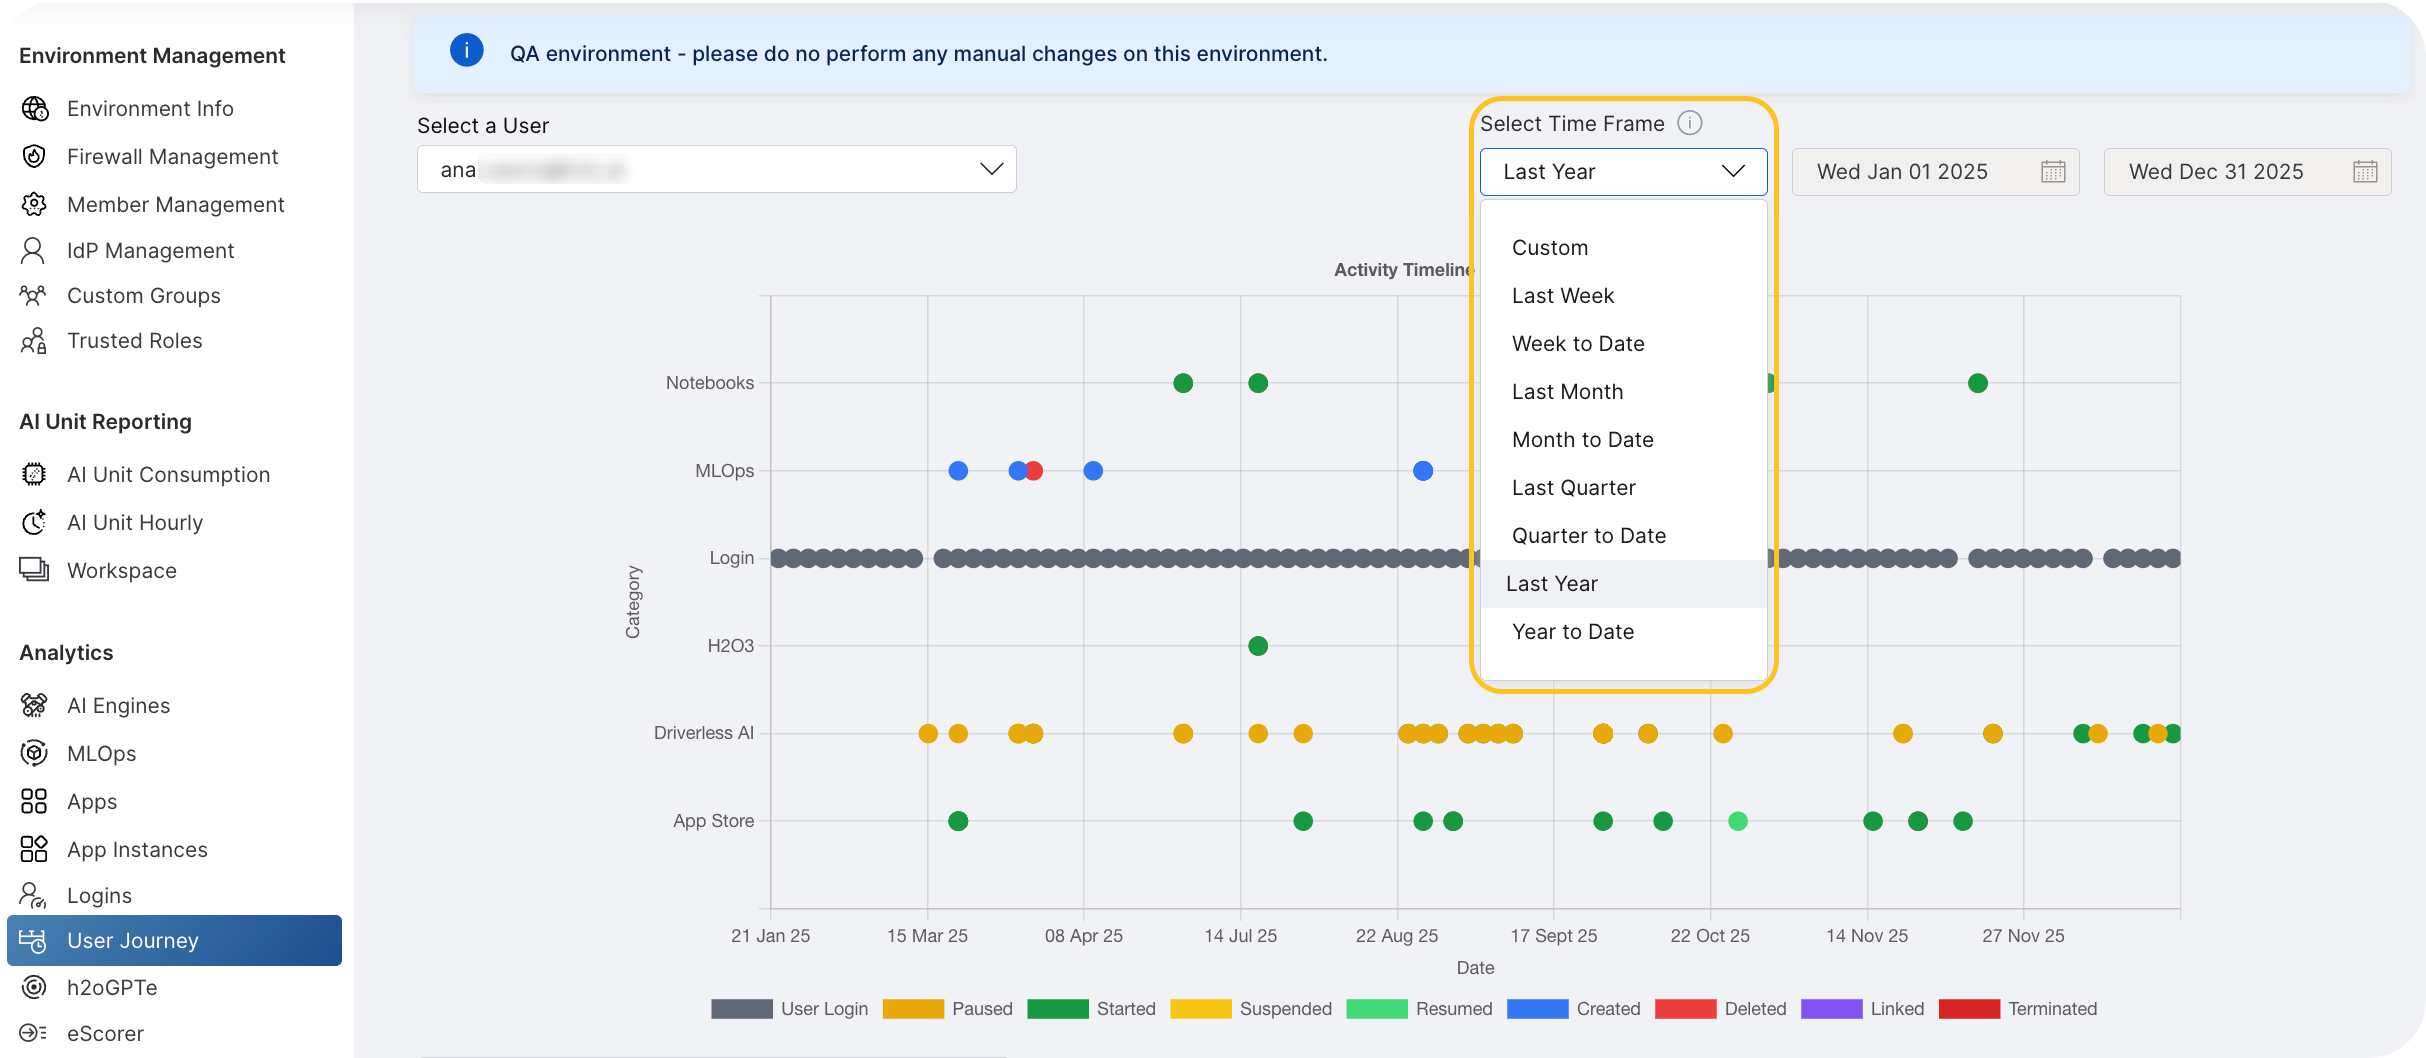
Scatter plot
The scatter plot visualizes the selected user's activity over the selected date range.
- X-axis: Date.
- Y-axis: Event category (Driverless AI, H2O-3, Notebooks, MLOps, Appstore, Logins).
Each data point represents an event at that date in that category. Hover over a data point to see additional details about the event, such as event time and resource name.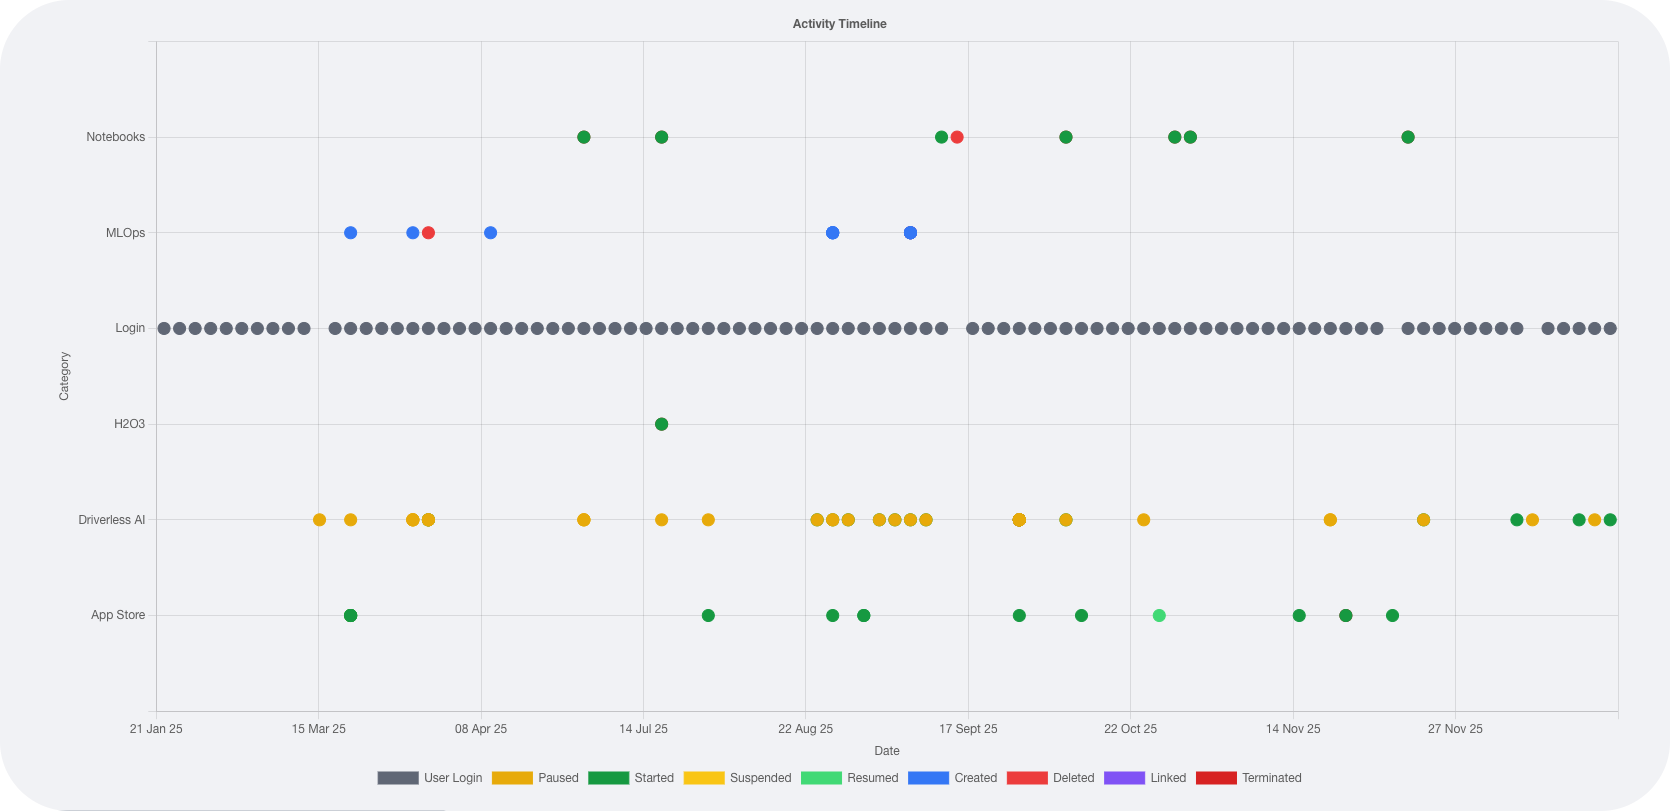
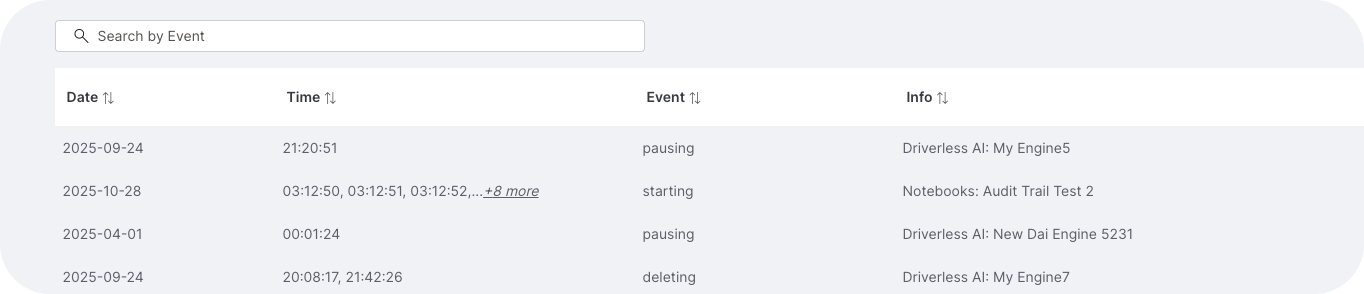
Event table
The table below the scatter plot lists the same activity data in tabular form. The following details appear based on the selected user and date range:
- Date: The date on which the event occurred.
- Time(s): The time(s) at which the event occurred. Multiple times are shown if the same event occurred more than once on that date.
- Event: The specific event action (for example,
started,deleted,paused). - Info: The relevant resource name (engine name, application name, or resource name depending on the category), or
-for login events.
- Submit and view feedback for this page
- Send feedback about H2O Admin Center to cloud-feedback@h2o.ai