Workspace insights
The Workspace insights page displays AI unit consumption organized by workspace and namespace levels in your H2O AI Managed Cloud (HAMC) environment. This hierarchical view helps you track and analyze resource usage across different organizational levels.
Click Workspace consumption under Analytics on the left-navigation bar to open the Workspace insights page.
Telemetry data on this page is updated twice daily.
Select workspaces
You can select one or multiple workspaces from the dropdown menu to view their AI unit consumption. This allows you to compare usage across different workspaces or focus on specific areas of interest.
To select workspaces:
- Click the workspace dropdown menu.
- Select one or more workspaces from the list.
- The page displays AI unit consumption data for your selected workspaces.
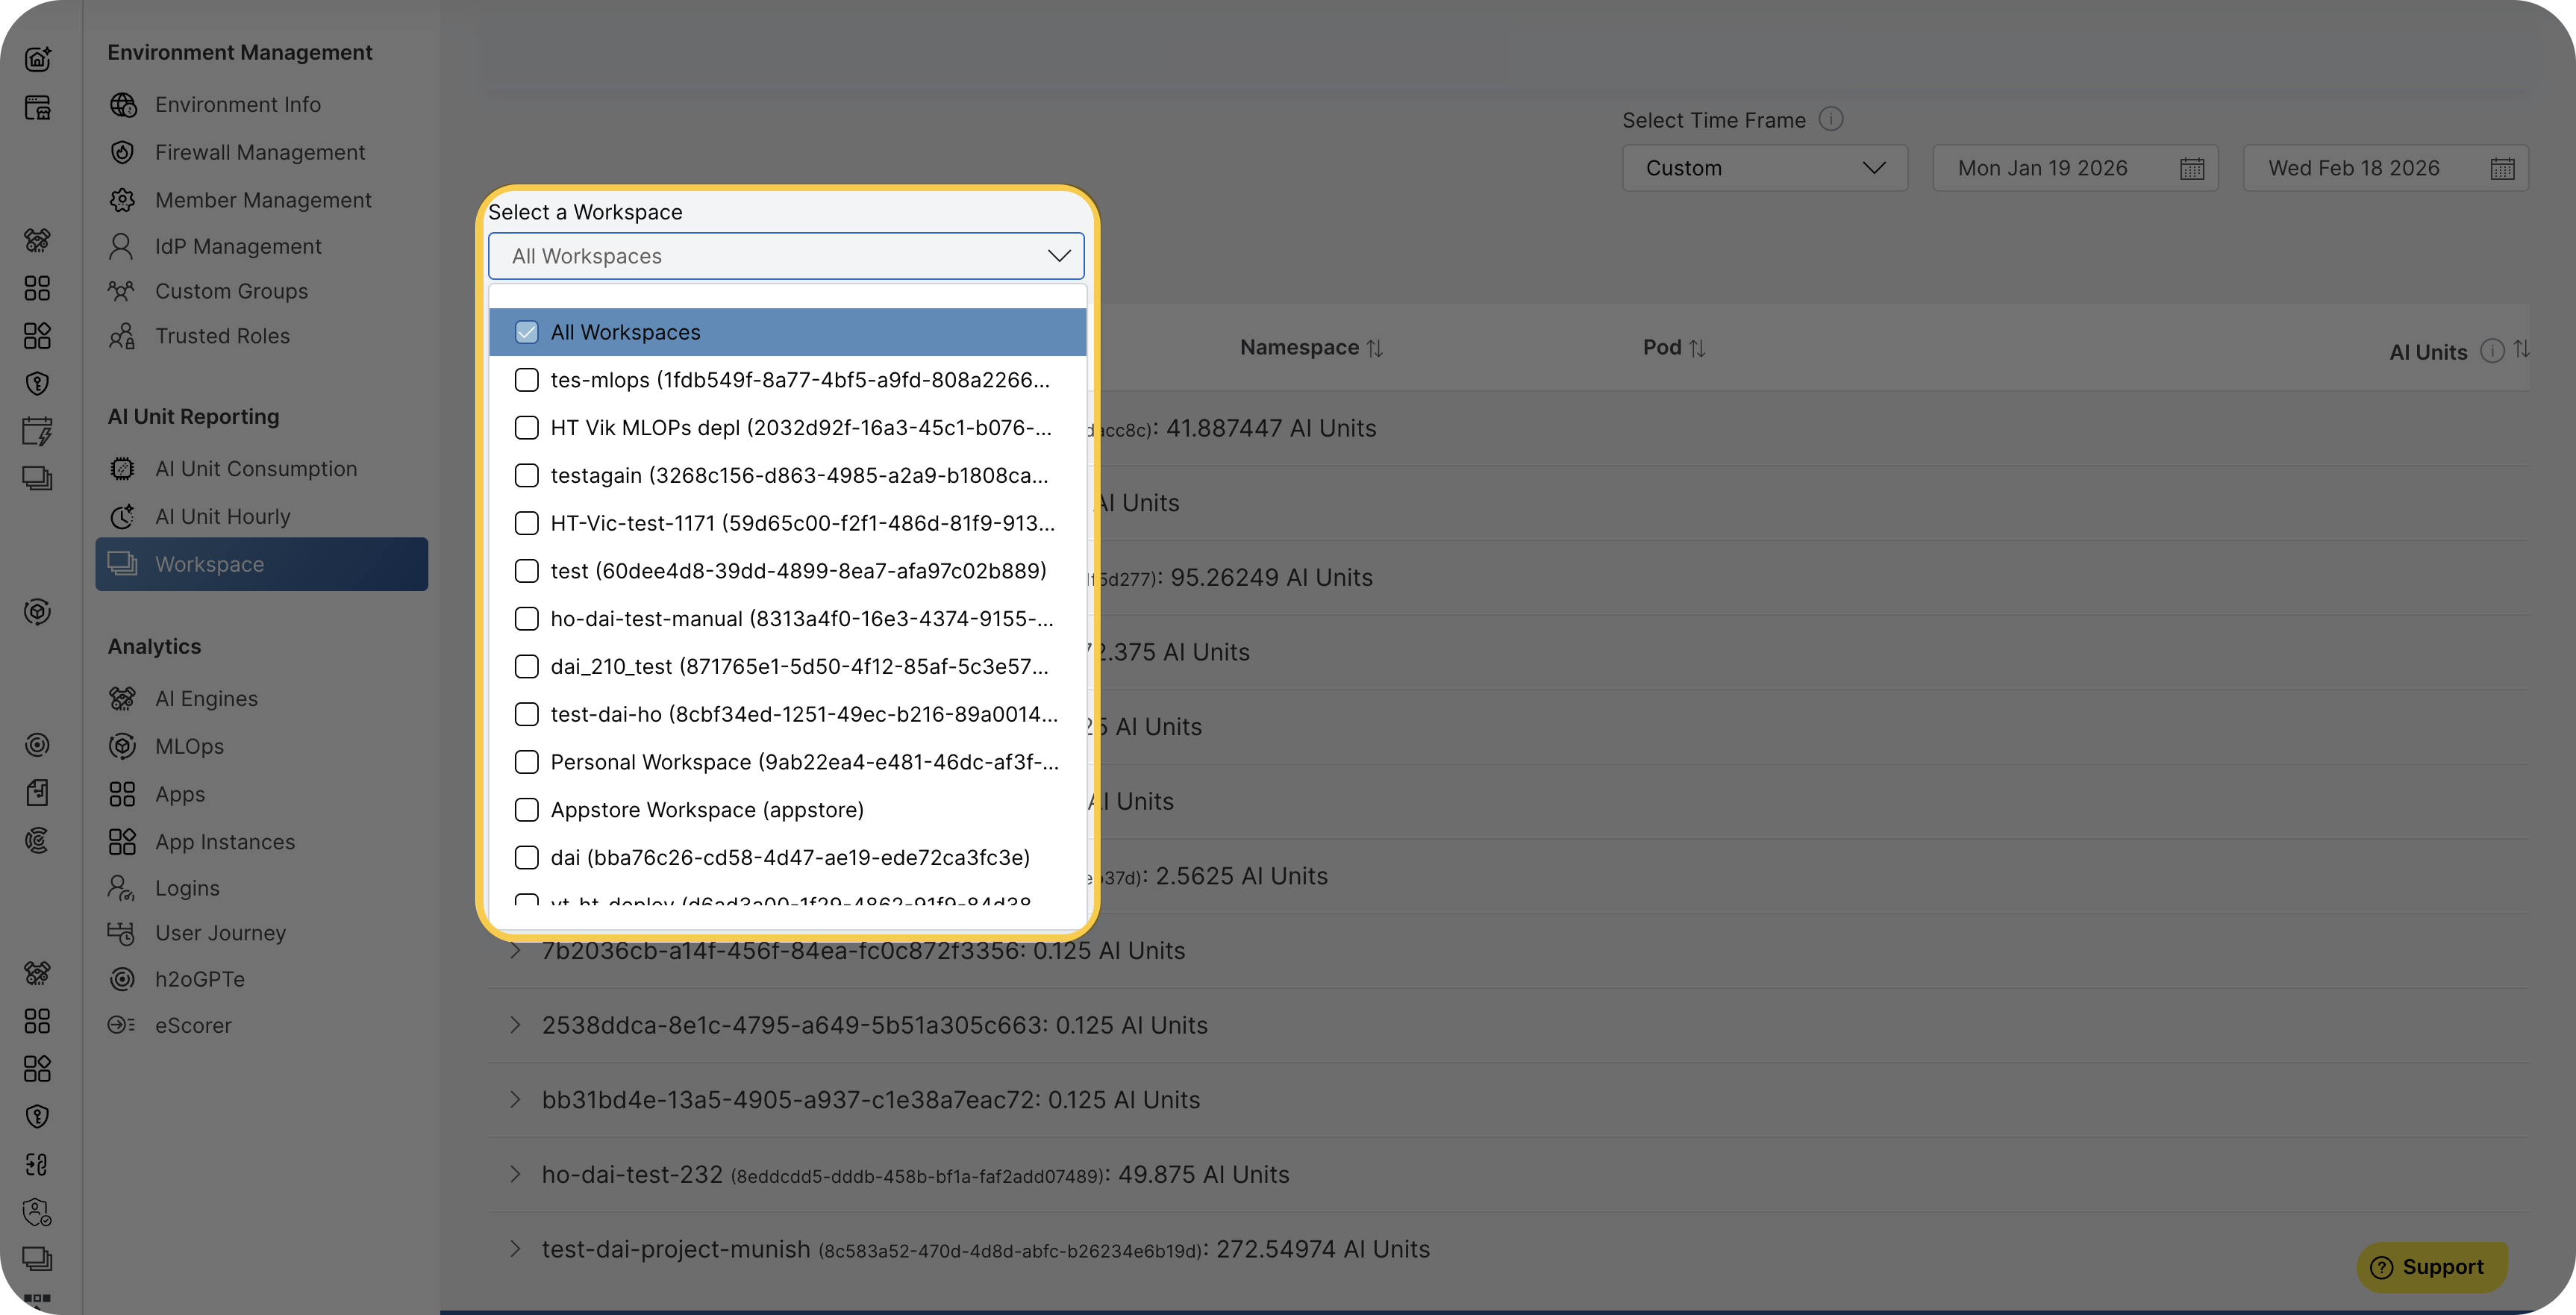
Selecting multiple workspaces allows you to compare consumption patterns and identify workspaces with higher resource usage.
Hierarchical consumption view
The Workspace insights page organizes AI unit consumption data in a hierarchical structure:
Workspace level
The top level displays each selected workspace with its total AI unit consumption. Each workspace item shows:
- Workspace name: The name of the workspace.
- Workspace ID: A unique identifier that differentiates workspaces, particularly useful when multiple personal workspaces share similar names.
- AI unit consumption: The total AI units consumed by the workspace.
- Expand control: An expand icon to view namespaces within the workspace.
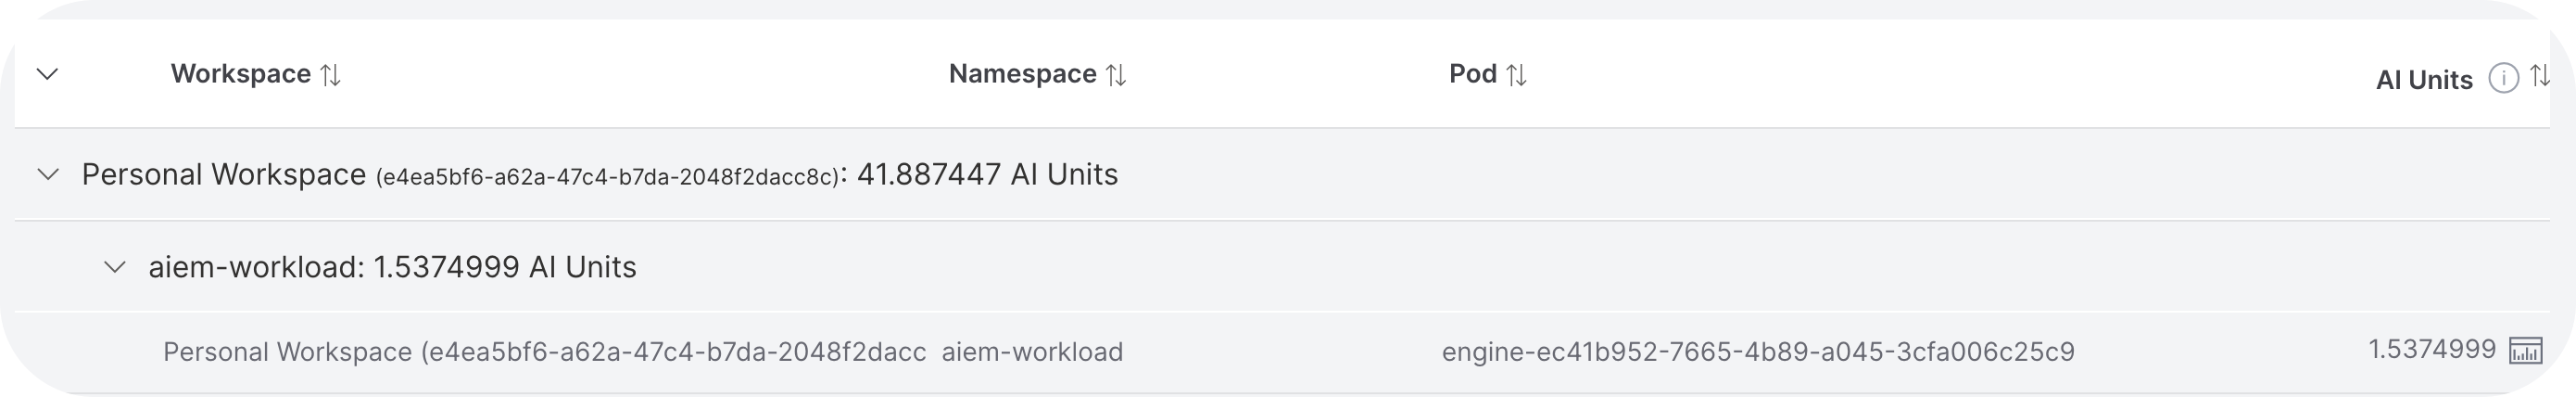
Namespace level
Expand a workspace to see the list of namespaces under that workspace. Each namespace item displays:
- Namespace name: The name of the namespace within the workspace.
- AI unit consumption: The total AI units consumed by the namespace.
- Expand control: An expand icon to view individual consumption records within the namespace.
Individual consumption records
Expand a namespace to see individual consumption records. Each record displays:
- User name: The username attributed to the consumption.
- AI unit consumption: The AI units consumed by that user within the workspace and namespace during the selected time period.
- View usage icon: An icon next to the AI unit value that opens detailed consumption information.
Consumption granularity
The Workspace insights page includes a granularity plot that displays consumption patterns over time. You can view AI unit consumption on a weekly or monthly basis, which helps you:
- Identify which weeks or months had the highest consumption
- Track usage trends for specific users
- Understand consumption patterns to optimize resource allocation
The granularity view shows when AI units were consumed, providing visibility into usage patterns over your selected time period.
View detailed usage
To view detailed information about AI unit consumption at any level:
- Locate the View usage icon next to the AI unit value.
- Click the icon to open a popup window.

- The popup displays a detailed description of the consumption, including:
- Breakdown of resource usage
- Time-based consumption patterns
- Specific activities contributing to AI unit usage
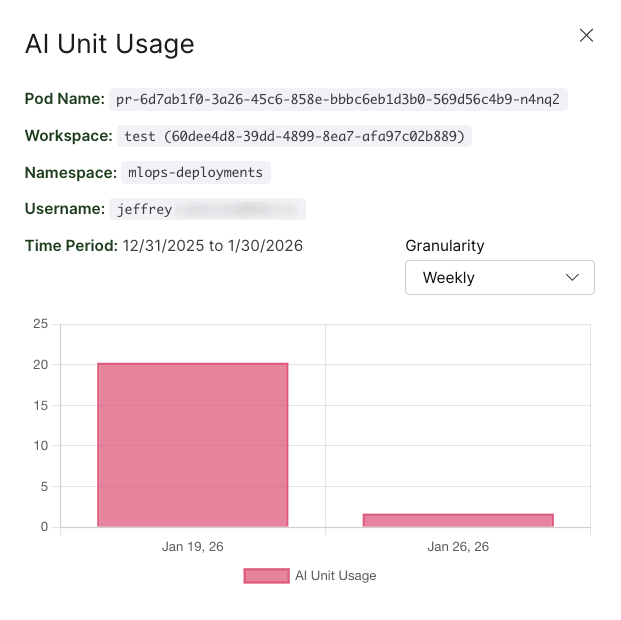
The detailed usage popup provides insights into how AI units are being consumed, helping you identify optimization opportunities and understand resource allocation.
- Submit and view feedback for this page
- Send feedback about H2O Admin Center to cloud-feedback@h2o.ai