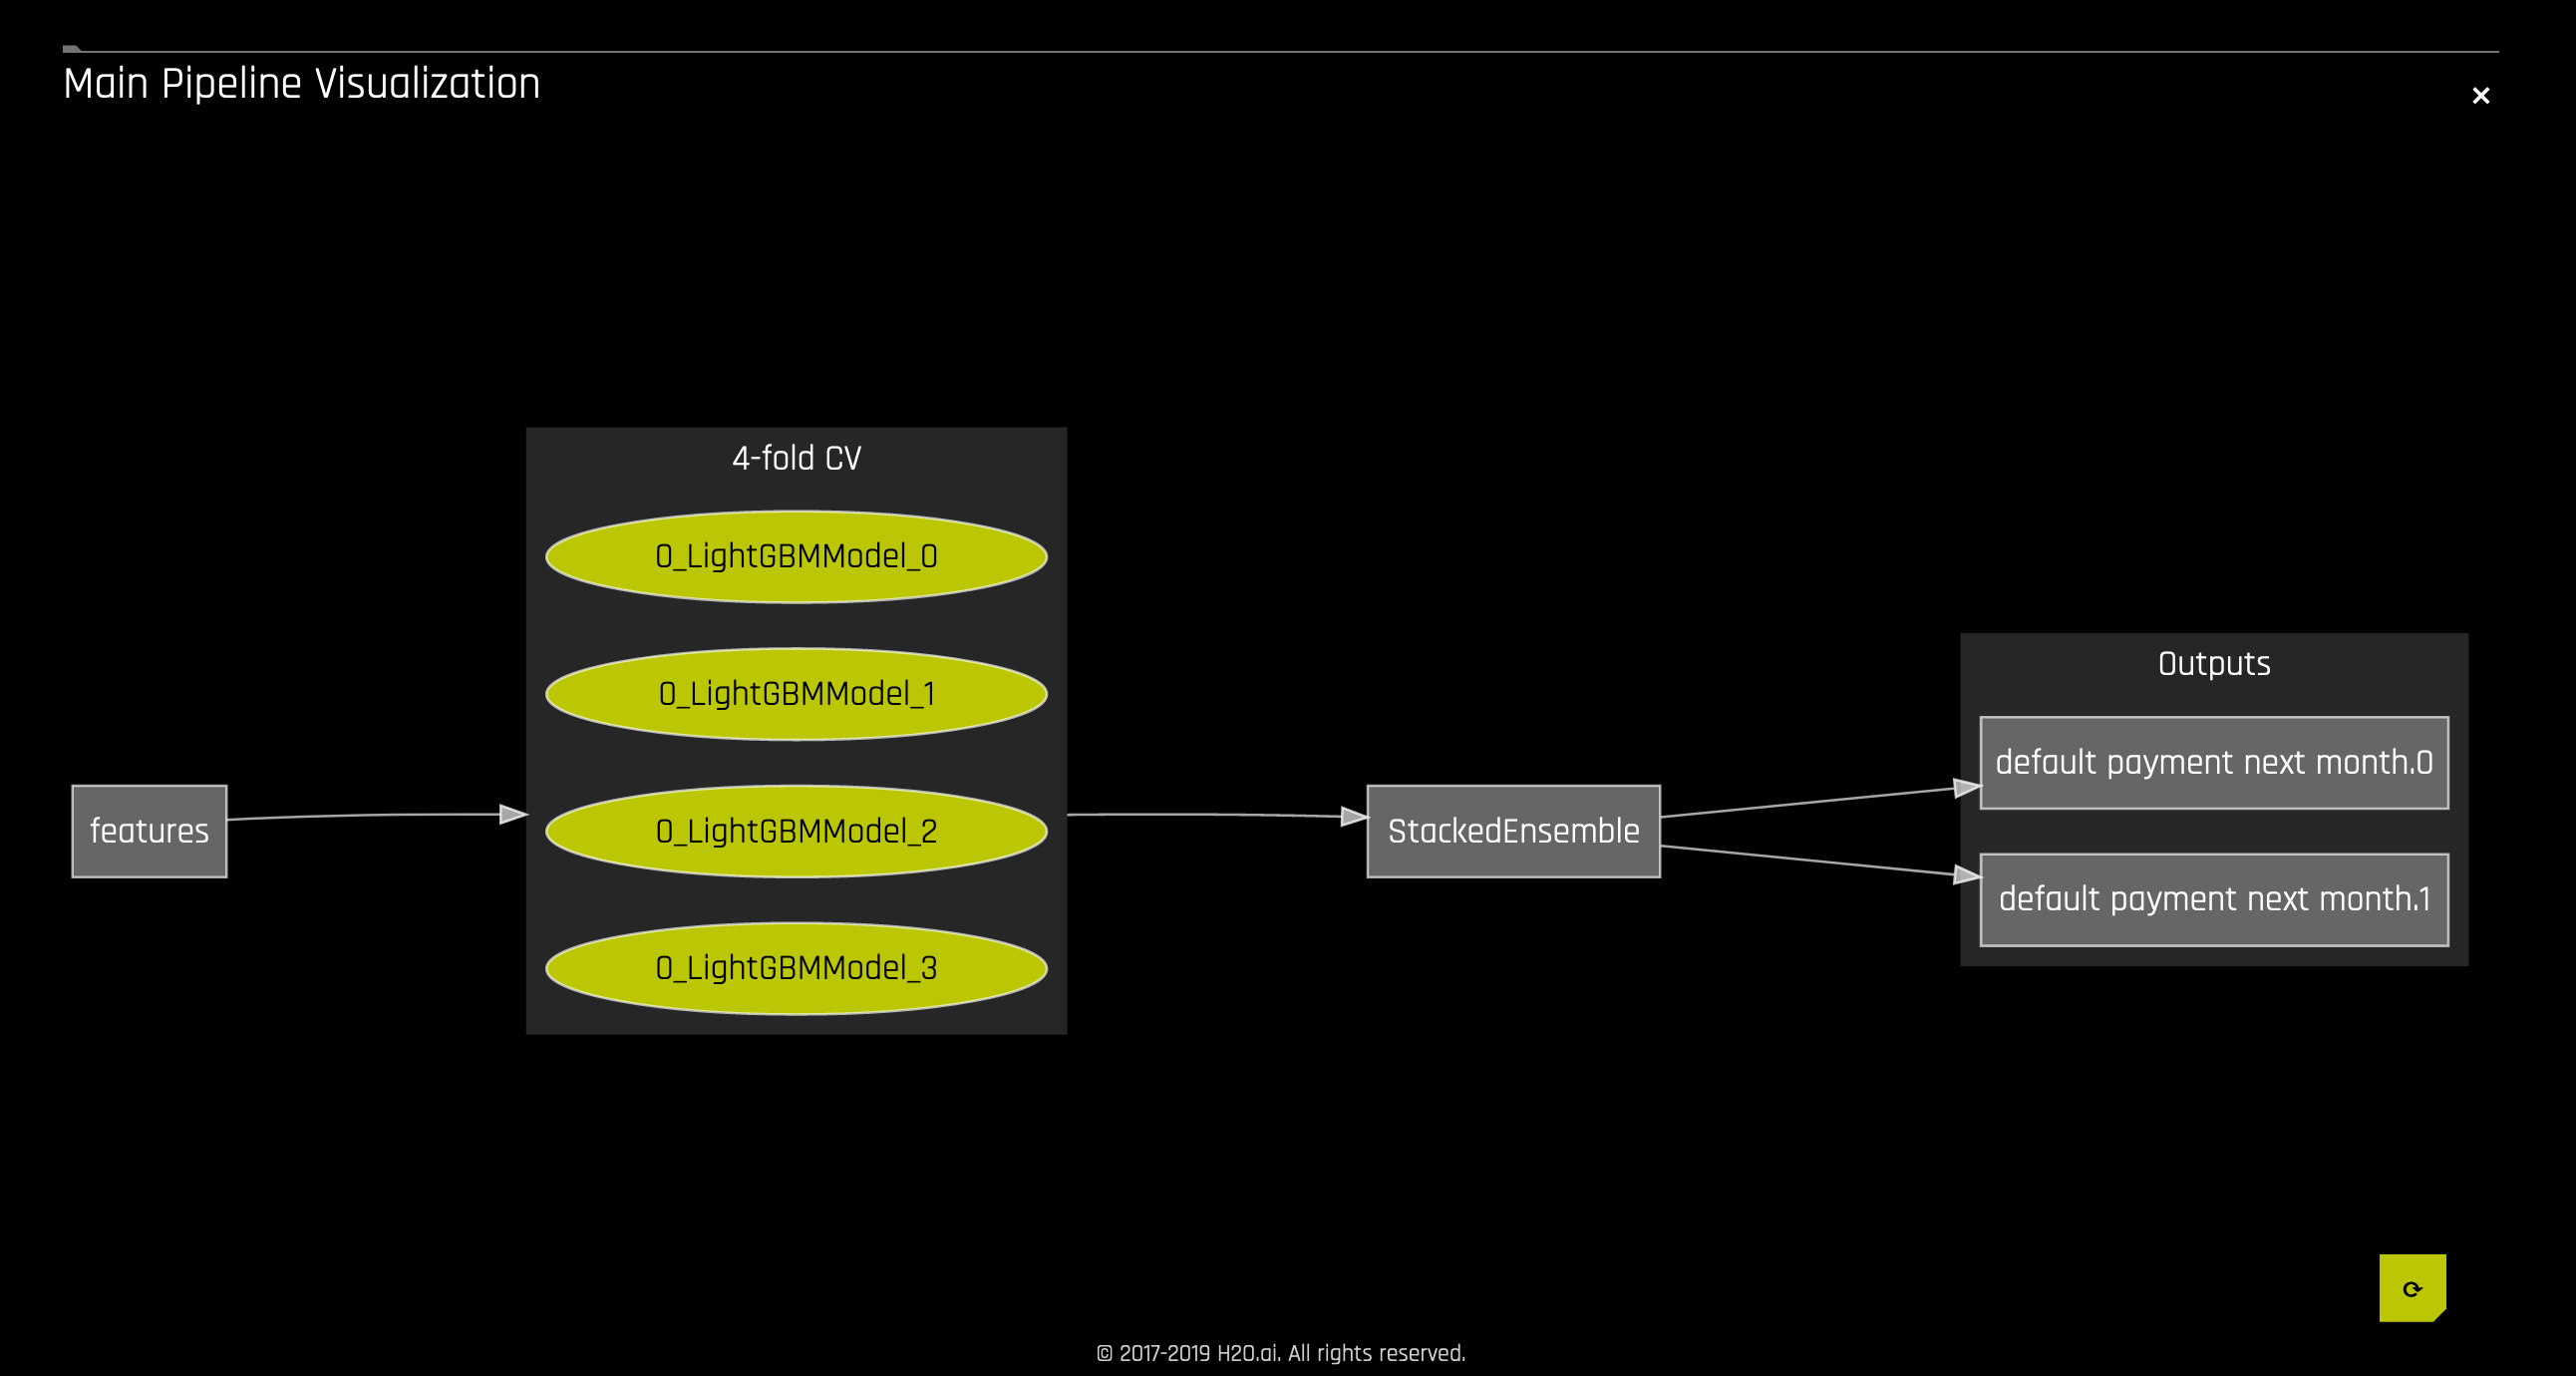
Visualizing the Scoring Pipeline
A visualization of the scoring pipeline is available for each completed experiment.
Notes:
This pipeline is best viewed in the latest version of Chrome.
A .png image of this pipeline is available in the Autoreport and in the mojo.zip file ONLY with the Driverless AI Docker image. For tar, deb, and rpm installs, you must install Graphviz manually in order for the visualization pipeline to be included in the Autoreport and mojo.zip.
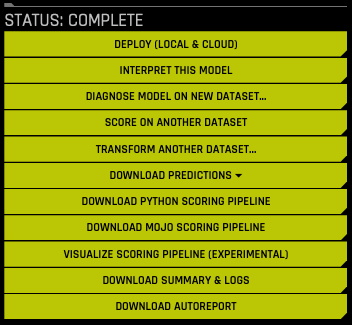
Click the Visualize Scoring Pipeline (Experimental) button on the completed experiment page to view the visualization.
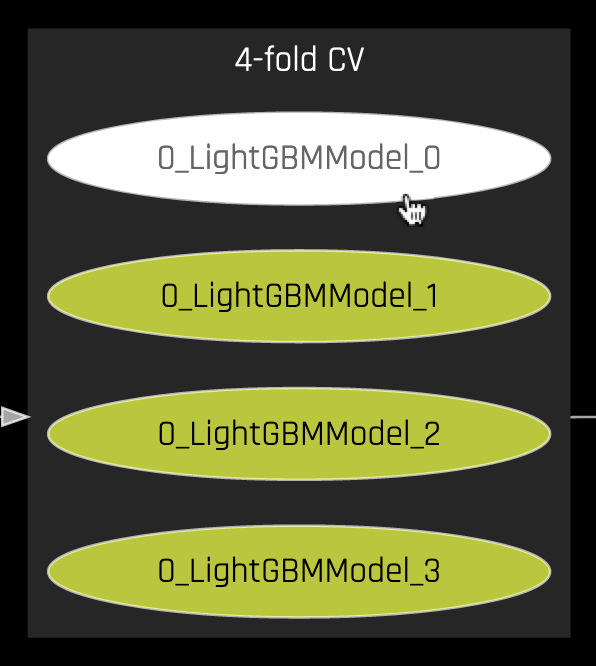
To view a visual representation of a specific model, click on the oval that corresponds with that model.
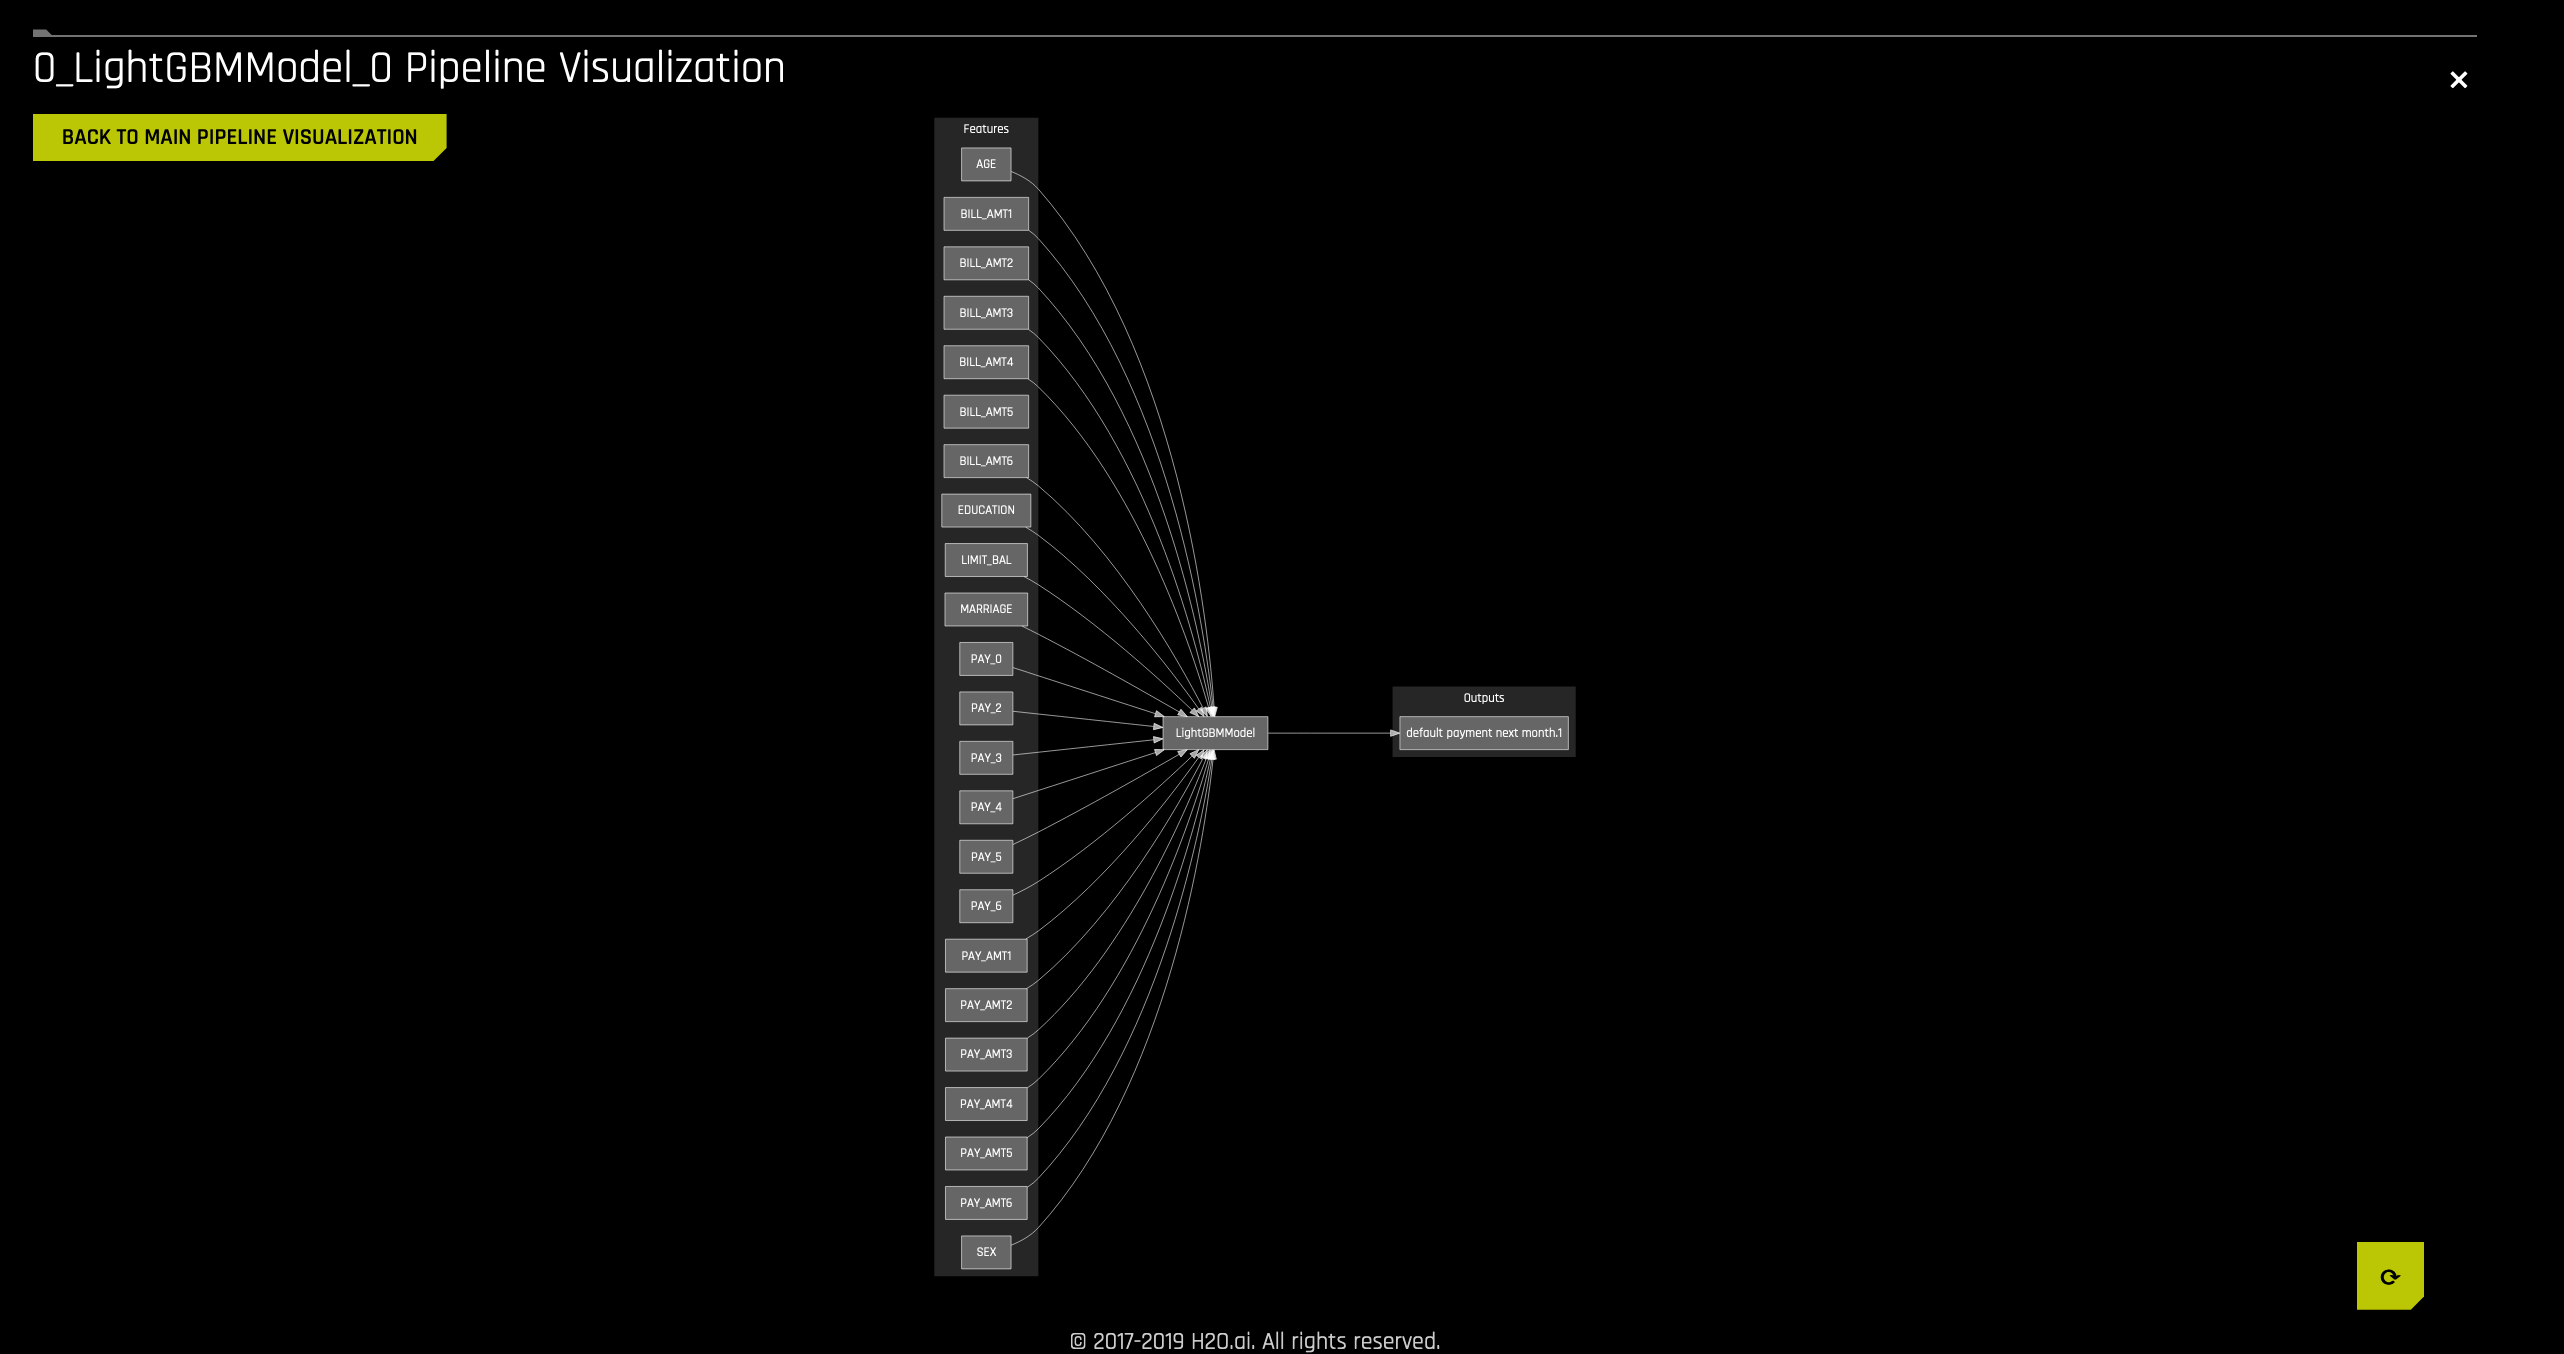
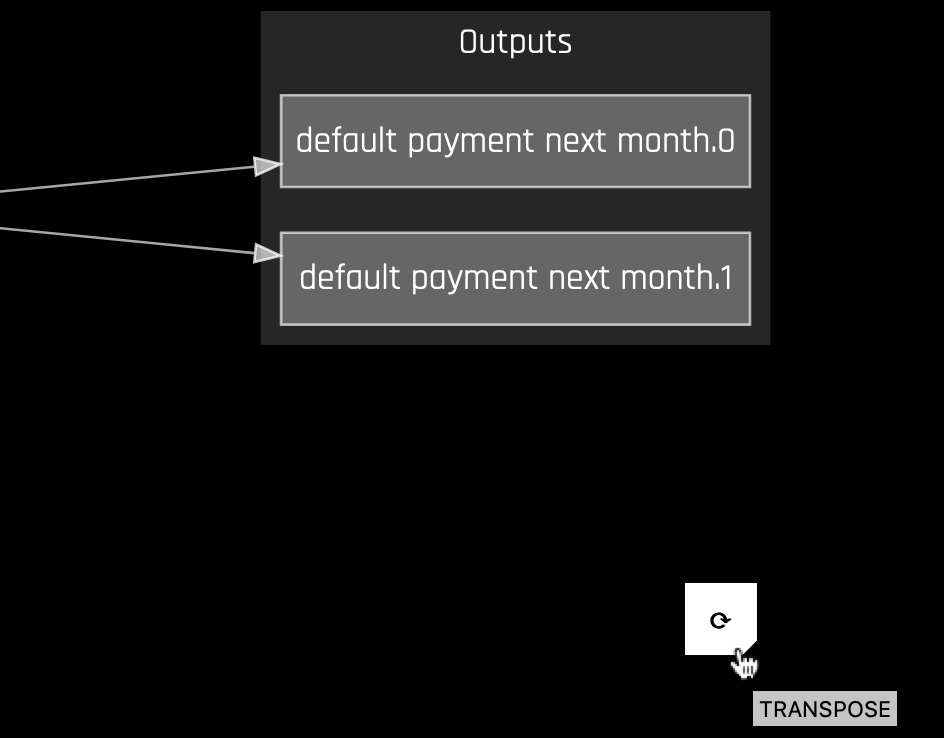
To change the orientation of the visualization, click the Transpose button in the bottom right corner of the screen.