Diagnosing a Model
The Diagnosing Model on New Dataset option allows you to view model performance for multiple scorers based on existing model and dataset.
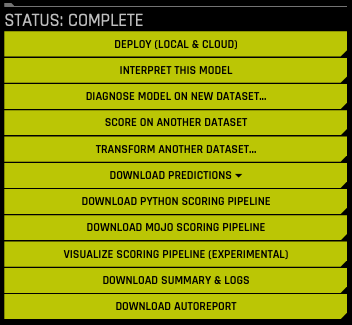
On the completed experiment page, click the Diagnose Model on New Dataset button.
Note: You can also diagnose a model by selecting Diagnostic from the top menu, then selecting an experiment and test dataset.
Select a dataset to use when diagnosing this experiment. Note that the dataset must include the target column that is in the original dataset. At this point, Driverless AI will begin calculating all available scores for the experiment.
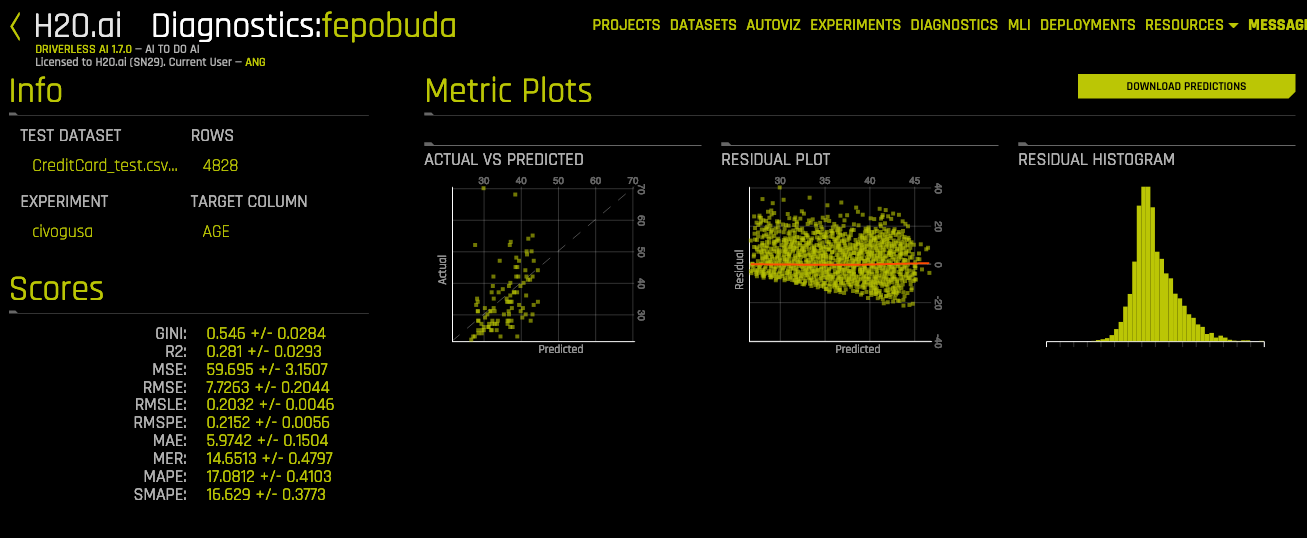
When the diagnosis is complete, it will be available on the Model Diagnostics page. Click on the new diagnosis. From this page, you can download predictions. You can also view scores and metric plots. The plots are interactive. Click a graph to enlarge. In the enlarged view, you can hover over the graph to view details for a specific point. You can also download the graph in the enlarged view.
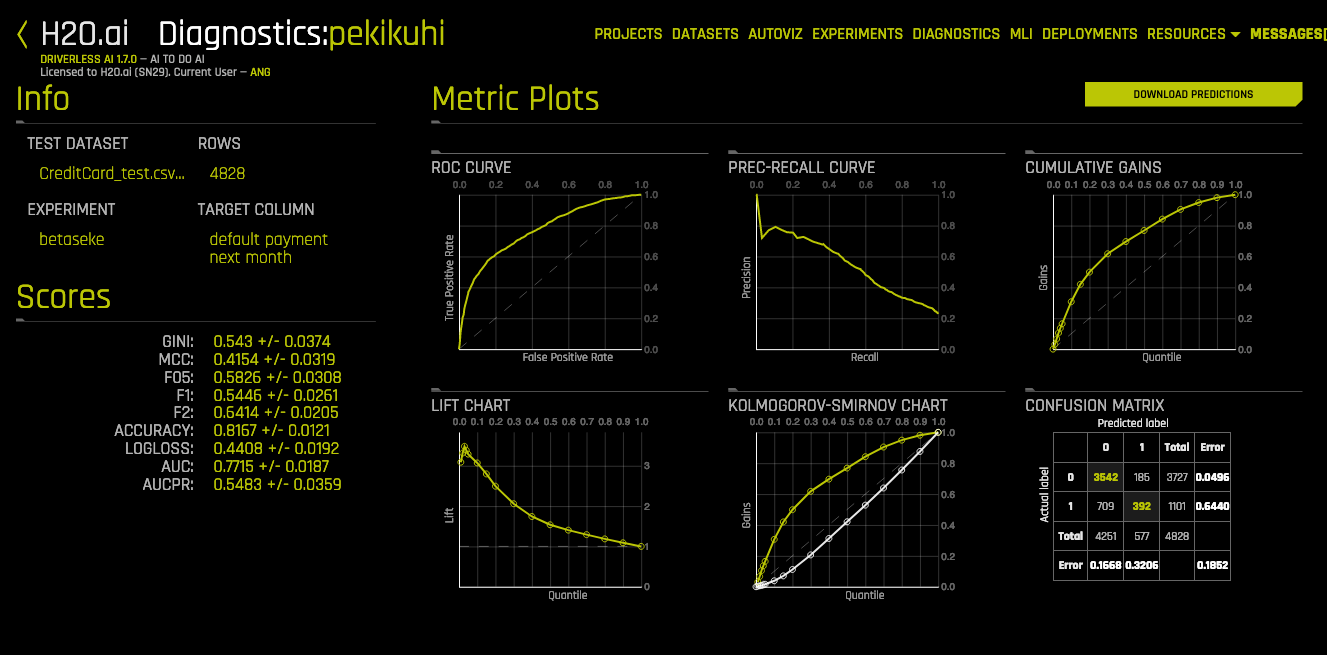
Classification Metric Plots
Classification metric plots include the following graphs:
ROC Curve
Precision-Recall Curve
Cumulative Gains
Lift Chart
Kolmogorov-Smirnov Chart
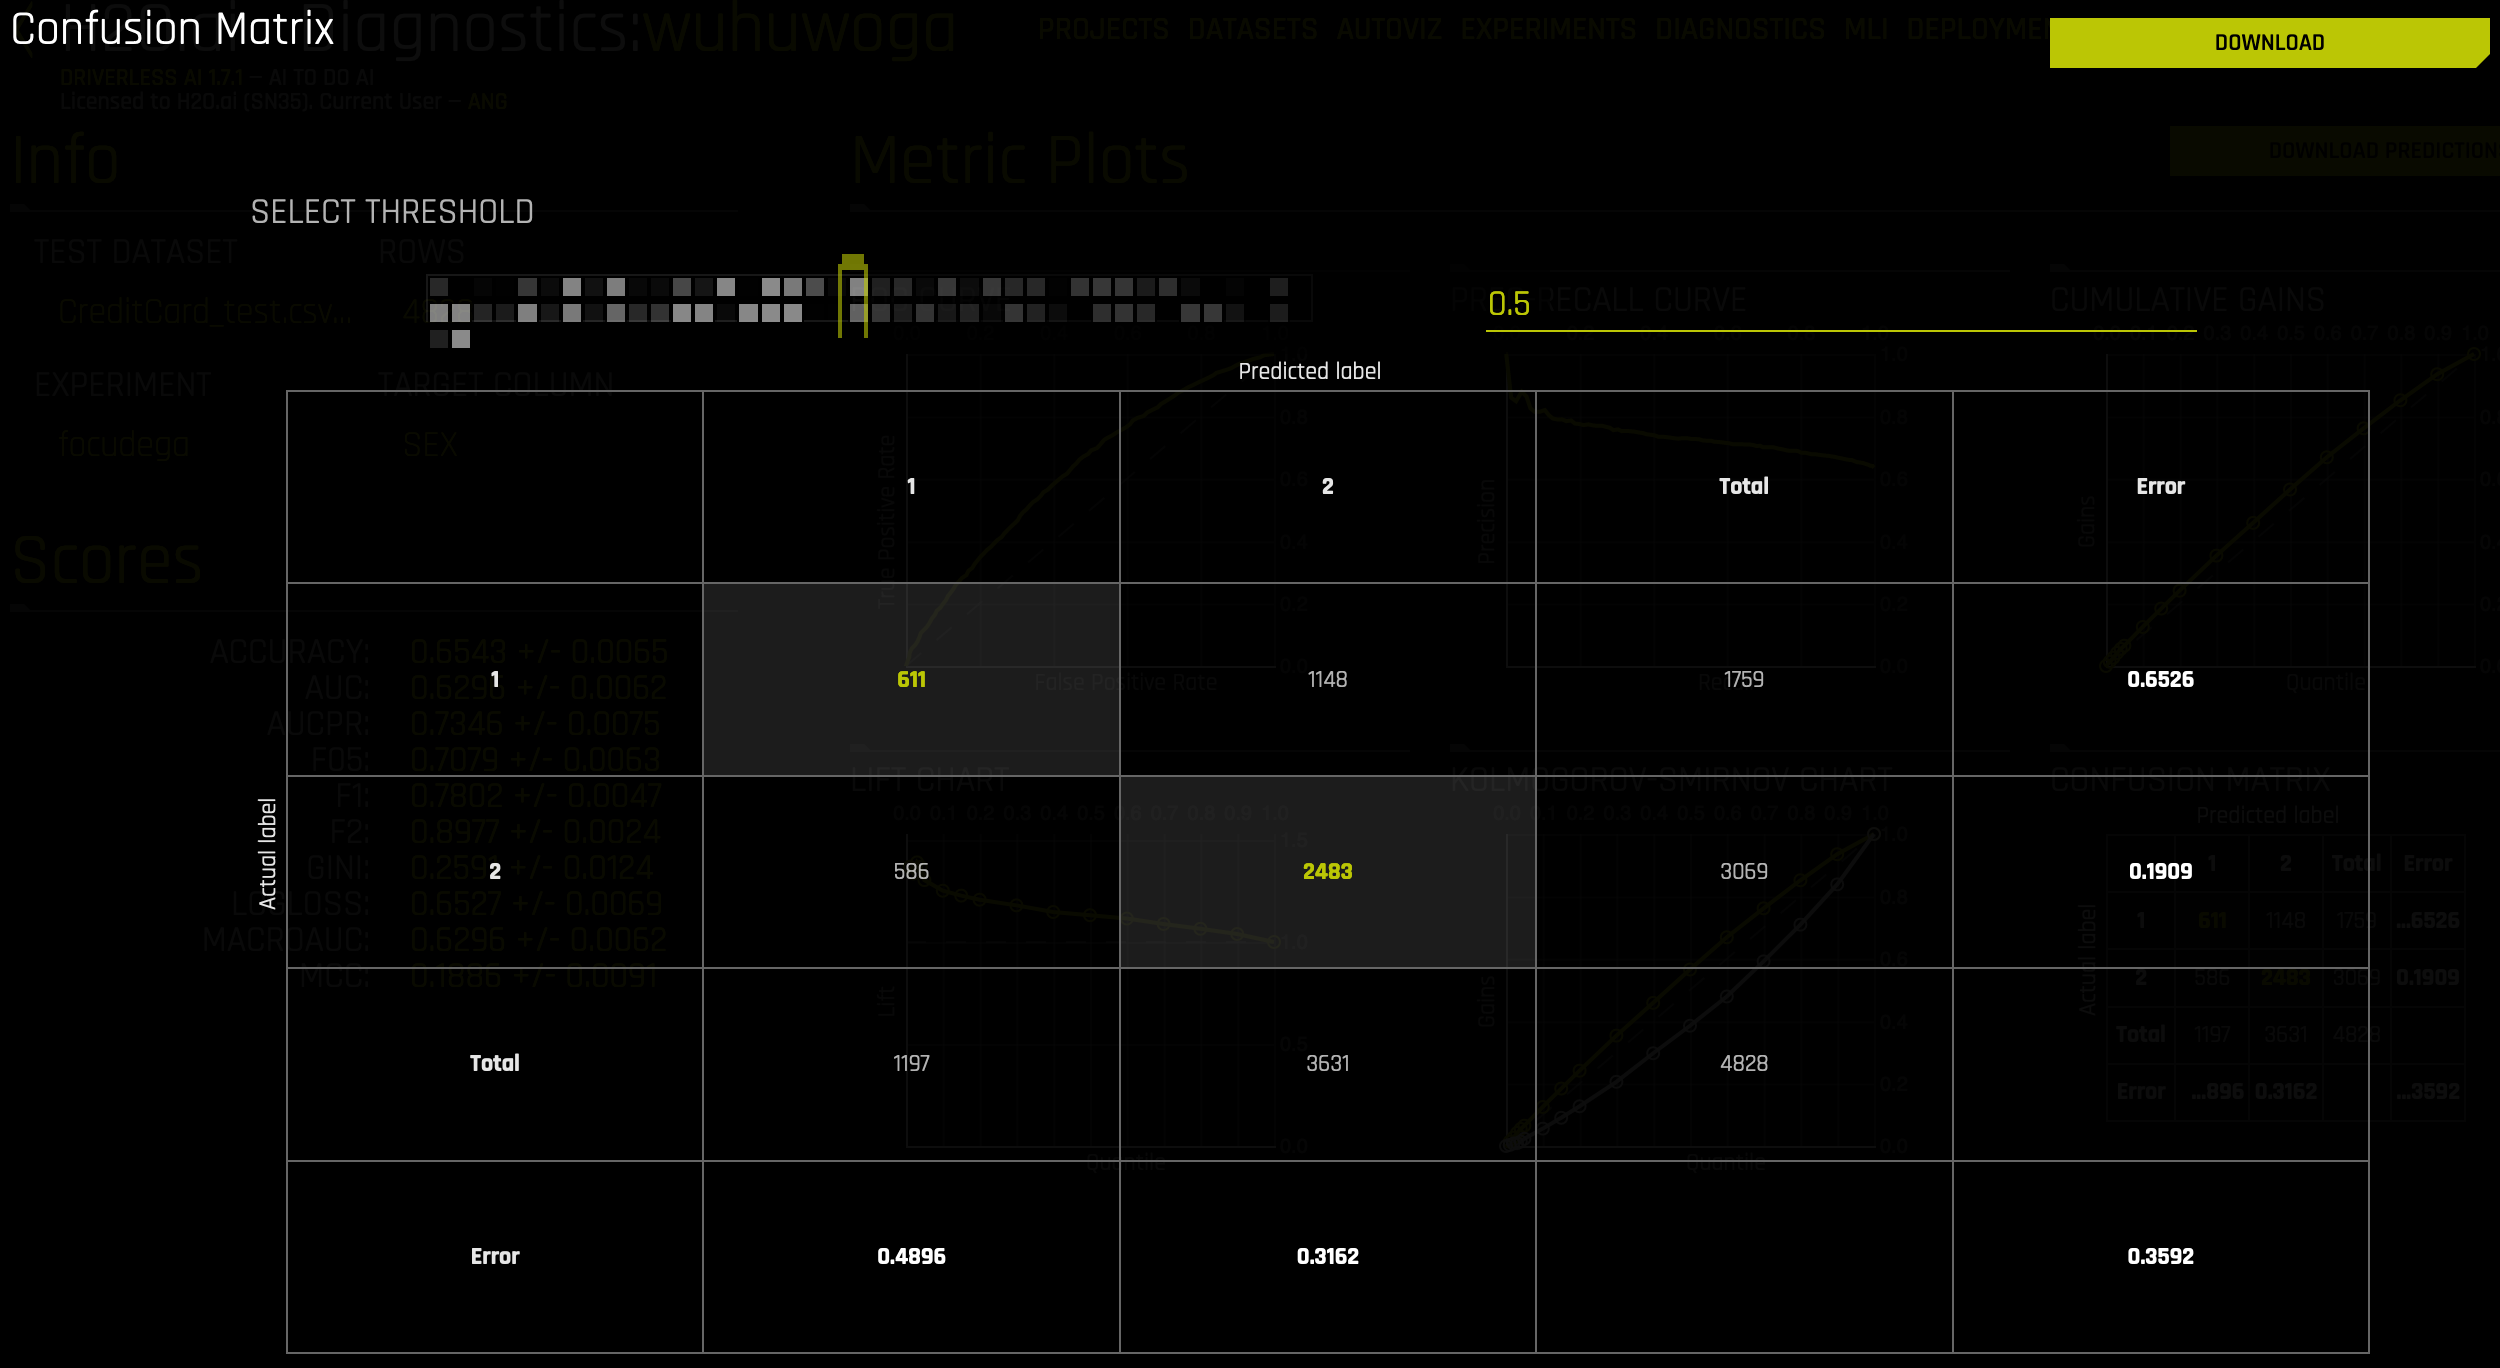
Confusion Matrix
Note: In the Confusion Matrix graph, the threshold value defaults to 0.5. For binary classification experiments, users can specify a different threshold value. The threshold selector is available after clicking on the Confusion Matrix and opening the enlarged view. When you specify a value or change the slider value, Driverless AI automatically computes a diagnostic Confusion Matrix for that given threshold value.
Regression Metric Plots
Regression metric plots include the following graphs:
Actual vs Predicted
Residual Plot with LOESS curve
Residual Histogram