Metrics: Adversarial attack
Overview
H2O Model Security offers an array of metrics in the form of charts, stats cards, and confusion matrices to understand an adversarial attack. Below, each metric is described in turn.
Model attack table
| Column name | Column description |
|---|---|
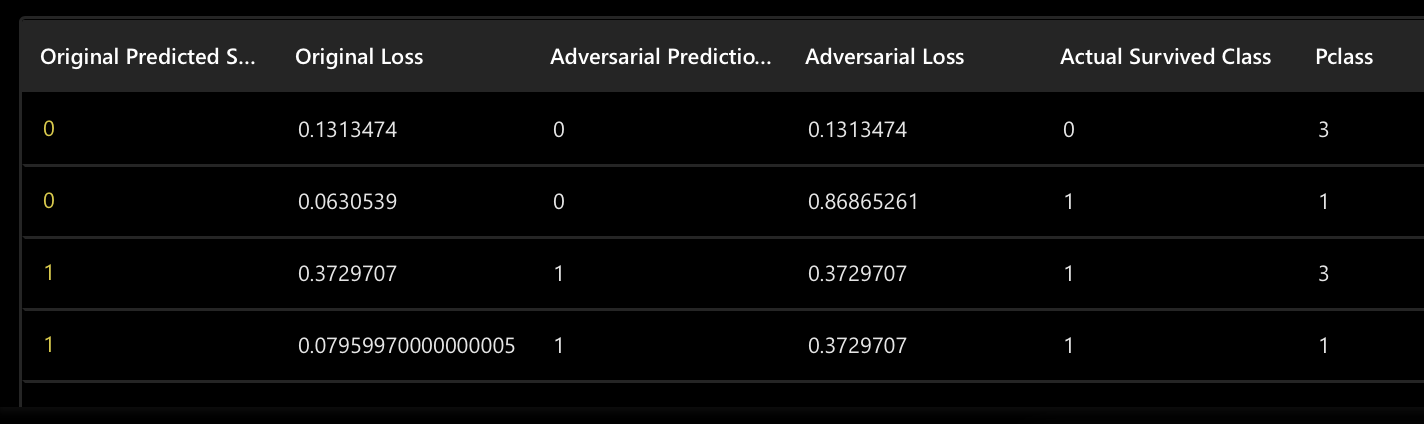
Original predicted {target-column} class | The original predicted {target-column} class refers to the labeled (class) the deployed model in H2O MLOps assigned the sample (row/prediction) without one of its feature (column) values corrupted by H2O Model Security. H2O Model Security replaces the placeholder {target-column} with the model's target column. |
| Original loss | The Original loss refers to the loss of the Original prediction {target-column} class. Loss refers to the penalty for a bad prediction. Loss indicates how bad the model's prediction was on a single example. A zero loss value for a given an example will indicate that the model's prediction is perfect. |
Adversarial prediction {target-column} class | The adversarial prediction {target-column} class refers to the labeled (class) the deployed model in H2O MLOps assigned the sample (row/prediction) with one of its feature (column) values corrupted by H2O Model Security. H2O Model Security replaces the placeholder {target-column} with the model's target column. |
| Adversarial loss | The Adversarial loss refers to the loss of the Adversarial prediction {target-column} class. Loss refers to the penalty for a bad prediction. Loss indicates how bad the model's prediction was on a single example. A zero loss value for a given an example will indicate that the model's prediction is perfect. |
Actual {target-column} class | The Actual {target-column} class refers to the actual target column value of the samples (rows/predictions). |
| ... (rest of columns) | The other columns in the table represent the columns (features) in the validation dataset (minus the target column). |
Stats cards
Old model accuracy
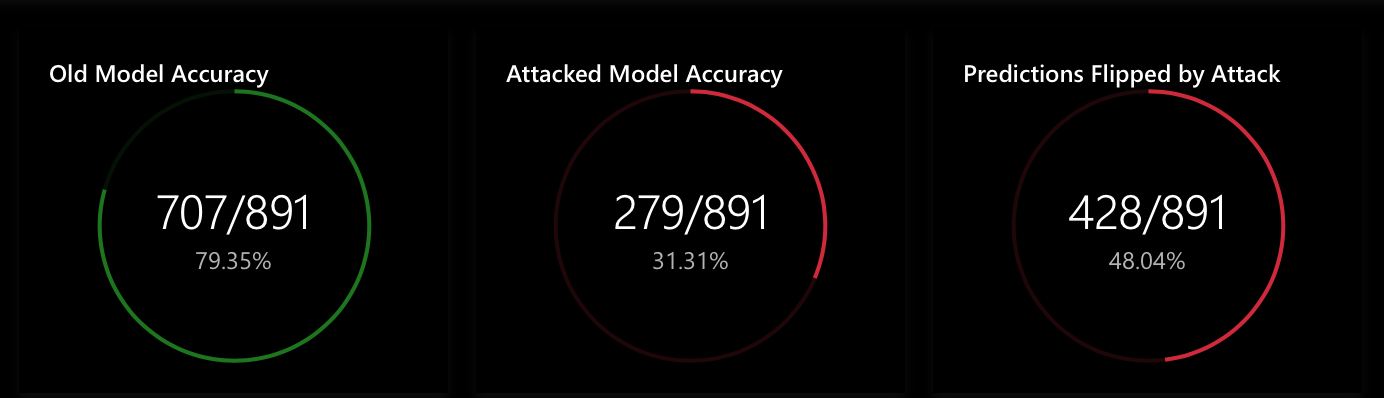
The Old model accuracy stats card displays the model's accuracy before H2O Model Security implemented an adversarial attack on the model deployed in H2O MLOps. In particular, the stats card displays the number of correct predictions out of the total number of predictions made. As well, H2O Model Security displays the number of correct predictions as a percentage value out of 100%.
Attacked model accuracy
The Attacked model accuracy stats card displays the model's accuracy after H2O Model Security implemented an adversarial attack on the model deployed in H2O MLOps. In particular, the stats card displays the number of correct predictions out of the total number of predictions made. As well, H2O Model Security displays the number of correct predictions as a percentage value out of 100%.
Predictions flipped by attack
The Predictions flipped by attack stats card displays the number of predictions flipped due to the implemented adversarial attack. In particular, the stats card displays the number of flipped predictions out of the total number of predictions made. As well, H2O Model Security displays the number of flipped predictions as a percentage value out of 100%.
Confusion matrices
Old confusion matrix
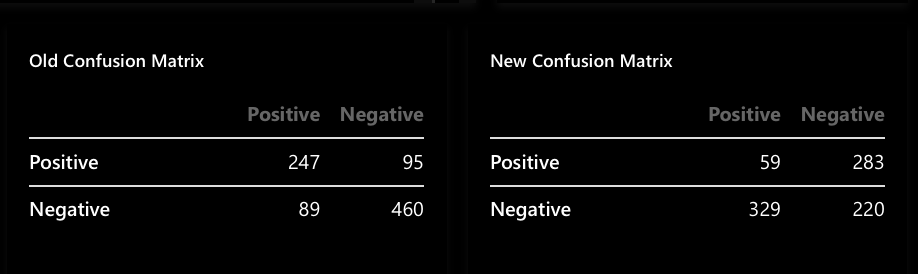
The old confusion matrix displays the confusion matrix of the deployed model in H2O MLOps.
New confusion matrix
The new confusion matrix displays the confusion matrix of the model after H2O Model Security conducted an adversarial attack on the model deployed in H2O MLOps.
Bar graph for {feature} loss
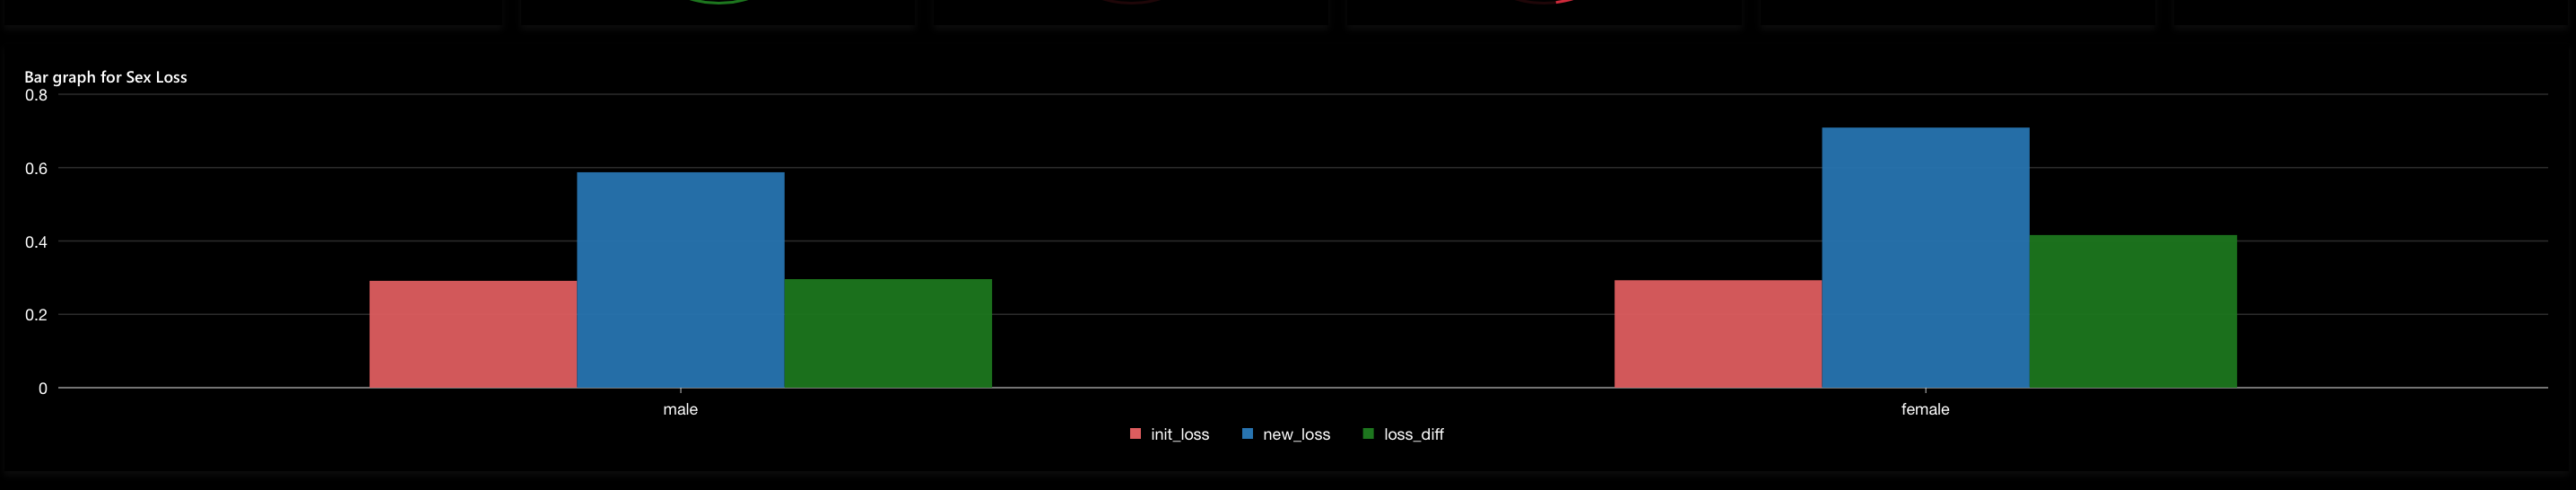
The Bar graph for {feature} loss displays several loss values for all the model feature values generated before and after an adversarial attack. In particular, the bar graph at a time displays loss values for a given feature value. Loss values refer to the loss values obtained before and after an adversarial attack. The bar graph also displays the difference between the old (initial) and new loss for a feature value.
- X-axis: Feature values
- Y-axis: Loss value
For example, observing the bar graph above, we can see that for the Sex feature, we have two values, male and female. For the male feature value, we observed the following:
- Initial loss (in red), which H2O Model Security obtained before the adversarial attack
- New loss (in blue), which H2O Model Security obtained after the adversarial attack
- Loss difference (in green), which represents the loss difference between the initial and new loss
- H2O Model Security replaces the placeholder
{feature}with the selected feature. - To learn how to select a feature to observe, see Select feature to sort loss.
- By default, H2O Model Security selects Bar as the display graph type. To learn how to change the default display graph type, see Select display graph type.
Select feature to sort loss
Defines the feature to observe in the Bar graph for {feature} loss.

Instructions
- In Select feature to sort loss list, select a feature.
Select display graph type
Defines the display graph type H2O Model Security utilizes to display (observe) the loss values for the selected feature in the Select feature to sort loss list. By default, H2O Model Security selects Bar as the display graph type.
Instructions
- In the Select display graph type list, select a display graph type.
- Submit and view feedback for this page
- Send feedback about H2O Model Security to cloud-feedback@h2o.ai