Metrics: Model inversion attack
Overview
H2O Model Security offers an array of metrics in the form of charts, stats cards, and confusion matrices to understand a model inversion attack. Below, each metric is described in turn.
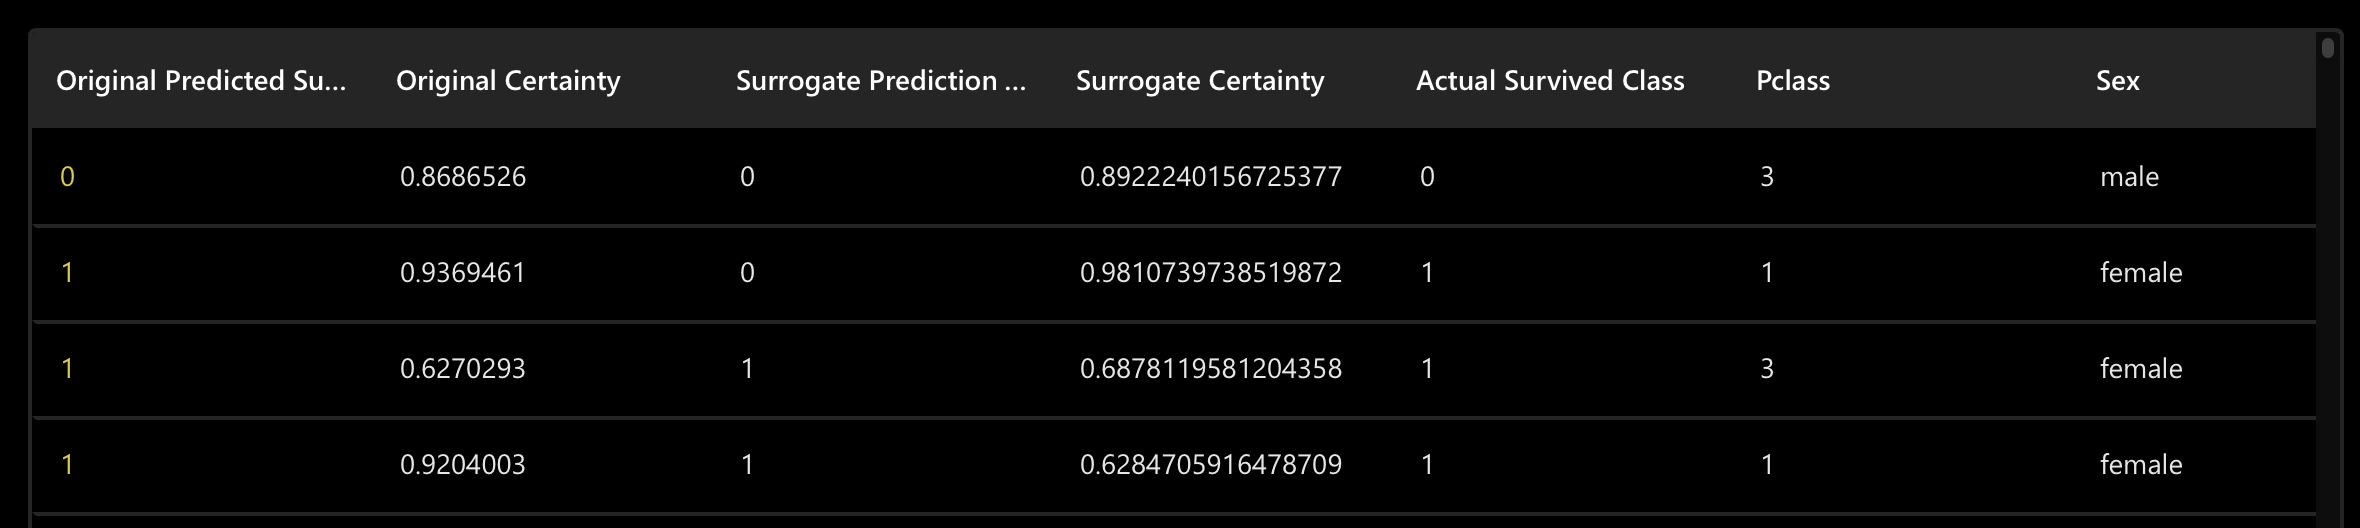
Model inversion attack table
| Column name | Column description |
|---|---|
Original predicted {target-column} class | The original predicted {target-column} class refers to the labeled (class) the deployed model in H2O MLOps assigned the sample (row/prediction) without one of its feature (column) values corrupted by H2O Model Security. H2O Model Security replaces the placeholder {target-column} with the model's target column. |
| Original certainty | The Original certainty refers to the certainty of the Original prediction {target-column} class. Certainty refers to the probability that the predicted class is correct. |
Surrogate prediction {target-column} class | The surrogate prediction {target-column} class refers to the labeled (class) the surrogate model assigned the sample (row/prediction). H2O Model Security replaces the placeholder {target-column} with the model's target column. |
| Surrogate certainty | The Surrogate certainty refers to the certainty of the Surrogate prediction {target-column} class. Certainty refers to the probability that the predicted class is correct. |
Actual {target-column} class | The Actual {target-column} class refers to the actual target column value of the samples (rows/predictions). |
| ... (rest of columns) | The other columns in the table represent the columns (features) in the validation dataset (minus the target column). |
Stats cards
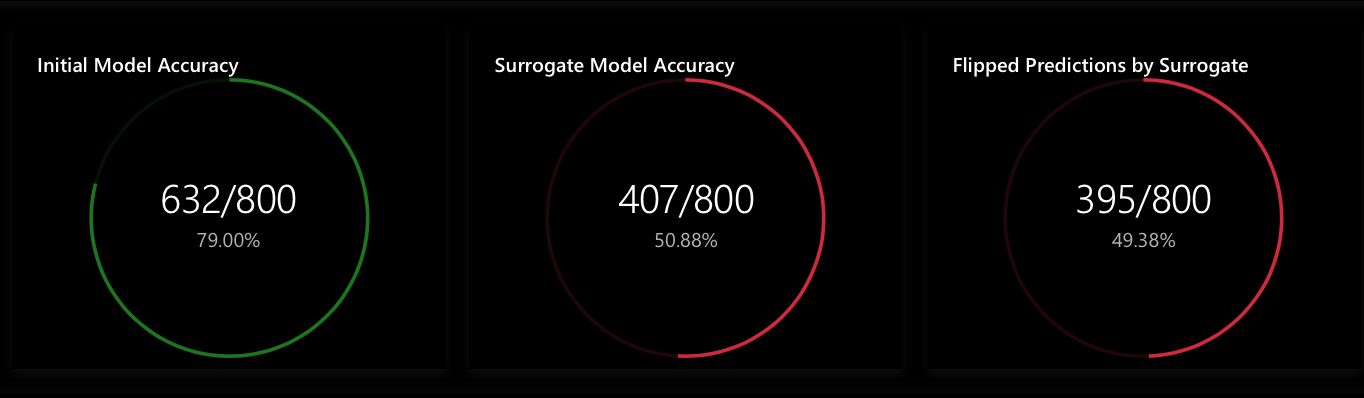
Initial model accuracy
The Initial model accuracy stats card displays the model accuracy of the original model deployed in H2O MLOPs. In particular, the stats card displays the number of correct predictions out of the total number of predictions made. As well, H2O Model Security displays the number of correct predictions as a percentage value out of 100%.
Surrogate model accuracy
The Surrogate model accuracy stats card displays the model accuracy of the Gradient Boosting Machine (GBM) surrogate model built during the model inversion attack. In particular, the stats card displays the number of correct predictions out of the total number of predictions made. As well, H2O Model Security displays the number of correct predictions as a percentage value out of 100%.
Flipped predictions by surrogate model
The Flipped predictions by surrogate model stats card displays the number of predictions flipped due to the implemented model inversion attack (surrogate model). In particular, the stats card displays the number of flipped predictions out of the total number of predictions made. As well, H2O Model Security displays the number of flipped predictions as a percentage value out of 100%.
Confusion matrices
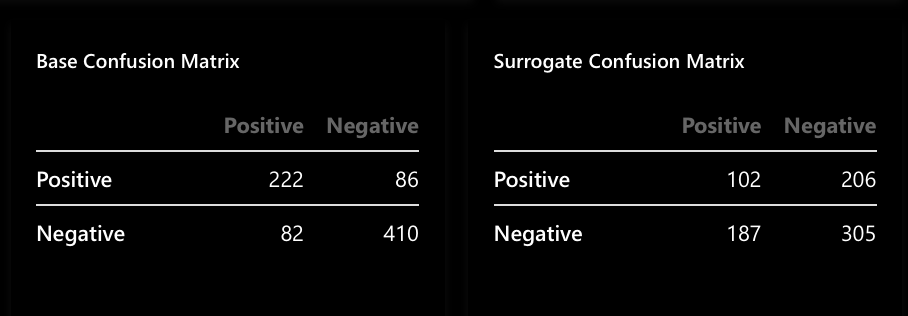
Base confusion matrix
The Base confusion matrix displays the confusion matrix of the model deployed in H2O MLOps.
Surrogate confusion matrix
The Surrogate confusion matrix displays the confusion matrix of the surrogate model built during the model inversion attack.
Bar graph for {feature} certainty
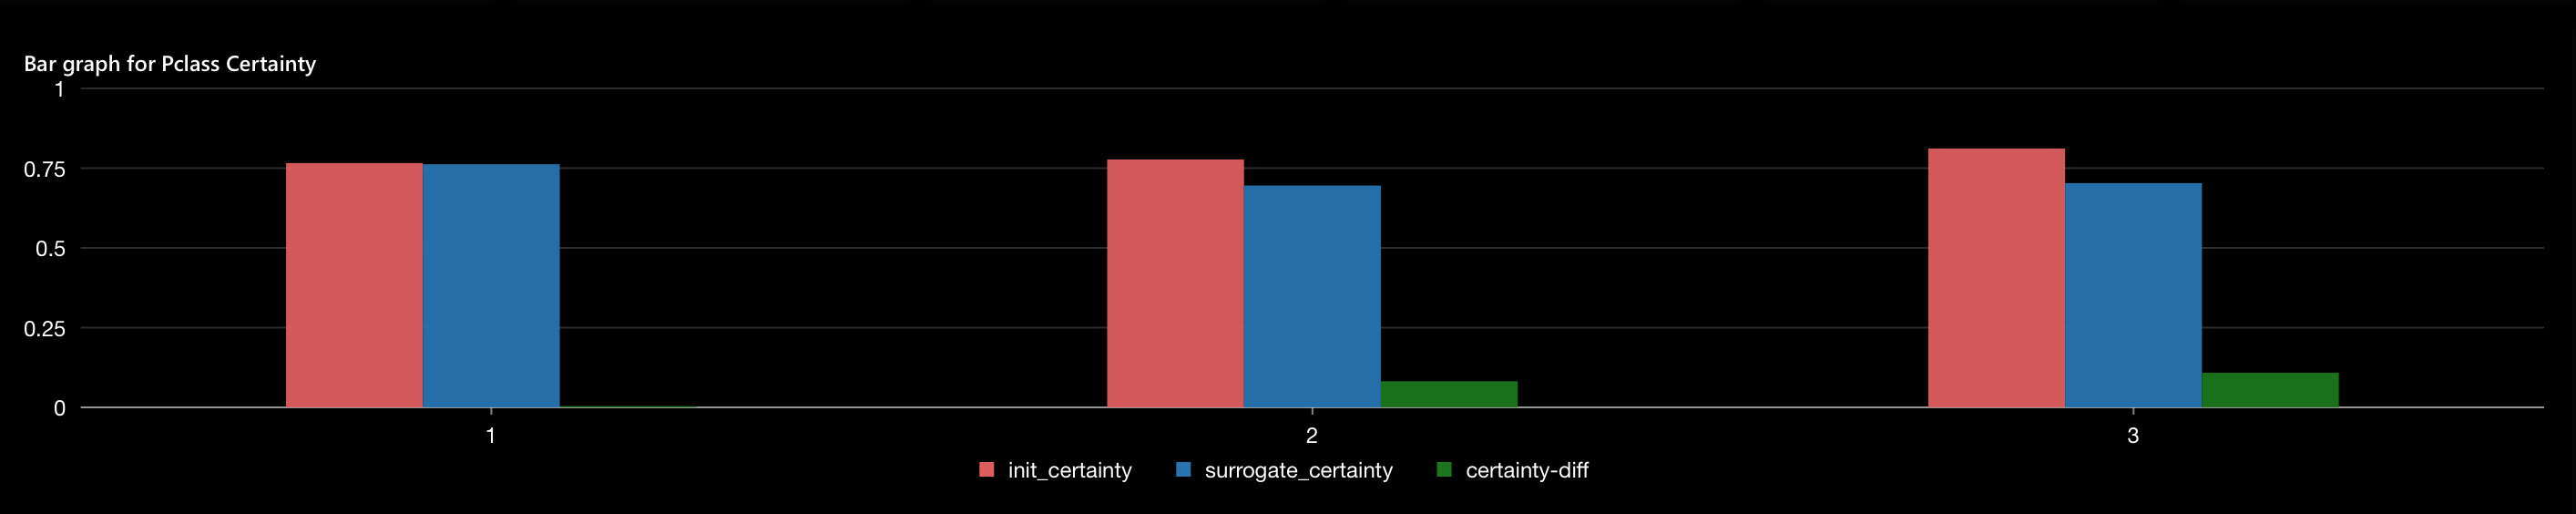
The Bar graph for {feature} certainty displays several certainty values for all the model feature values generated in the original and surrogate model. In particular, the bar graph at a time displays certainty values for a given feature value. The bar graph also displays the difference between a feature value's original (initial) and surrogate certainty.
- X-axis: Feature values
- Y-axis: Certainty values
For example, observing the bar graph above, we can see that for the Pclass (passenger class) feature, we have three values, 1, 2, and 3. For the 1st class feature value (1), we observed the following:
- Initial (original) certainty (in red), which H2O Model Security obtained before the model inversion attack
- Surrogate certainty (in blue), which H2O Model Security obtained using the surrogate model
- Certainty difference (in green), which represents the loss difference between the original and surrogate certainty
- H2O Model Security replaces the placeholder
{feature}with the selected feature. - To learn how to select a feature to observe, see Select feature to sort loss.
- By default, H2O Model Security selects Bar as the display graph type. To learn how to change the default display graph type, see Select display graph type.
Select feature to sort loss
Defines the feature to observe in the Bar graph for {feature} certainty.
Intructions
- In Select feature to sort loss list, select a feature.
Select display graph type
Defines the display graph type H2O Model Security utilizes to display (observe) the certainty values for the selected feature in the Select feature to sort loss list. By default, H2O Model Security selects Bar as the display graph type.
Instructions
- In the Select display graph type list, select a display graph type.
- Submit and view feedback for this page
- Send feedback about H2O Model Security to cloud-feedback@h2o.ai