Driverless AI - Time Series 모델 학습
이 페이지에서는 time series 모델을 학습하도록 Driverless AI를 사용하는 예를 설명합니다. 목표는 다음 주 특정 매장 및 부서의 주간 매출을 예측하는 것입니다. 본 예는 Kaggle 월마트 매출 분석 대회 의 데이터를 사용하고 있으며, features.csv 및 train.csv 가 결합되어 있습니다.
다음은 Python Client Documentation 입니다.
워크플로우
Python으로 데이터 가져오기
Time Series 데이터 형식 지정
Driverless AI에 데이터 업로드
Driverless AI 실험 시작
모델 성능 평가
[1]:
import pandas as pd
import driverlessai

%matplotlib inline
import matplotlib.pyplot as plt
import matplotlib.dates as mdates
1단계: 데이터 가져오기
우선 pandas를 사용하여 데이터를 가져옵니다. 먼저 Python의 데이터를 사용하여 Driverless AI time series 사용 사례에 맞게 올바른 형식을 지정합니다.
[3]:
sales_data = pd.read_csv('./walmart.csv')
sales_data.head()
[3]:
| Unnamed: 0 | Store | Date | IsHoliday | Dept | Weekly_Sales | Temperature | Fuel_Price | MarkDown1 | MarkDown2 | MarkDown3 | MarkDown4 | MarkDown5 | CPI | Unemployment | Type | Size | |
|---|---|---|---|---|---|---|---|---|---|---|---|---|---|---|---|---|---|
| 0 | 1 | 1 | 2010-02-05 | False | 1.0 | 24924.50 | 42.31 | 2.572 | NaN | NaN | NaN | NaN | NaN | 211.096358 | 8.106 | A | 151315 |
| 1 | 2 | 1 | 2010-02-05 | False | 26.0 | 11737.12 | 42.31 | 2.572 | NaN | NaN | NaN | NaN | NaN | 211.096358 | 8.106 | A | 151315 |
| 2 | 3 | 1 | 2010-02-05 | False | 17.0 | 13223.76 | 42.31 | 2.572 | NaN | NaN | NaN | NaN | NaN | 211.096358 | 8.106 | A | 151315 |
| 3 | 4 | 1 | 2010-02-05 | False | 45.0 | 37.44 | 42.31 | 2.572 | NaN | NaN | NaN | NaN | NaN | 211.096358 | 8.106 | A | 151315 |
| 4 | 5 | 1 | 2010-02-05 | False | 28.0 | 1085.29 | 42.31 | 2.572 | NaN | NaN | NaN | NaN | NaN | 211.096358 | 8.106 | A | 151315 |
[4]:
# Convert Date column to datetime
sales_data["Date"] = pd.to_datetime(sales_data["Date"], format="%Y-%m-%d")
sales_data.head()
[4]:
| Unnamed: 0 | Store | Date | IsHoliday | Dept | Weekly_Sales | Temperature | Fuel_Price | MarkDown1 | MarkDown2 | MarkDown3 | MarkDown4 | MarkDown5 | CPI | Unemployment | Type | Size | |
|---|---|---|---|---|---|---|---|---|---|---|---|---|---|---|---|---|---|
| 0 | 1 | 1 | 2010-02-05 | False | 1.0 | 24924.50 | 42.31 | 2.572 | NaN | NaN | NaN | NaN | NaN | 211.096358 | 8.106 | A | 151315 |
| 1 | 2 | 1 | 2010-02-05 | False | 26.0 | 11737.12 | 42.31 | 2.572 | NaN | NaN | NaN | NaN | NaN | 211.096358 | 8.106 | A | 151315 |
| 2 | 3 | 1 | 2010-02-05 | False | 17.0 | 13223.76 | 42.31 | 2.572 | NaN | NaN | NaN | NaN | NaN | 211.096358 | 8.106 | A | 151315 |
| 3 | 4 | 1 | 2010-02-05 | False | 45.0 | 37.44 | 42.31 | 2.572 | NaN | NaN | NaN | NaN | NaN | 211.096358 | 8.106 | A | 151315 |
| 4 | 5 | 1 | 2010-02-05 | False | 28.0 | 1085.29 | 42.31 | 2.572 | NaN | NaN | NaN | NaN | NaN | 211.096358 | 8.106 | A | 151315 |
2단계: Time Series 데이터 형식 지정
데이터에 Store, Department, Week별로 하나의 레코드가 있습니다. 이 사용 사례의 목표는 다음 주 총 매출을 예측하는 것입니다.
예측 변수로 사용할 특성은 채점 시점에 사용할 수 있는 특성 뿐입니다. 온도, 연료비, 실업률 등의 특성은 사전에 알려지지 않았습니다. 따라서 Driverless AI 실험을 시작하기 전에 지난주 온도, 연료비, 실업률, CPI 속성 사용을 선택합니다. 이러한 정보는 스코어링 시에 알게 됩니다.
[5]:
lag_variables = ["Temperature", "Fuel_Price", "CPI", "Unemployment"]
dai_data = sales_data.set_index(["Date", "Store", "Dept"])
lagged_data = dai_data.loc[:, lag_variables].groupby(level=["Store", "Dept"]).shift(1)
[6]:
# Join lagged predictor variables to training data
dai_data = dai_data.join(lagged_data.rename(columns=lambda x: x +"_lag"))
[7]:
# Drop original predictor variables - we do not want to use these in the model
dai_data = dai_data.drop(lagged_data, axis=1)
dai_data = dai_data.reset_index()
[8]:
dai_data.head()
[8]:
| Date | Store | Dept | Unnamed: 0 | IsHoliday | Weekly_Sales | MarkDown1 | MarkDown2 | MarkDown3 | MarkDown4 | MarkDown5 | Type | Size | Temperature_lag | Fuel_Price_lag | CPI_lag | Unemployment_lag | |
|---|---|---|---|---|---|---|---|---|---|---|---|---|---|---|---|---|---|
| 0 | 2010-02-05 | 1 | 1.0 | 1 | False | 24924.50 | NaN | NaN | NaN | NaN | NaN | A | 151315 | NaN | NaN | NaN | NaN |
| 1 | 2010-02-05 | 1 | 26.0 | 2 | False | 11737.12 | NaN | NaN | NaN | NaN | NaN | A | 151315 | NaN | NaN | NaN | NaN |
| 2 | 2010-02-05 | 1 | 17.0 | 3 | False | 13223.76 | NaN | NaN | NaN | NaN | NaN | A | 151315 | NaN | NaN | NaN | NaN |
| 3 | 2010-02-05 | 1 | 45.0 | 4 | False | 37.44 | NaN | NaN | NaN | NaN | NaN | A | 151315 | NaN | NaN | NaN | NaN |
| 4 | 2010-02-05 | 1 | 28.0 | 5 | False | 1085.29 | NaN | NaN | NaN | NaN | NaN | A | 151315 | NaN | NaN | NaN | NaN |
이제 학습 데이터의 형식이 올바르게 지정되었으므로, 다음 주 판매량을 예측하기 위해 Driverless AI 실험을 실행할 수 있습니다.
3단계: Driverless AI에 데이터 업로드
데이터를 두 가지로 나눕니다. 학습 데이터와 테스트 데이터입니다(지난주 데이터로 구성됨).
[13]:
train_data = dai_data.loc[dai_data["Date"] < "2012-09-28"]
test_data = dai_data.loc[dai_data["Date"] == "2012-09-28"]
데이터 세트를 업로드하기 위해 Driverless AI에 로그인합니다.
[14]:
address = 'http://ip_where_driverless_is_running:12345'
username = 'username'
password = 'password'
dai = driverlessai.Client(address = address, username = username, password = password)
# make sure to use the same user name and password when signing in through the GUI
[19]:
train_path = "./train_data.csv"
test_path = "./test_data.csv"
[20]:
train_data.to_csv(train_path, index = False)
test_data.to_csv(test_path, index = False)
[21]:
# Add datasets to Driverless AI
train_data = dai.datasets.create(
    data=train_path,
    data_source='upload',
    name='walmart-example-train'
)
test_data = dai.datasets.create(
    data=test_path,
    data_source='upload',
    name='walmart-example-test'
)
Complete 100.00% - [4/4] Computing column statistics
Complete 100.00% - [4/4] Computing column statistics
Driverless의 해당 단계: 학습 및 테스트 CSV 파일 업로드
4단계: Driverless AI 실험 시작
이제 Driverless AI 실험을 시작합니다. 이를 위해 실험에 대한 매개변수를 지정해야 합니다. 매개변수에는 다음 항목이 포함됩니다.
대상 열: 예측하고자 하는 열입니다.
삭제된 열: ID 열, 데이터 유출이 있는 열 등과 같은 예측 변수로 사용하지 않는 열.
Time Series: 실험이 time series 유스케이스인지 여부 확인.
Time Column: 날짜/날짜-시간 정보가 포함된 열.
Time Group Columns: 그룹당 하나의 time series과 대응되도록 데이터를 그룹화하는 방법을 나타내는 범주형 열. 이 예에서 Time Group Column은
Store및Dept입니다.Store및Dept는 각각 하나의 time series에 대응됩니다.Number of Prediction Periods: 얼마나 먼 미래를 예측하려는지 나타내는 매개변수.
Number of Gap Periods: 얼마 후에 예측을 시작할지 나타내는 매개변수. 학습 데이터가 종료된 직후 예측을 시작할 수 있다고 가정하는 경우, gap 기간은 0이 됩니다.
이 실험에서는 Store 및 Dept 각각에 대한 다음 주 매출을 예측하려고 합니다. 따라서 다음 time series 매개변수를 사용합니다.
Time Group Columns:
[Store, Dept]Number of Prediction Periods: 1 (a.k.a., horizon)
Number of Gap Periods: 0
Python client에서는 기간(period) 크기를 알 수 없습니다. 이를 극복하기 위해, 선택적 매개변수인 time_period_in_seconds 를 지정하면, 실시간으로 horizon을 지정할 수 있습니다. 이 매개변수를 생략하면, Driverless AI는 실험의 기간 크기를 자동으로 감지하고 horizon 값은 이 기간을 따릅니다. 즉, 확실하게 데이터의 기간이 1주일이라면, num_prediction_periods=14 이라고 할 수 있으며, 그렇지 않을 경우 모델이 올바르게 작동하지 않을 수 있습니다.
[22]:
experiment = dai.experiments.create(name='walmart_time_series',
                                    test_dataset=test_data,
                                    train_dataset=train_data,
                                    task='regression',
                                    target_column='Weekly_Sales',
                                    drop_columns=['sample_weight'],
                                    time_column= 'Date',
                                    scorer='RMSE',
                                    accuracy=5,
                                    time=3,
                                    interpretability=5,
                                    num_prediction_periods=1,
                                    num_gap_periods=0,
                                    time_groups_columns = ['Store', 'Dept'],
                                    seed=1234)
Experiment launched at: http://localhost:12345/#experiment?key=9f376088-408b-11eb-b9de-0242ac110002
Complete 100.00% - Status: Complete
Driverless의 동일한 단계: Driverless AI 실험 시작
5단계: 모델 성능 평가
실험이 완료되면 실험 객체 내에서 모델 성능 메트릭을 볼 수 있습니다.
[23]:
metrics = experiment.metrics()
print("Validation RMSE: ${:,.0f}".format(metrics['val_score']))
print("Test RMSE: ${:,.0f}".format(metrics['test_score']))
Validation RMSE: $2,425
Test RMSE: $2,084
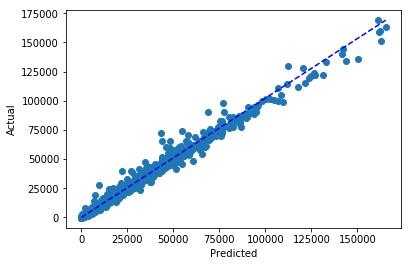
테스트 데이터로 실제값과 예측값을 플로팅할 수도 있습니다.
[25]:
target="Weekly_Sales"
prediction = experiment.predict(test_data, [target])
path = prediction.download('')

forecast_predictions = pd.read_csv(path)
forecast_predictions.head()
Complete
Downloaded '9f376088-408b-11eb-b9de-0242ac110002_preds_f6e2264e.csv'
[25]:
| Weekly_Sales | Weekly_Sales.predicted | |
|---|---|---|
| 0 | 14734.64 | 12660.375000 |
| 1 | 1163.75 | 1384.219238 |
| 2 | 1773.32 | 1579.065430 |
| 3 | 27205.40 | 29764.876953 |
| 4 | 4390.19 | 4197.859863 |
[26]:
plt.scatter(forecast_predictions['Weekly_Sales.predicted'], forecast_predictions['Weekly_Sales'])
plt.plot([0, max(forecast_predictions['Weekly_Sales.predicted'])],[0, max(forecast_predictions['Weekly_Sales'])], 'b--',)
plt.xlabel("Predicted")
plt.ylabel("Actual")
plt.show()

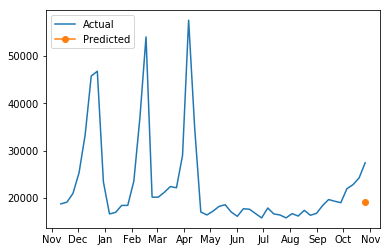
마지막으로, Driverless AI에서 테스트 예측을 다운로드하여 선택한 매장 및 부서의 예상 매출과 실제 매출을 검토할 수 있습니다.
[28]:
test_data = pd.read_csv('./test_data.csv')
selected_ts = sales_data.loc[(sales_data["Store"] == 1) & (sales_data["Dept"] == 1)].tail(n = 51)

selected_ts_forecast = forecast_predictions.loc[(test_data["Store"] == 1) &
                                                (test_data["Dept"] == 1)]
[29]:
# Plot the forecast of a select store and department
years = mdates.MonthLocator()
yearsFmt = mdates.DateFormatter('%b')

fig, ax = plt.subplots()

ax.plot(selected_ts["Date"], selected_ts["Weekly_Sales"], label = "Actual")
ax.plot(selected_ts["Date"].iloc[-1], selected_ts_forecast["Weekly_Sales.predicted"], marker='o', label = "Predicted")

ax.xaxis.set_major_locator(years)
ax.xaxis.set_major_formatter(yearsFmt)
plt.legend(loc='upper left')
plt.show()

[ ]: