Model monitoring (preview)
As of version 0.57.3, you can view monitoring dashboards for deployments directly through H2O MLOps. This page describes how to access and use the built-in model monitoring features of H2O MLOps.
- Model monitoring in H2O MLOps currently only supports Single Model deployments.
- Model monitoring isn't available for image models.
- Batch deployments cannot currently be monitored.
- Newly created deployments may take up to five minutes to appear in the list of monitored deployments.
Access Model Monitoring
The instructions for accessing Model Monitoring differ depending on whether you created a given deployment. This section describes how to access Model Monitoring for deployments you have created and those you didn't create but have access to.
Deployments you have created
To view Model Monitoring for deployments that you have created, click Model Monitoring in the navigation menu. The Model Monitoring page containing a list of deployments you have created across all projects is displayed.
Deployments you didn't create but have access to
To view Model Monitoring for deployments you didn't create but have access to, click Projects in the navigation menu, and then select the project that contains the deployment you want to view monitoring information for. On the Project page, click the Deployments tab, and then click the name of a specific deployment to open the Deployment Overview panel. Finally, click View Monitoring to view a monitoring page that is specific to that deployment.
Monitoring overview page
The Monitoring overview page lets you view the following general information:
-
No. of Deployments. The total number of deployments that you have created.
-
Total Predictions. The total number of predictions that have been generated by deployments you have created.
-
A list of all the deployments that you have created. Each entry in this list can be expanded to view additional details about a specific deployment by clicking the > arrow. Expanded entries can be collapsed to hide additional details for a specific deployment. To collapse all entries in the list, click Reset Table.
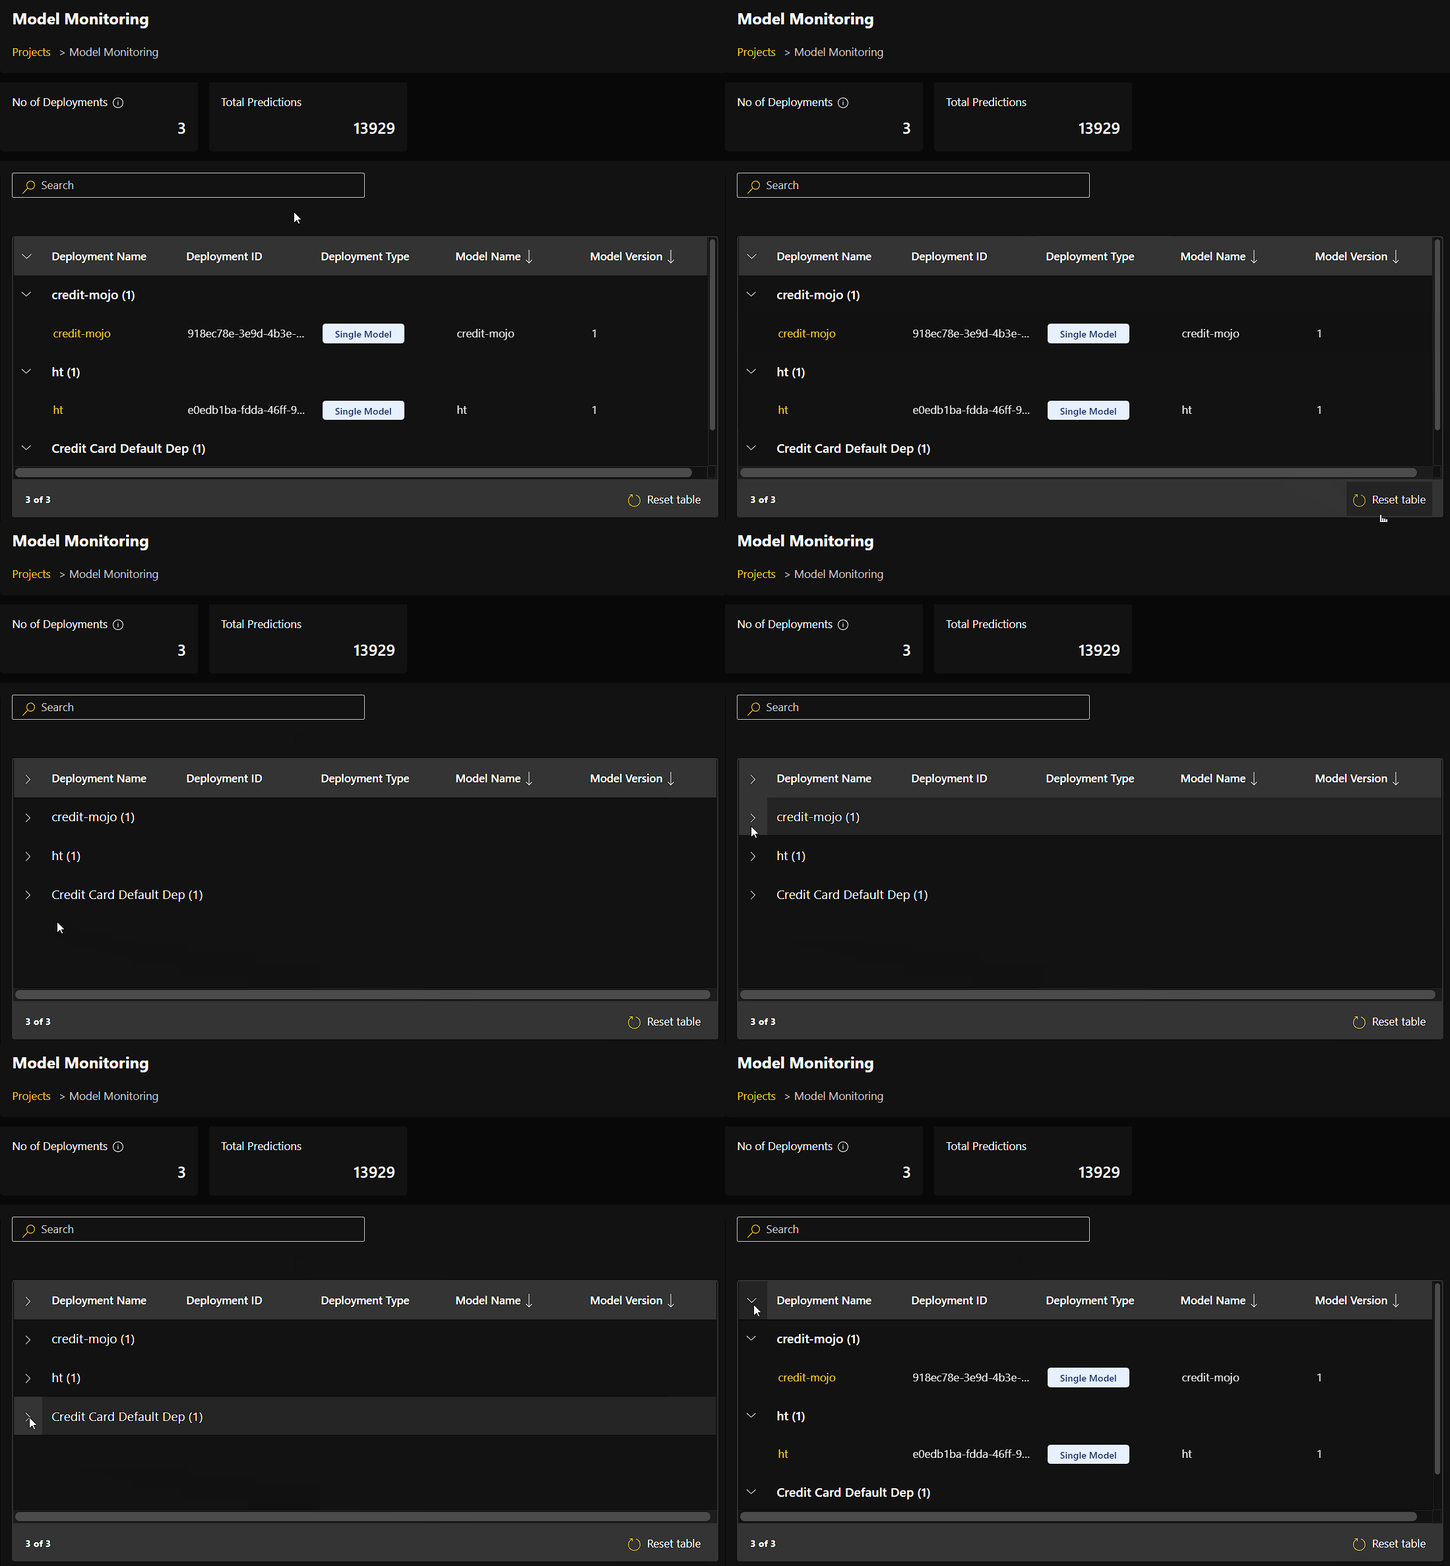
For each deployment in the list, the following details are provided:
-
Deployment name. To view monitoring information that is specific to a given deployment, click the name of the deployment that you want to view monitoring information for.
-
Deployment ID
-
Deployment type
-
Model name
-
Model version
-
Newly scored records may take up to five minutes to be displayed on the monitoring overview page.
Deployment-specific monitoring page
H2O MLOps provides monitoring details for specific deployments that you have either created yourself or have access to. To view monitoring information that is specific to a given deployment listed on the Monitoring overview page, click the name of the deployment you want to view monitoring information for.
If a deployment's entry in the list of deployments is collapsed, then the link to that deployment's monitoring page is not visible until the entry is expanded.
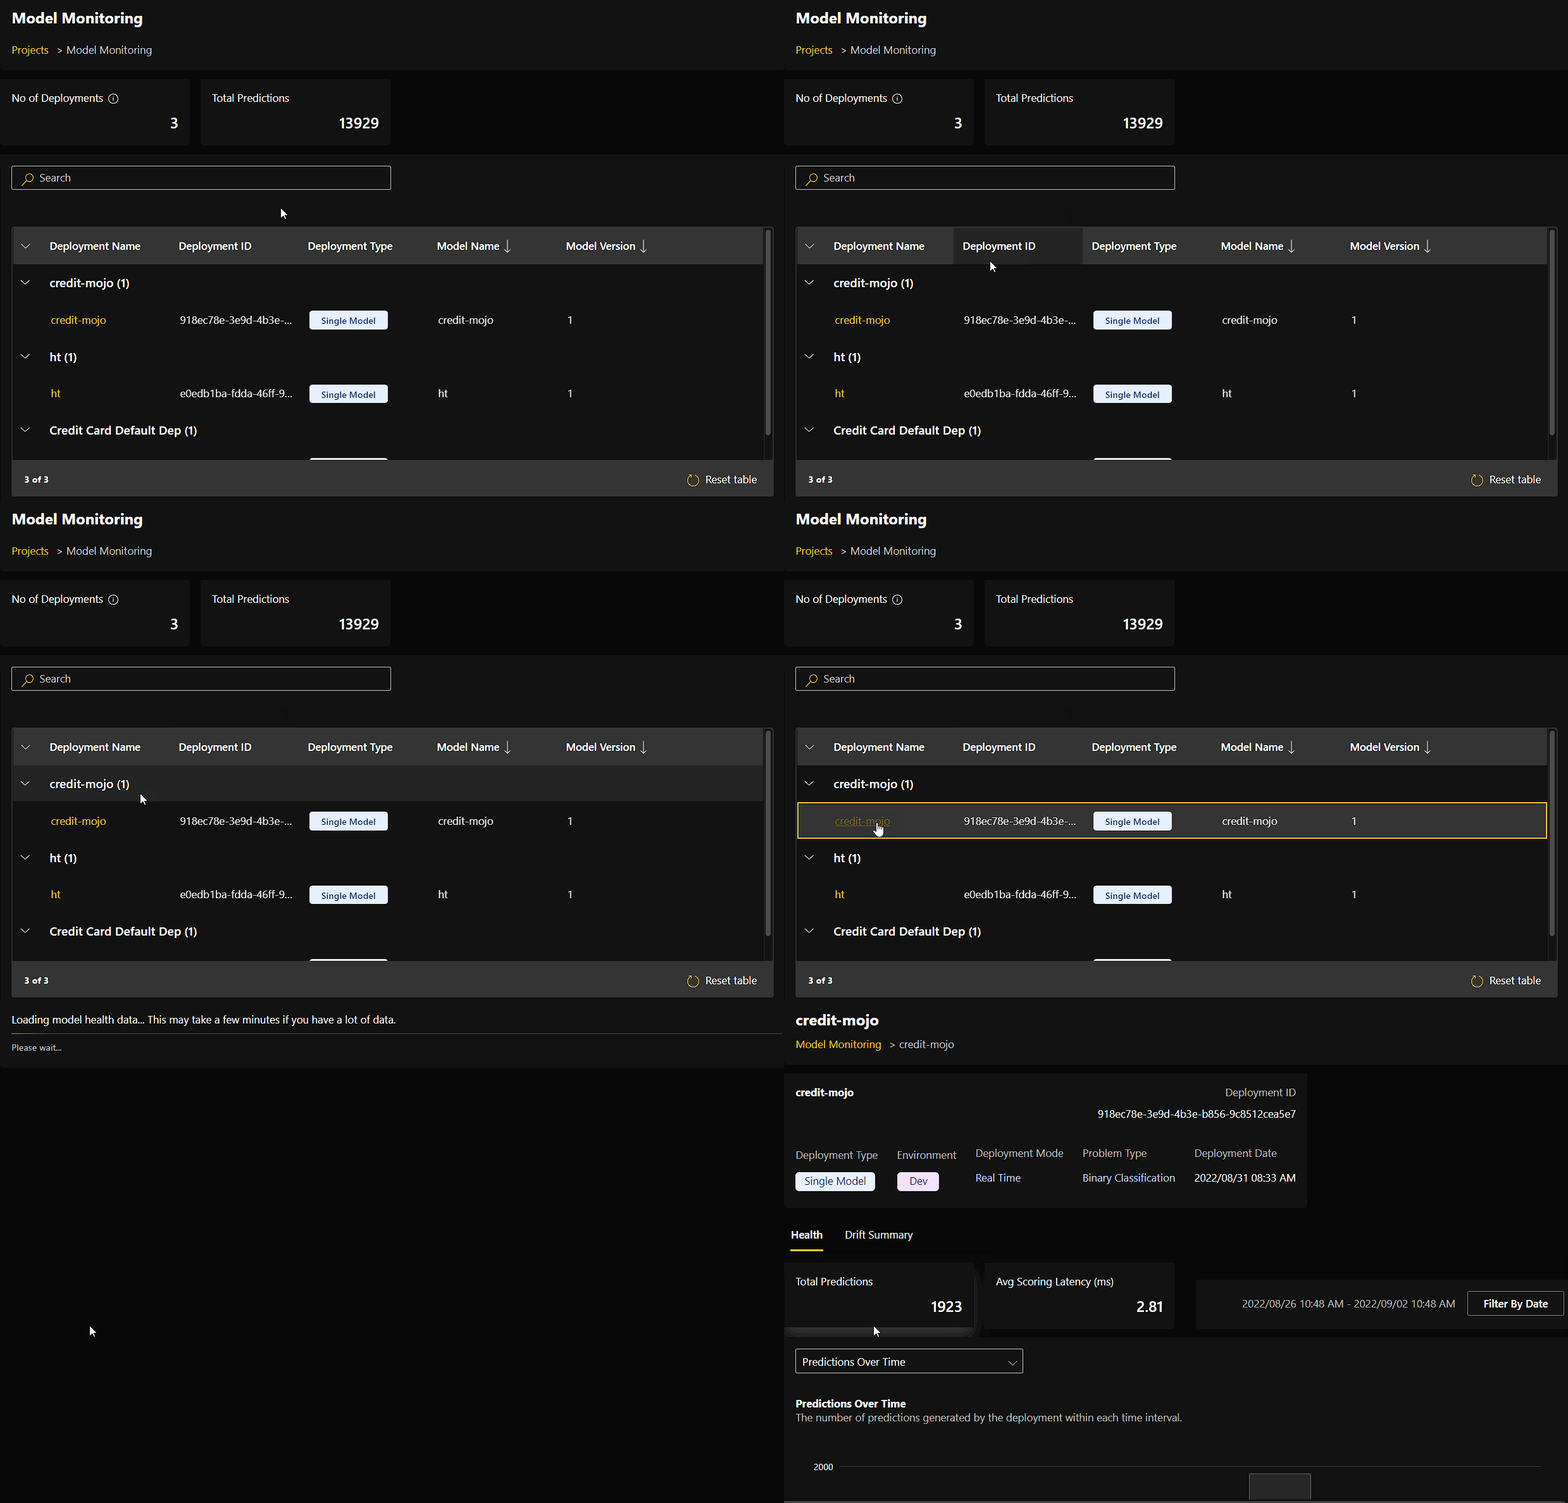
To view deployment-specific monitoring information for deployments that you didn't create but have access to, follow the instructions described in the Accessing Model Monitoring section. The deployment-specific monitoring page contains the following information:
-
Deployment name (if one has been specified)
-
Deployment ID
-
Deployment type
-
Environment
-
Deployment mode
-
Problem type
-
Deployment date
In addition to the preceding information, the deployment-specific monitoring page also provides information on model health and feature drift. For more information, refer to the following subsections:
Model health tab
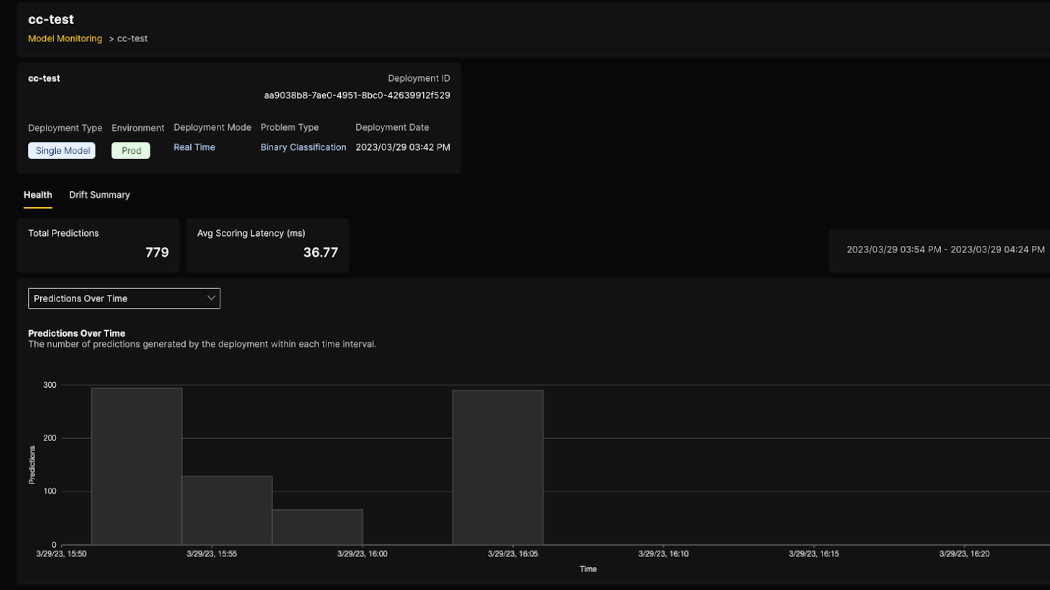
The model health tab provides the following information about the deployed model's health:
-
Total Predictions. The total number of predictions generated by the deployment within the specified date range.
-
Avg Scoring Latency (ms). The average scoring latency in milliseconds of the deployment within the specified date range.
-
Predictions Over Time. The number of predictions generated by the deployment in each time interval for the filtered date range. To view a box plot of all predictions values generated by a deployment within each time interval, click the drop-down and select Prediction Values Over Time. You can hover over a box plot to view values for each quartile in the following format: min value - 1st quartile - 2nd quartile - 3rd quartile - max value.
Prediction values over time is currently only supported for regression problem types. Support for classification problem types is coming soon.
Feature drift summary tab
The Drift Summary tab contains the following plots. Note that a minimum of 200 scoring records are required to calculate the drift score of a feature.
-
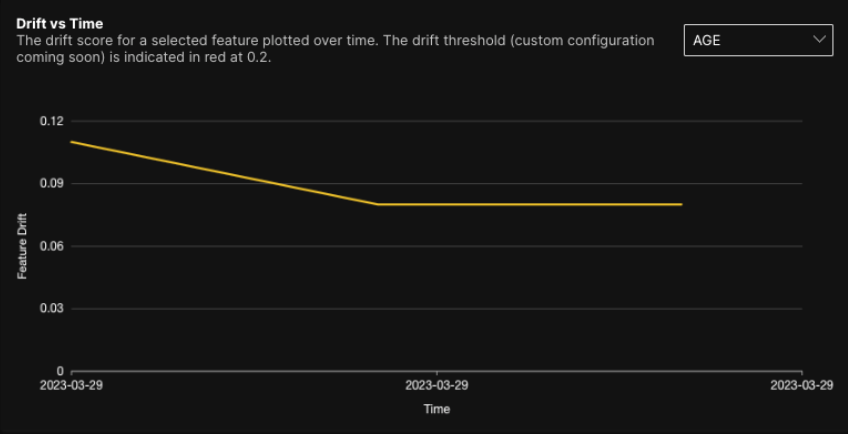
Drift vs Time. This plot displays the drift of a feature across a specified time range. You can use the drop-down selection to specify a feature to view drift information for.
-
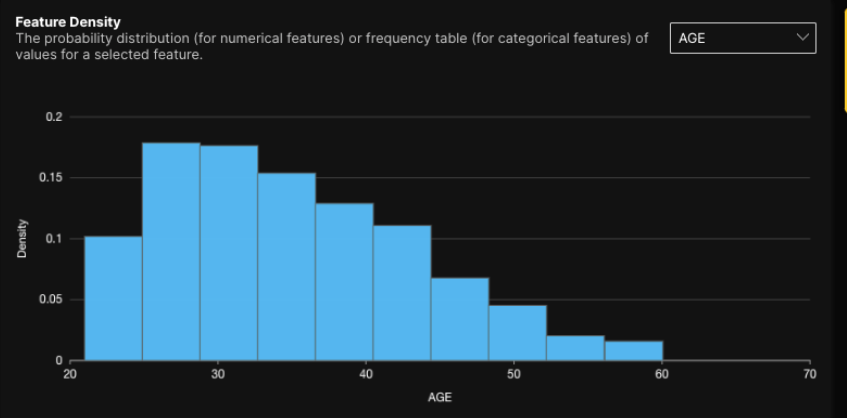
Feature Density. This plot displays the probability distribution of feature values for a feature within a specific time range. You can use the drop-down selection to specify a feature to view drift information for. Note that if a user selects a feature with categorical values, then a Feature Frequency table is displayed instead of the Feature Density plot.
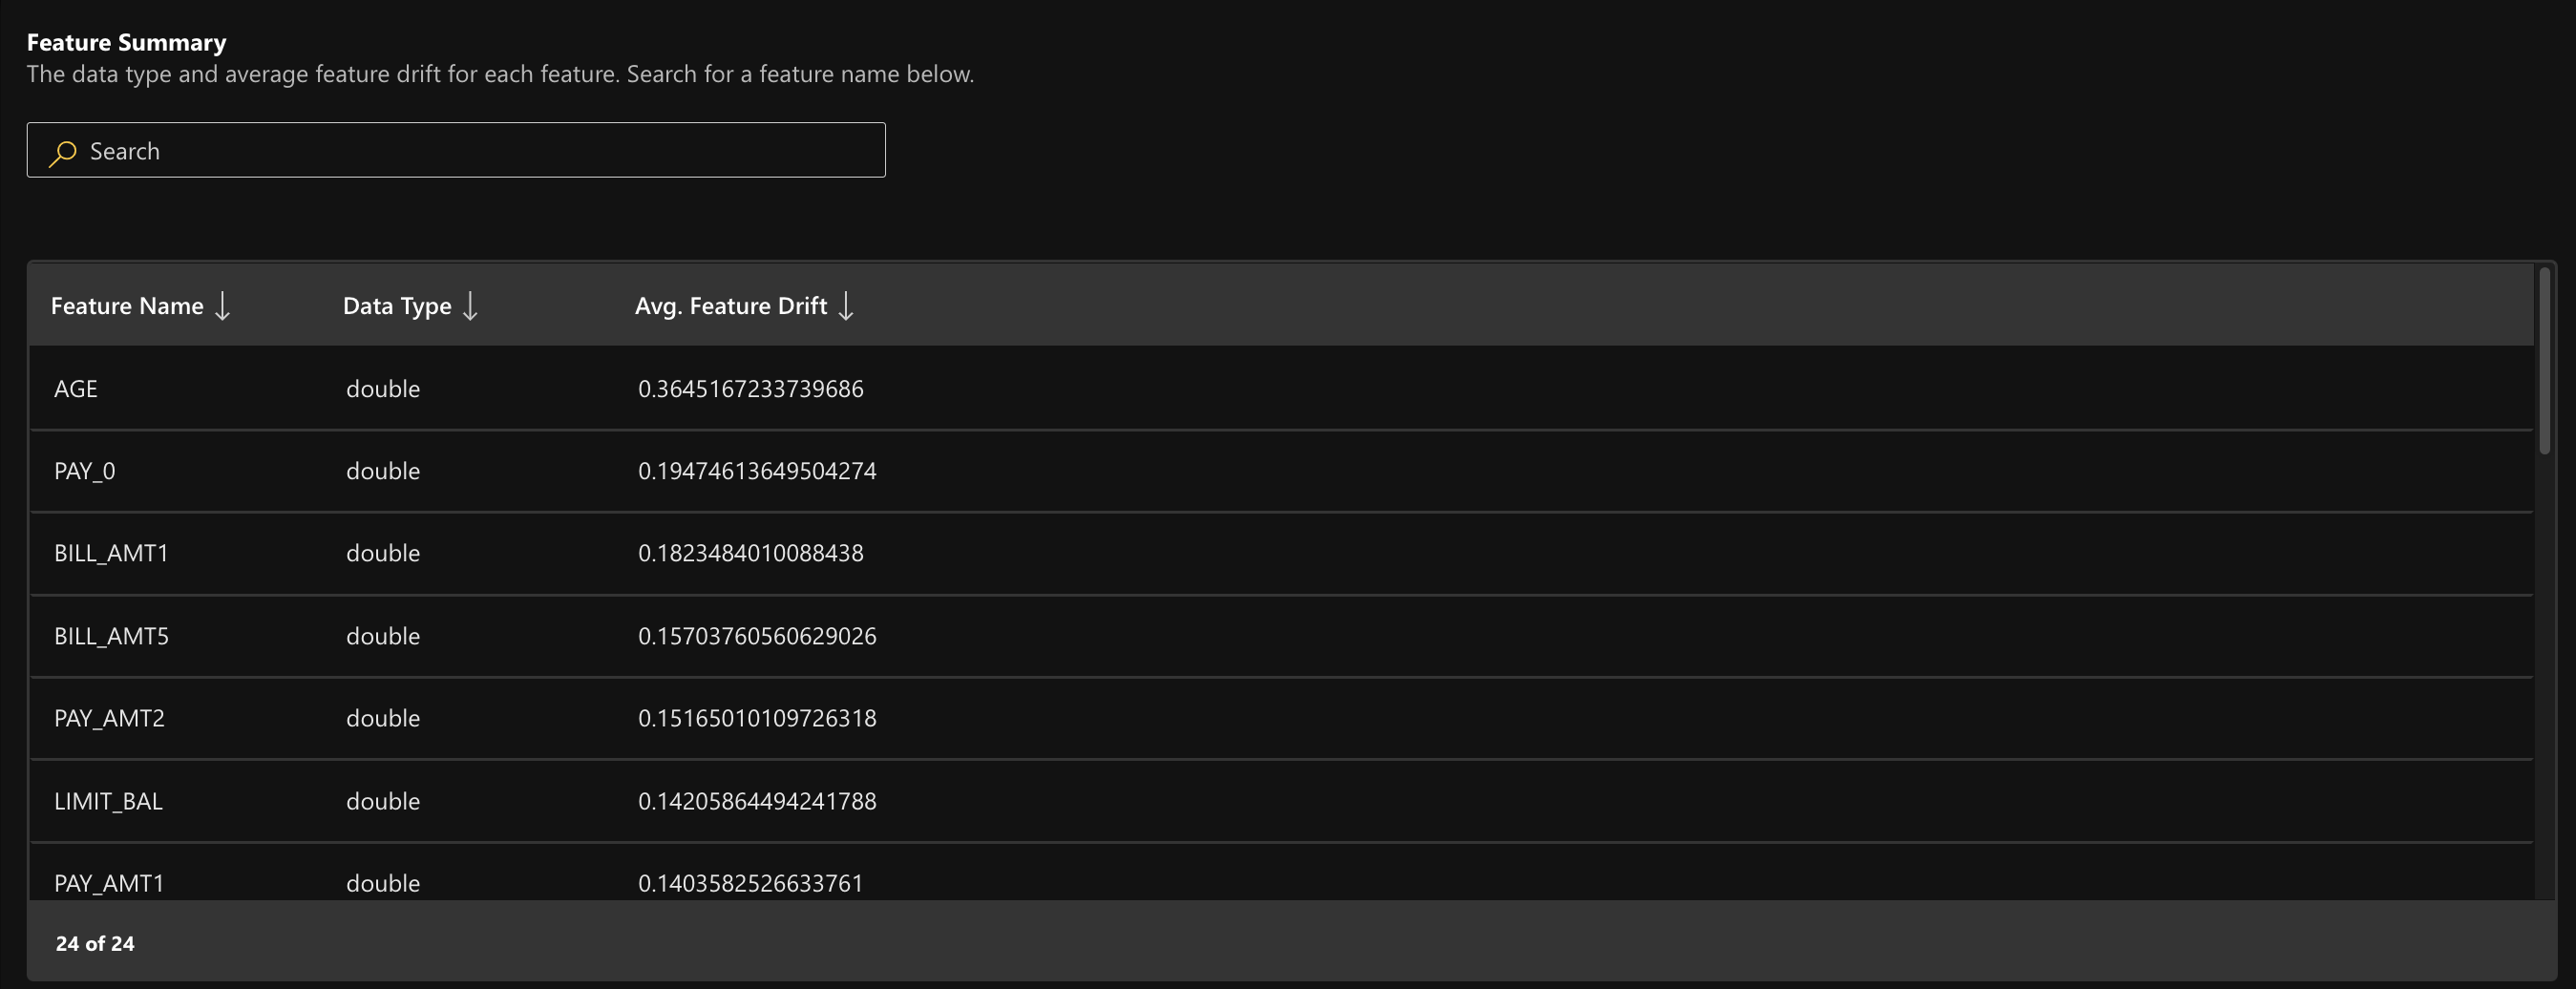
In addition to the preceding plots, the Drift Summary tab also contains a Feature Summary table that lets you view the following information about the features associated with the model:
-
Feature name
-
Data type
-
Feature drift
For more information on drift detection in H2O MLOps, see the Key terms page.
Filtering plots by date and time
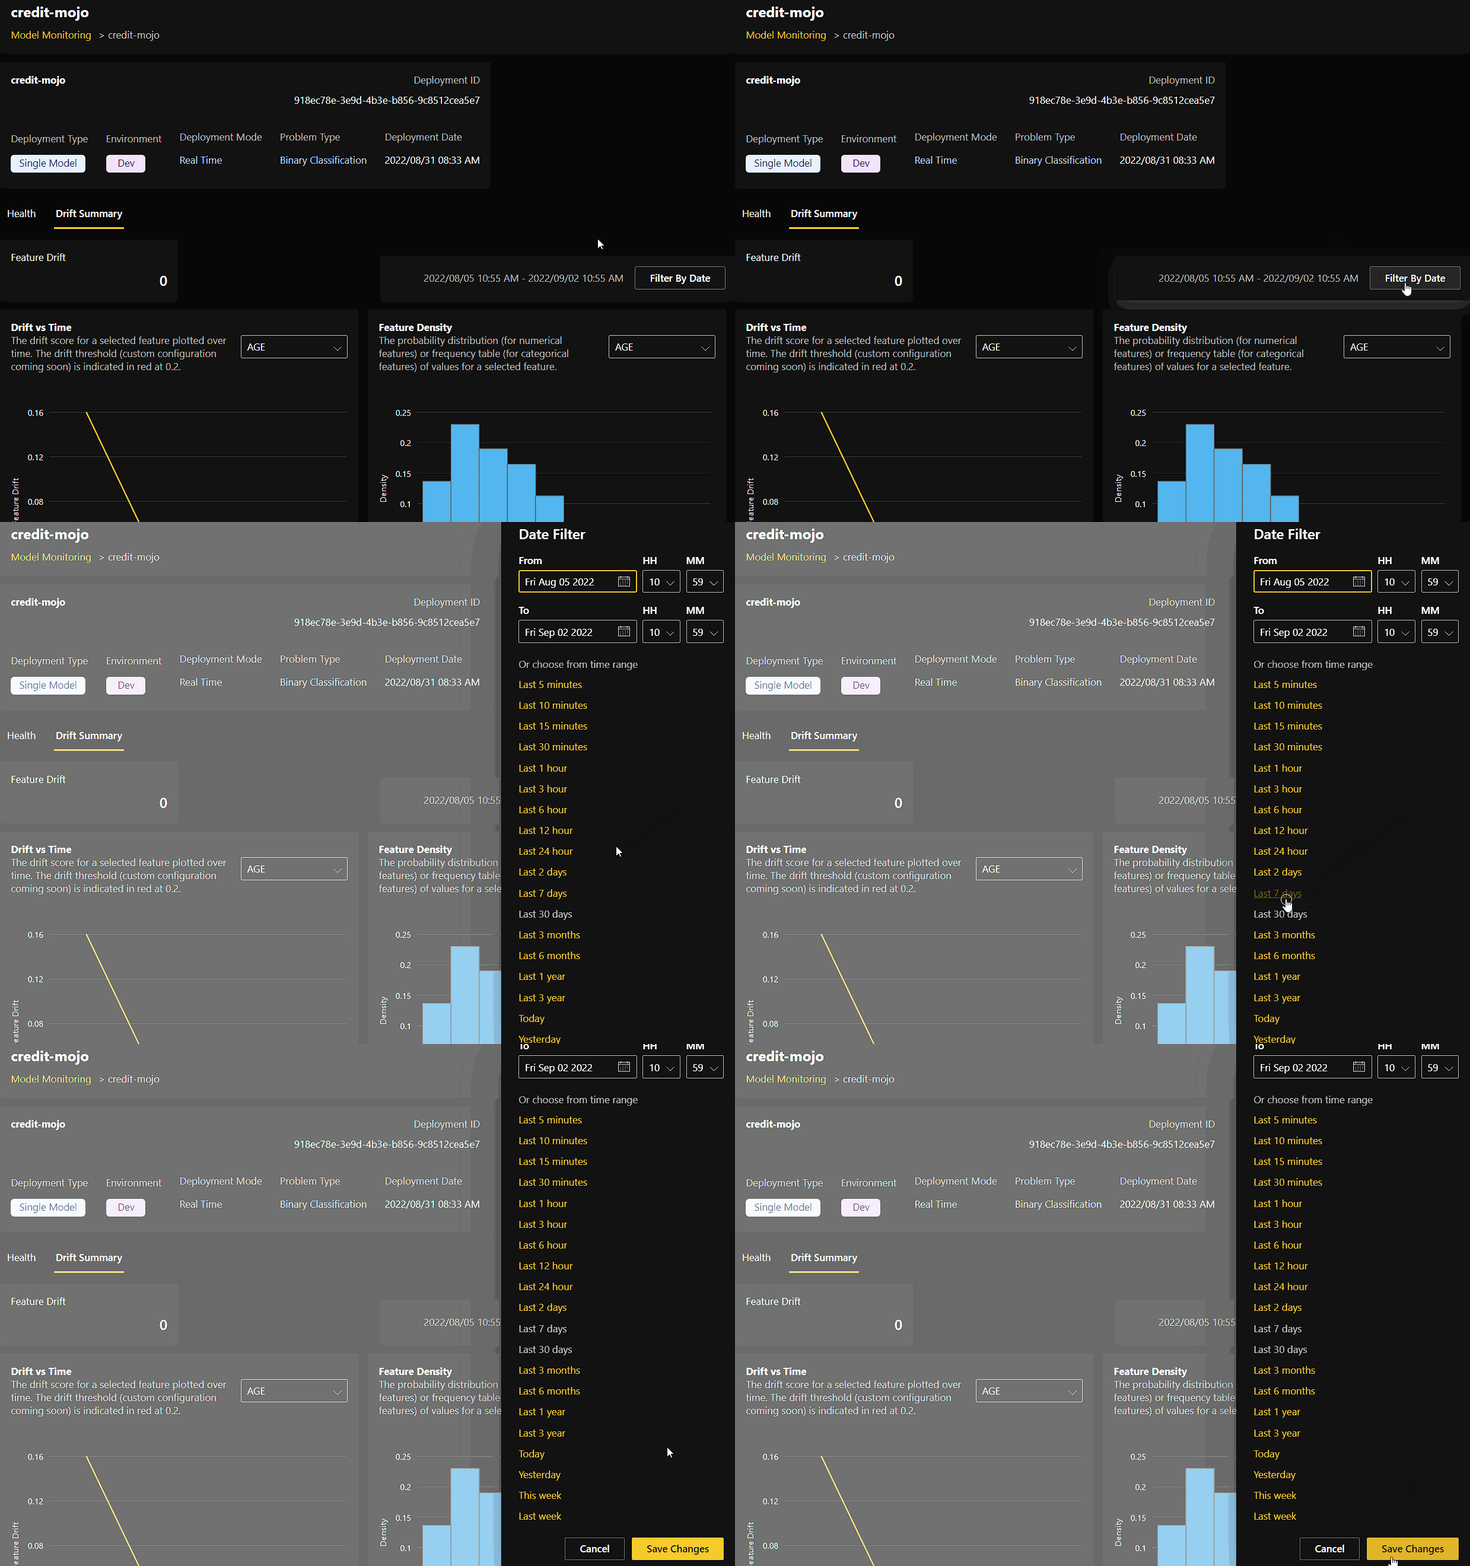
When viewing monitoring information in H2O MLOps, you can specify date and time filters that are applied to all of the available monitoring plots by clicking the Filter by Date button. Choose one of the following methods for specifying a range of dates and times:
-
Manually specify a range of dates and times to filter monitoring plots by. Note that the 24-hour clock is used for specifying the set of hours. Click Save to confirm your selection.
-
Select a preset time range to filter monitoring plots by. Click Save to confirm your selection.
Up to 100,000 scoring records are considered in each plot. If the selected time range contains more than 100,000 records, then the last 100,000 rows of scoring data are displayed.
- Submit and view feedback for this page
- Send feedback about H2O MLOps to cloud-feedback@h2o.ai