Dashboard
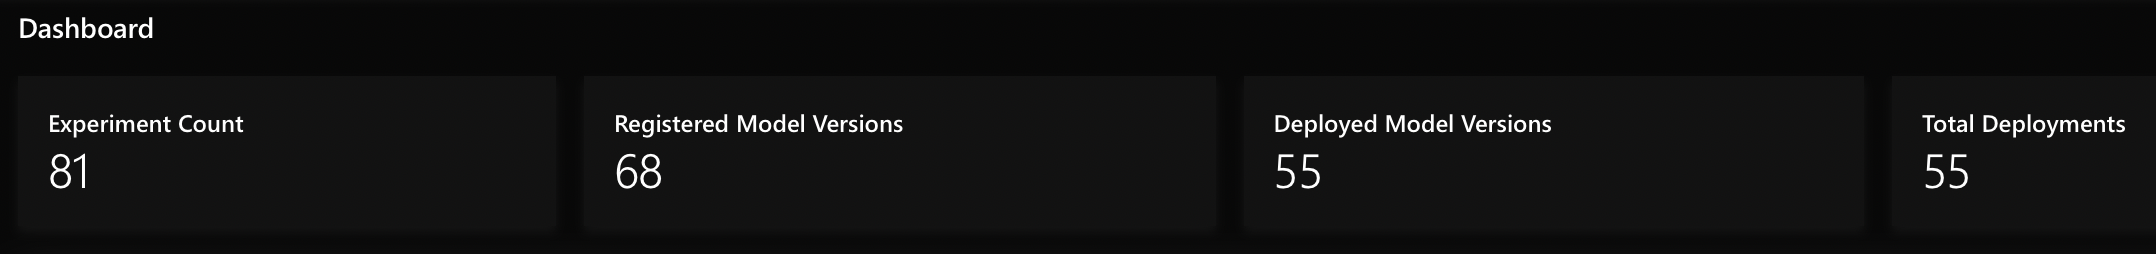
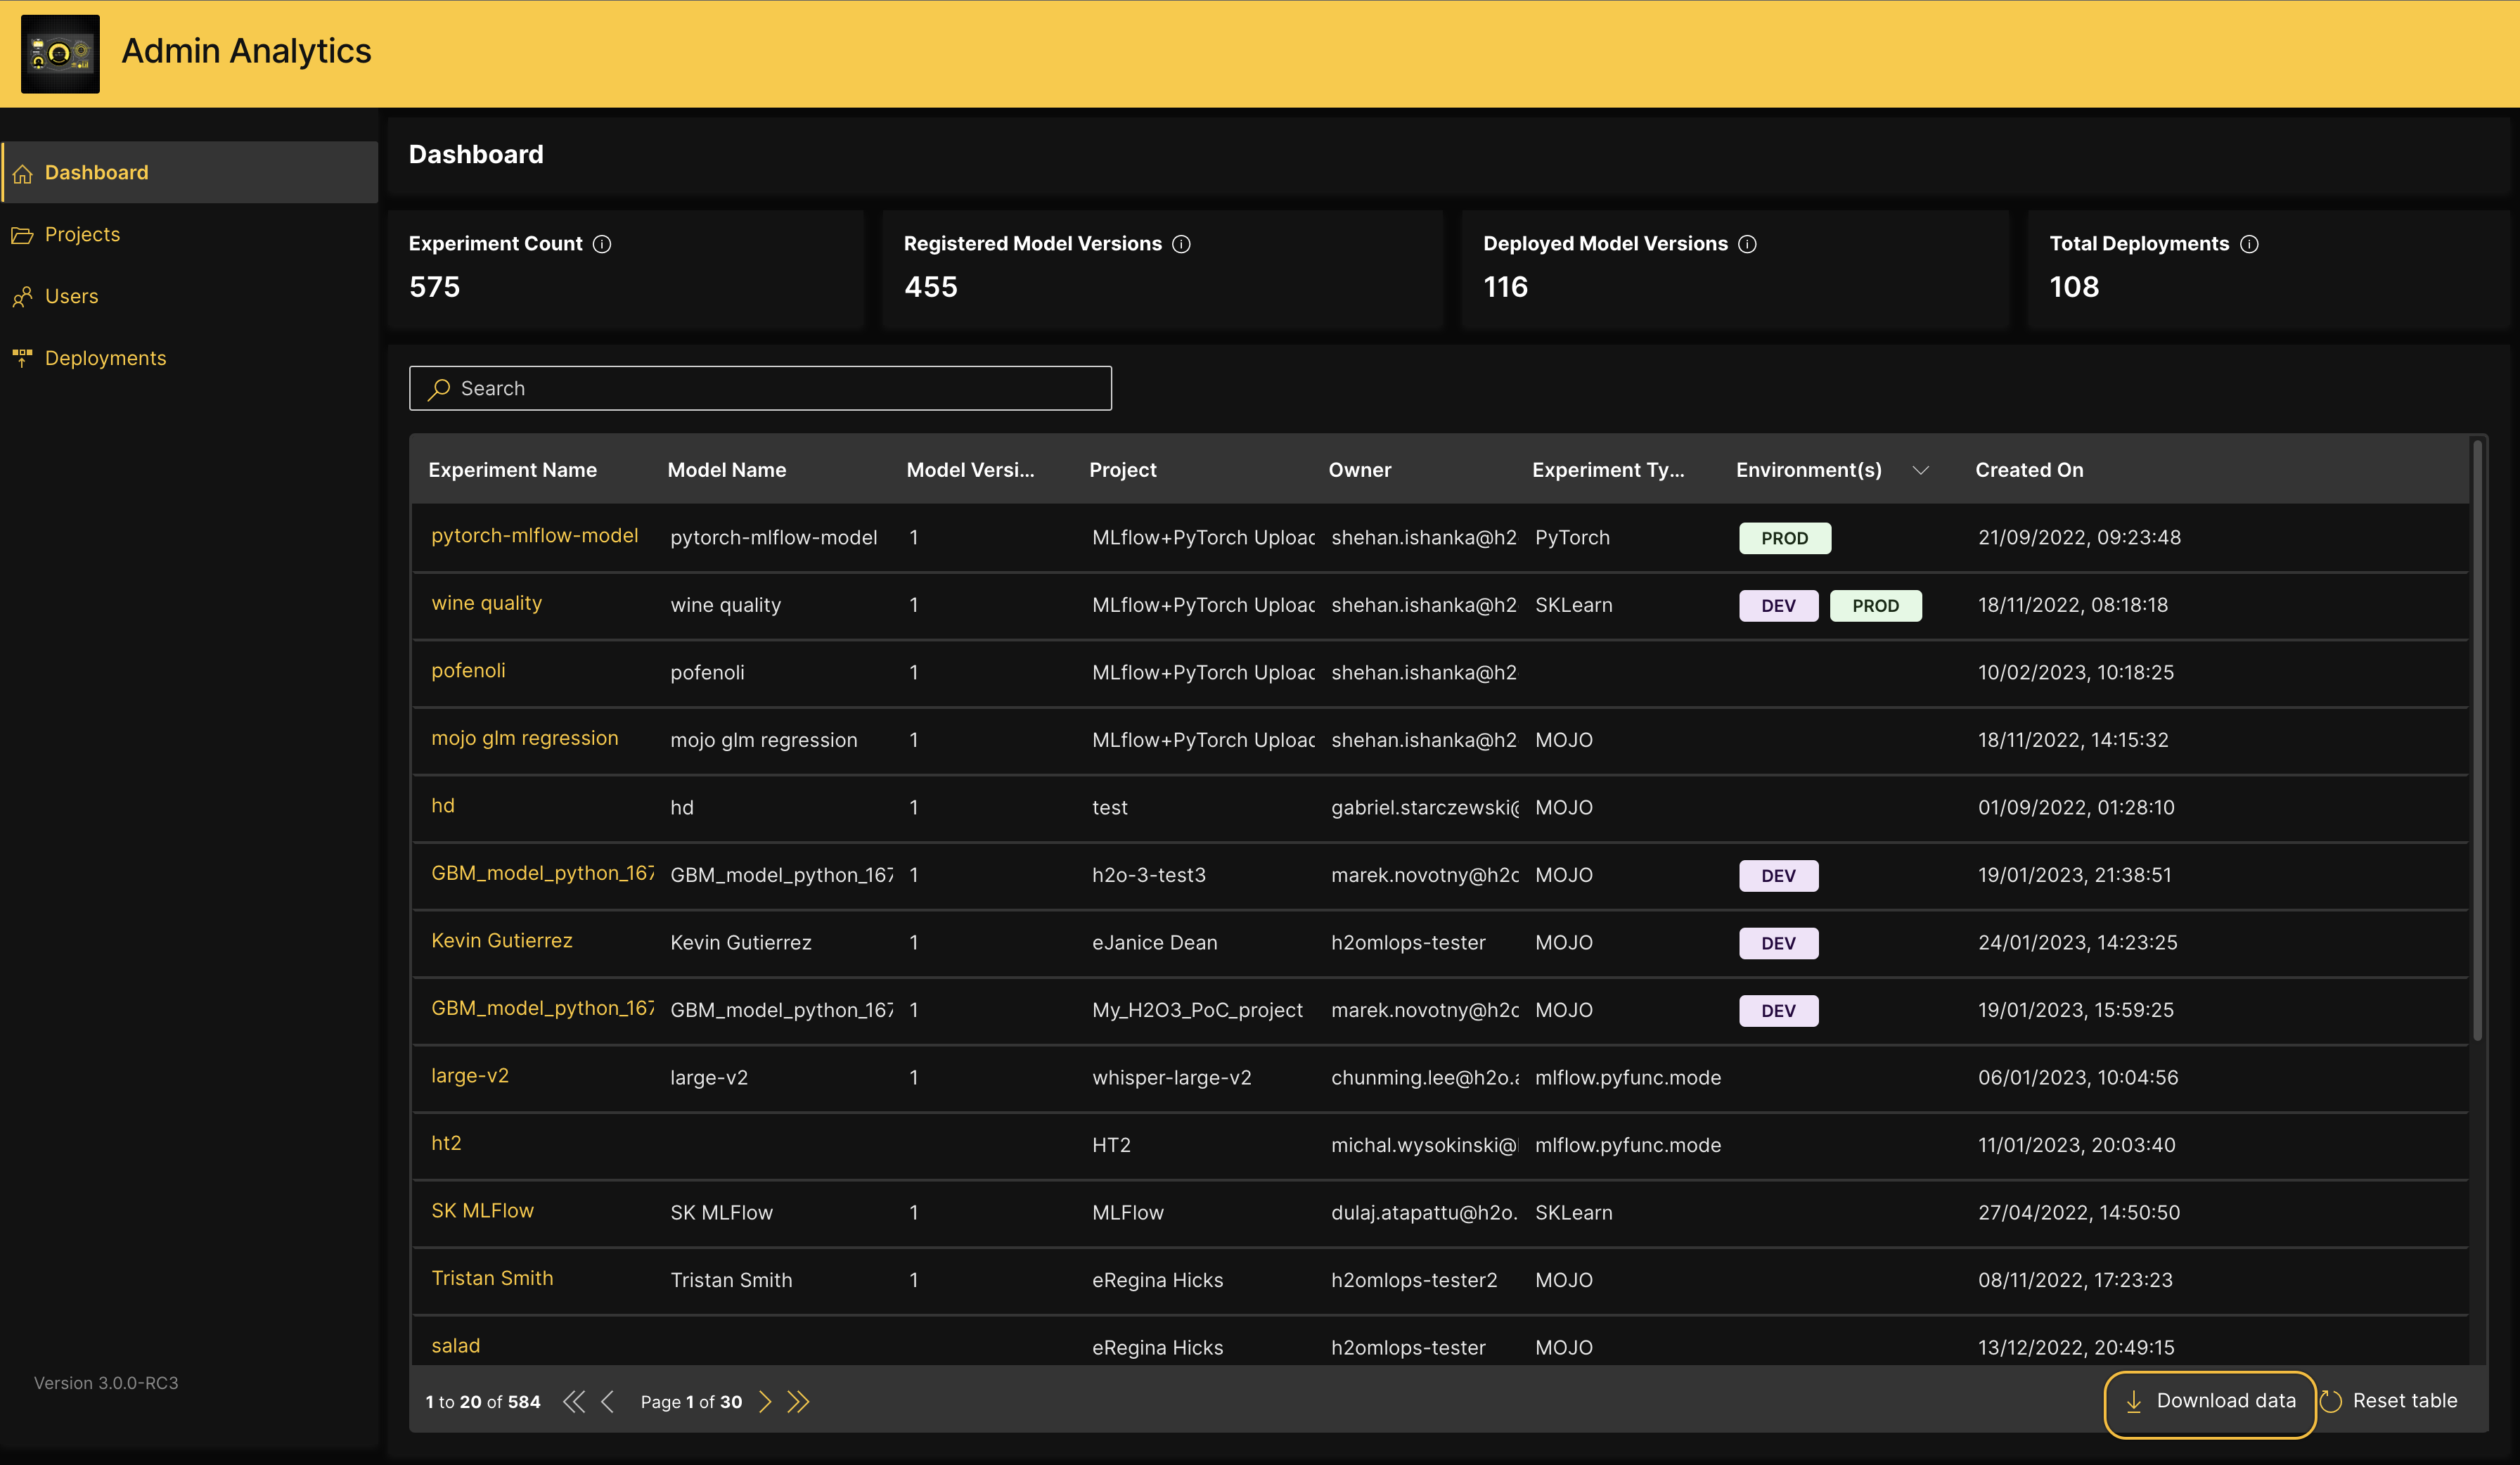
In H2O Admin Analytics, the Dashboard page provides complete end-to-end visibility of H2O MLOps usage within your organization by displaying the following information:
- Experiment Count: The number of experiments associated with the project.
- Registered Model Versions: The number of registered model versions associated with the project.
- Deployed Model Versions: The total number of unique model versions that have been deployed. For example, if two unique model versions are used in an A/B deployment, the value displayed on the Dashboard for this field is 2.
- Total Deployments: The total number of deployments associated with the MLOps runtime. Note that this value does not factor in each deployed unique model version as being a single deployment. That is, if three unique model versions are used in an A/B deployment, the value displayed on the Dashboard for this field is 1.
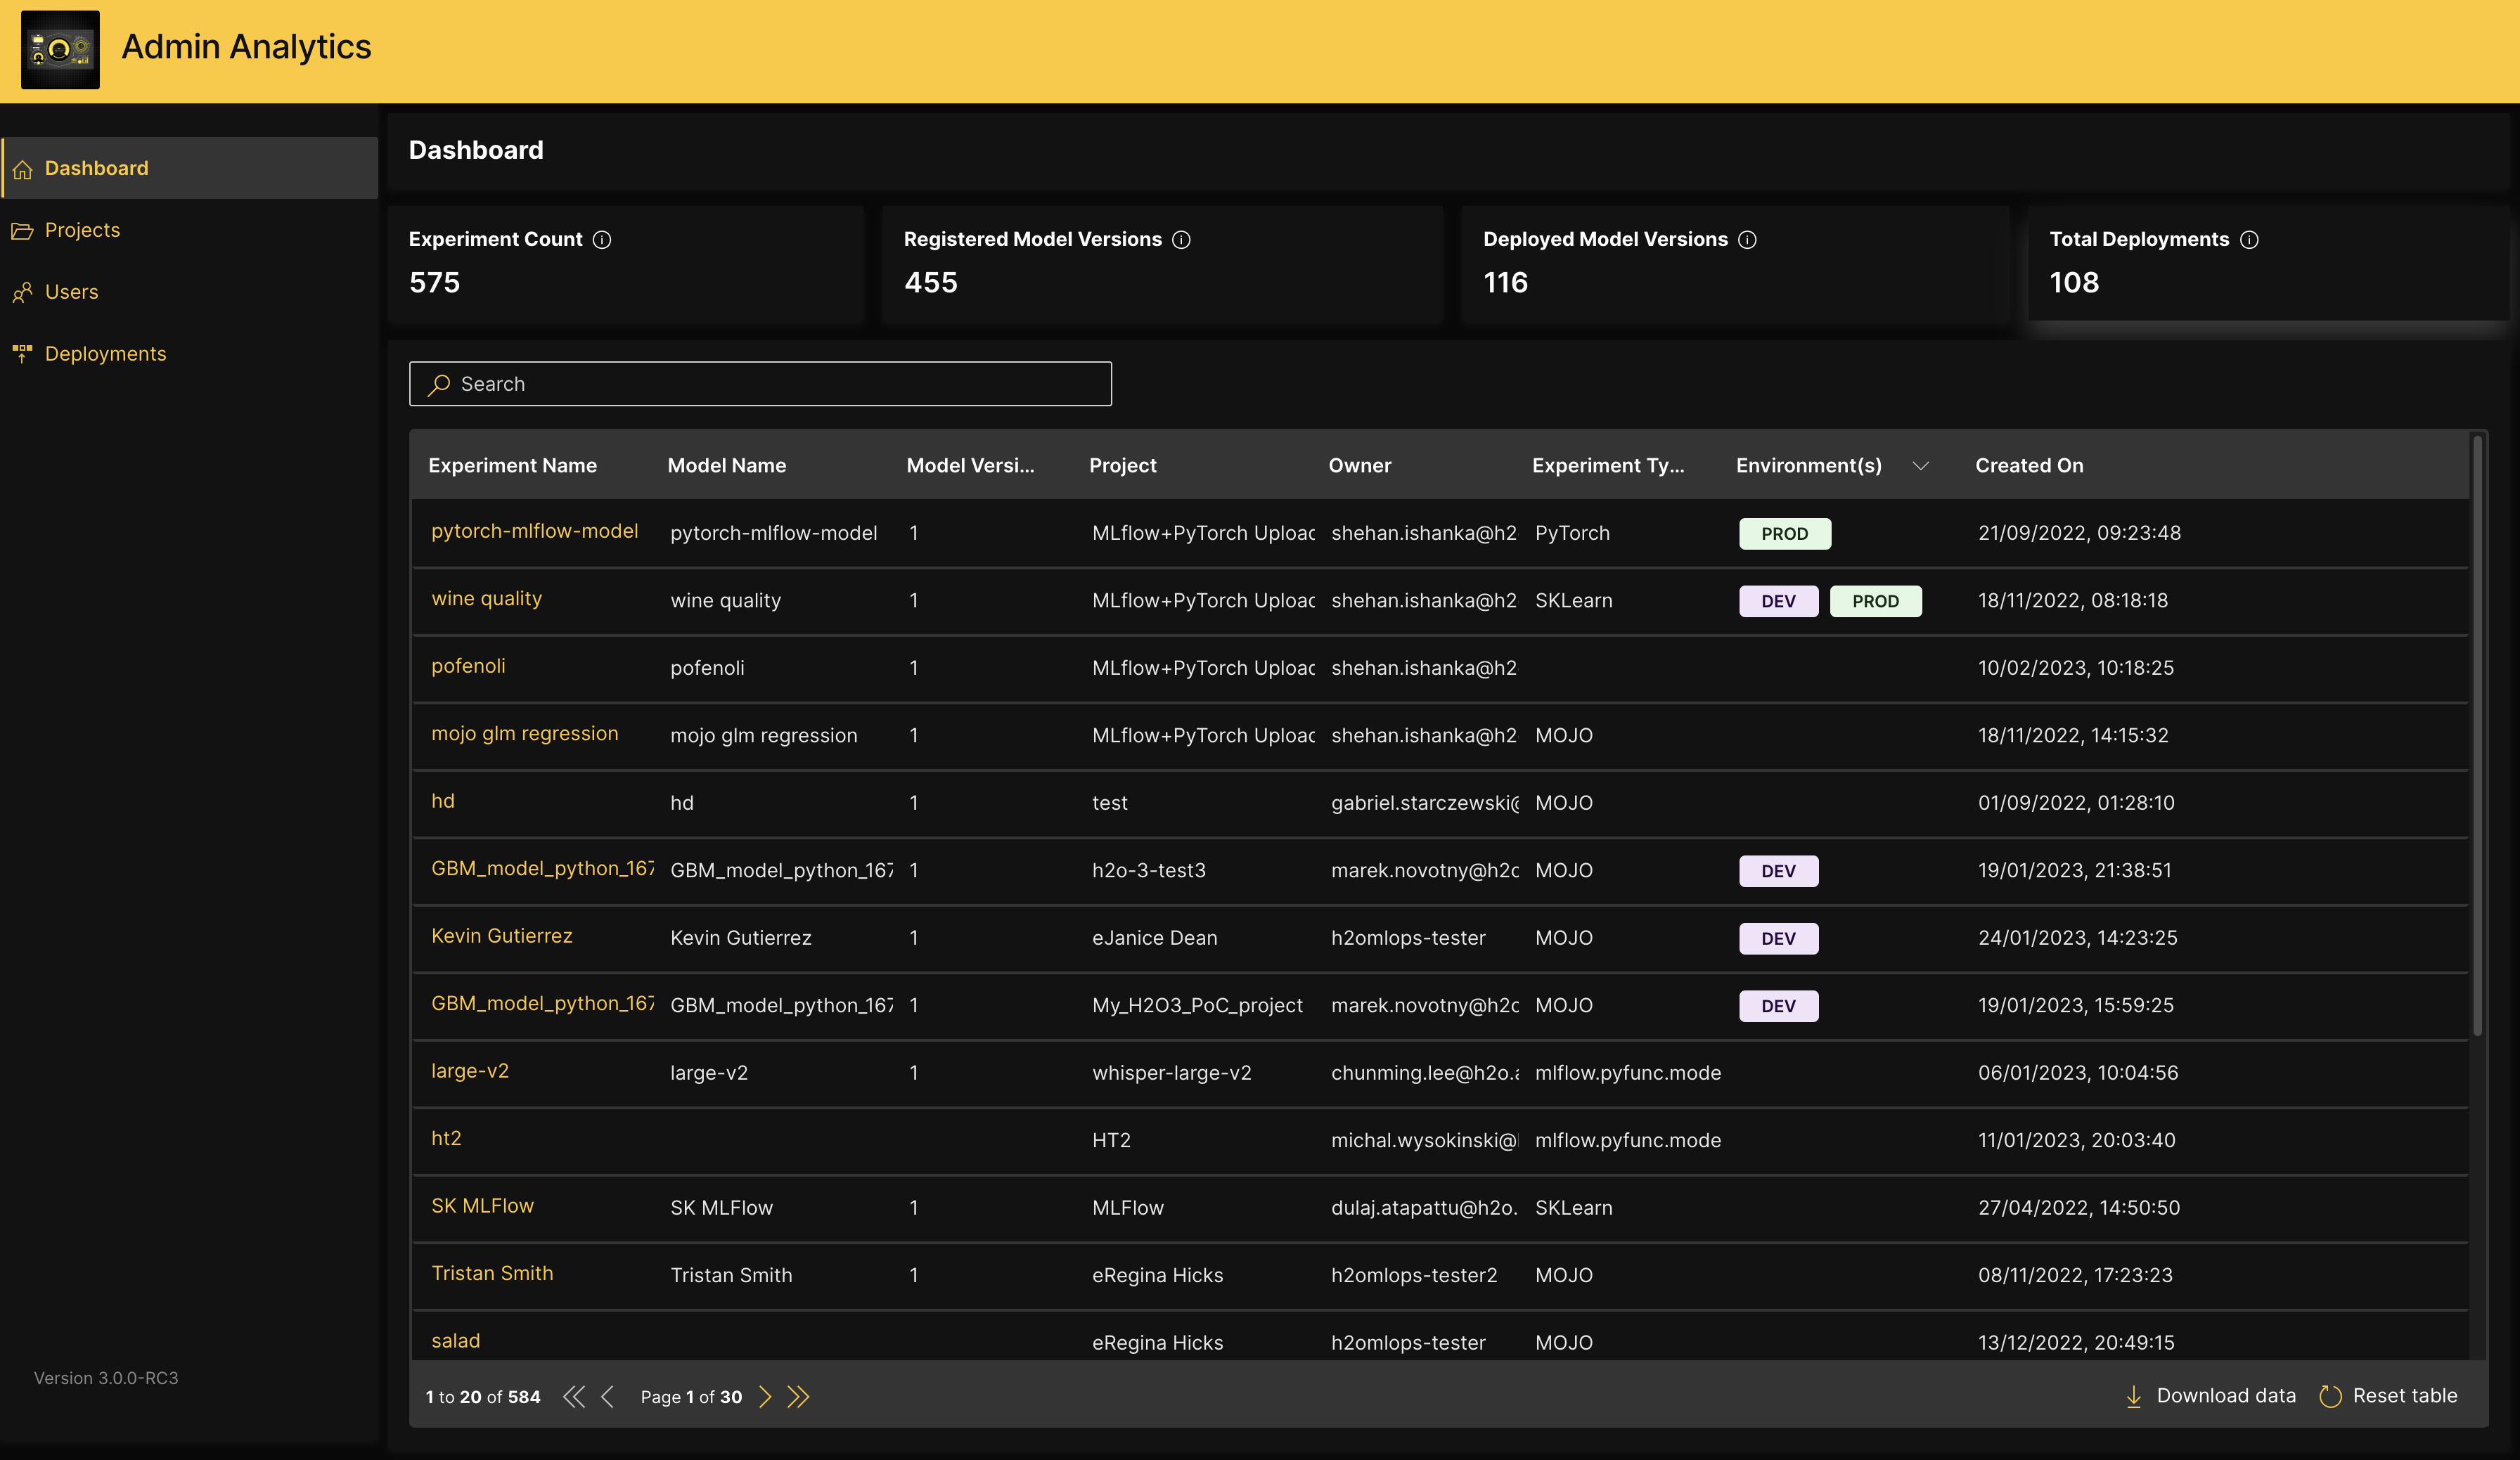
The Dashboard page also contains a table that lists all experiments in H2O MLOps, including unregistered experiments, experiments that have been registered as models, and experiments with multiple model versions. You can use the search box to filter the contents of the table based on the text you enter. For example, you can search by experiment name, model name, project name, or owner. For all of the experiments listed in this table, the following information is provided:
- Experiment Name: The name of the experiment
- Model Name: When applicable, the model name
- Model version: When applicable, the model version
- Project: The name of the project that contains the experiment
- Owner: The owner of the experiment
- Experiment Type: The experiment type
- Environment(s): When applicable, the environment selected for deployment
- Created On: The creation date of the experiment
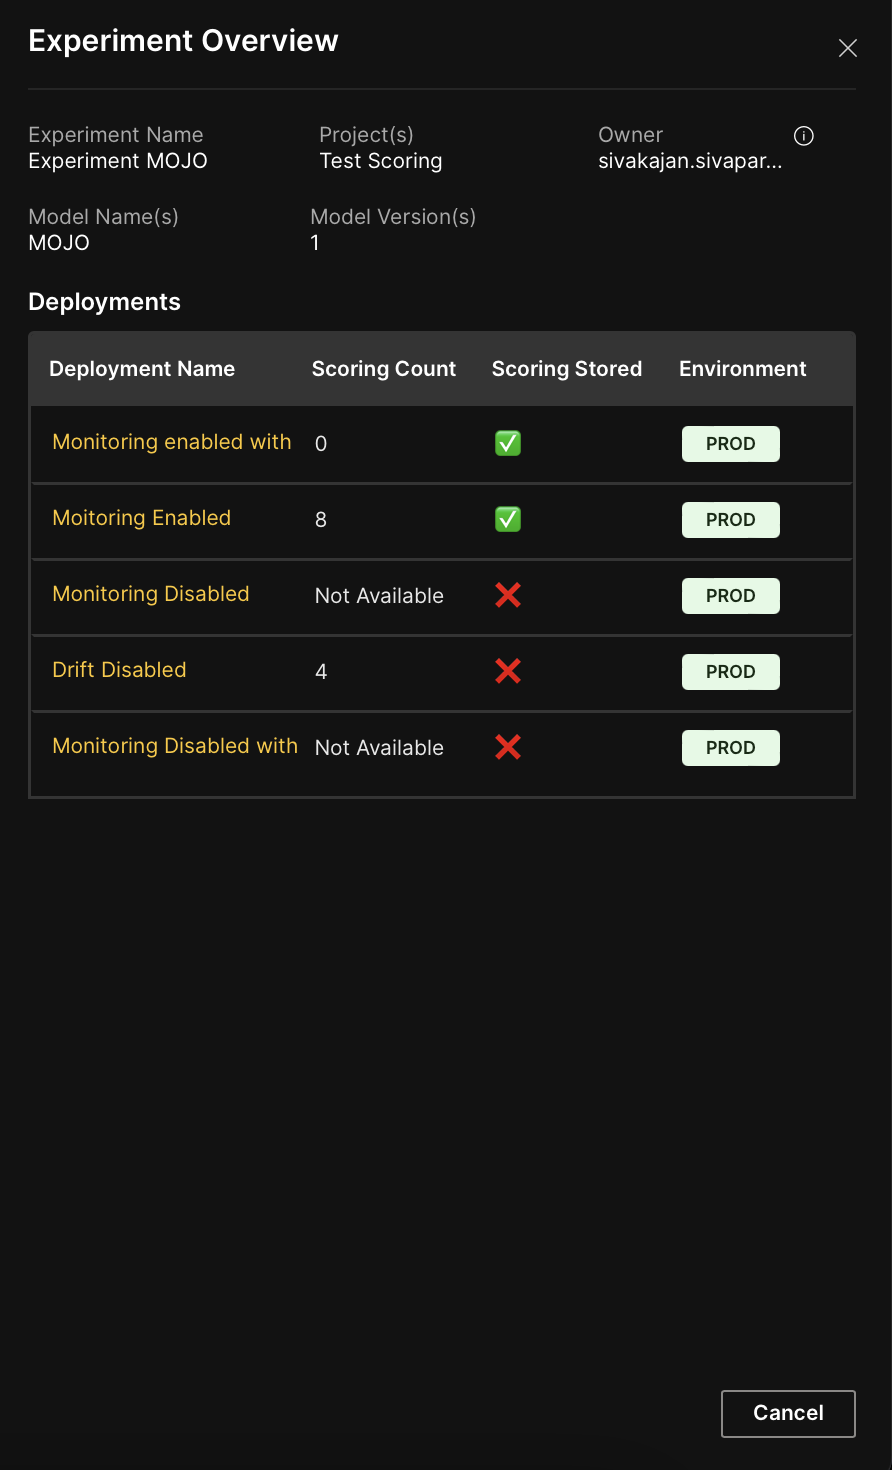
To view additional details about an experiment listed in the table, click the name of the experiment to open the Experiment Overview window, which displays the following information:
- Experiment name
- Project name
- Owner
- When applicable, the model name
- When applicable, the model version
- When applicable, the Deployment name
- When applicable, the Scoring count
- When applicable, the Scoring stored indicator shows the current status of the Drift Scoring feature for the deployment. When marked with a ✅, it implies that Drift Scoring is enabled.
- When applicable, the Environment used for deployment
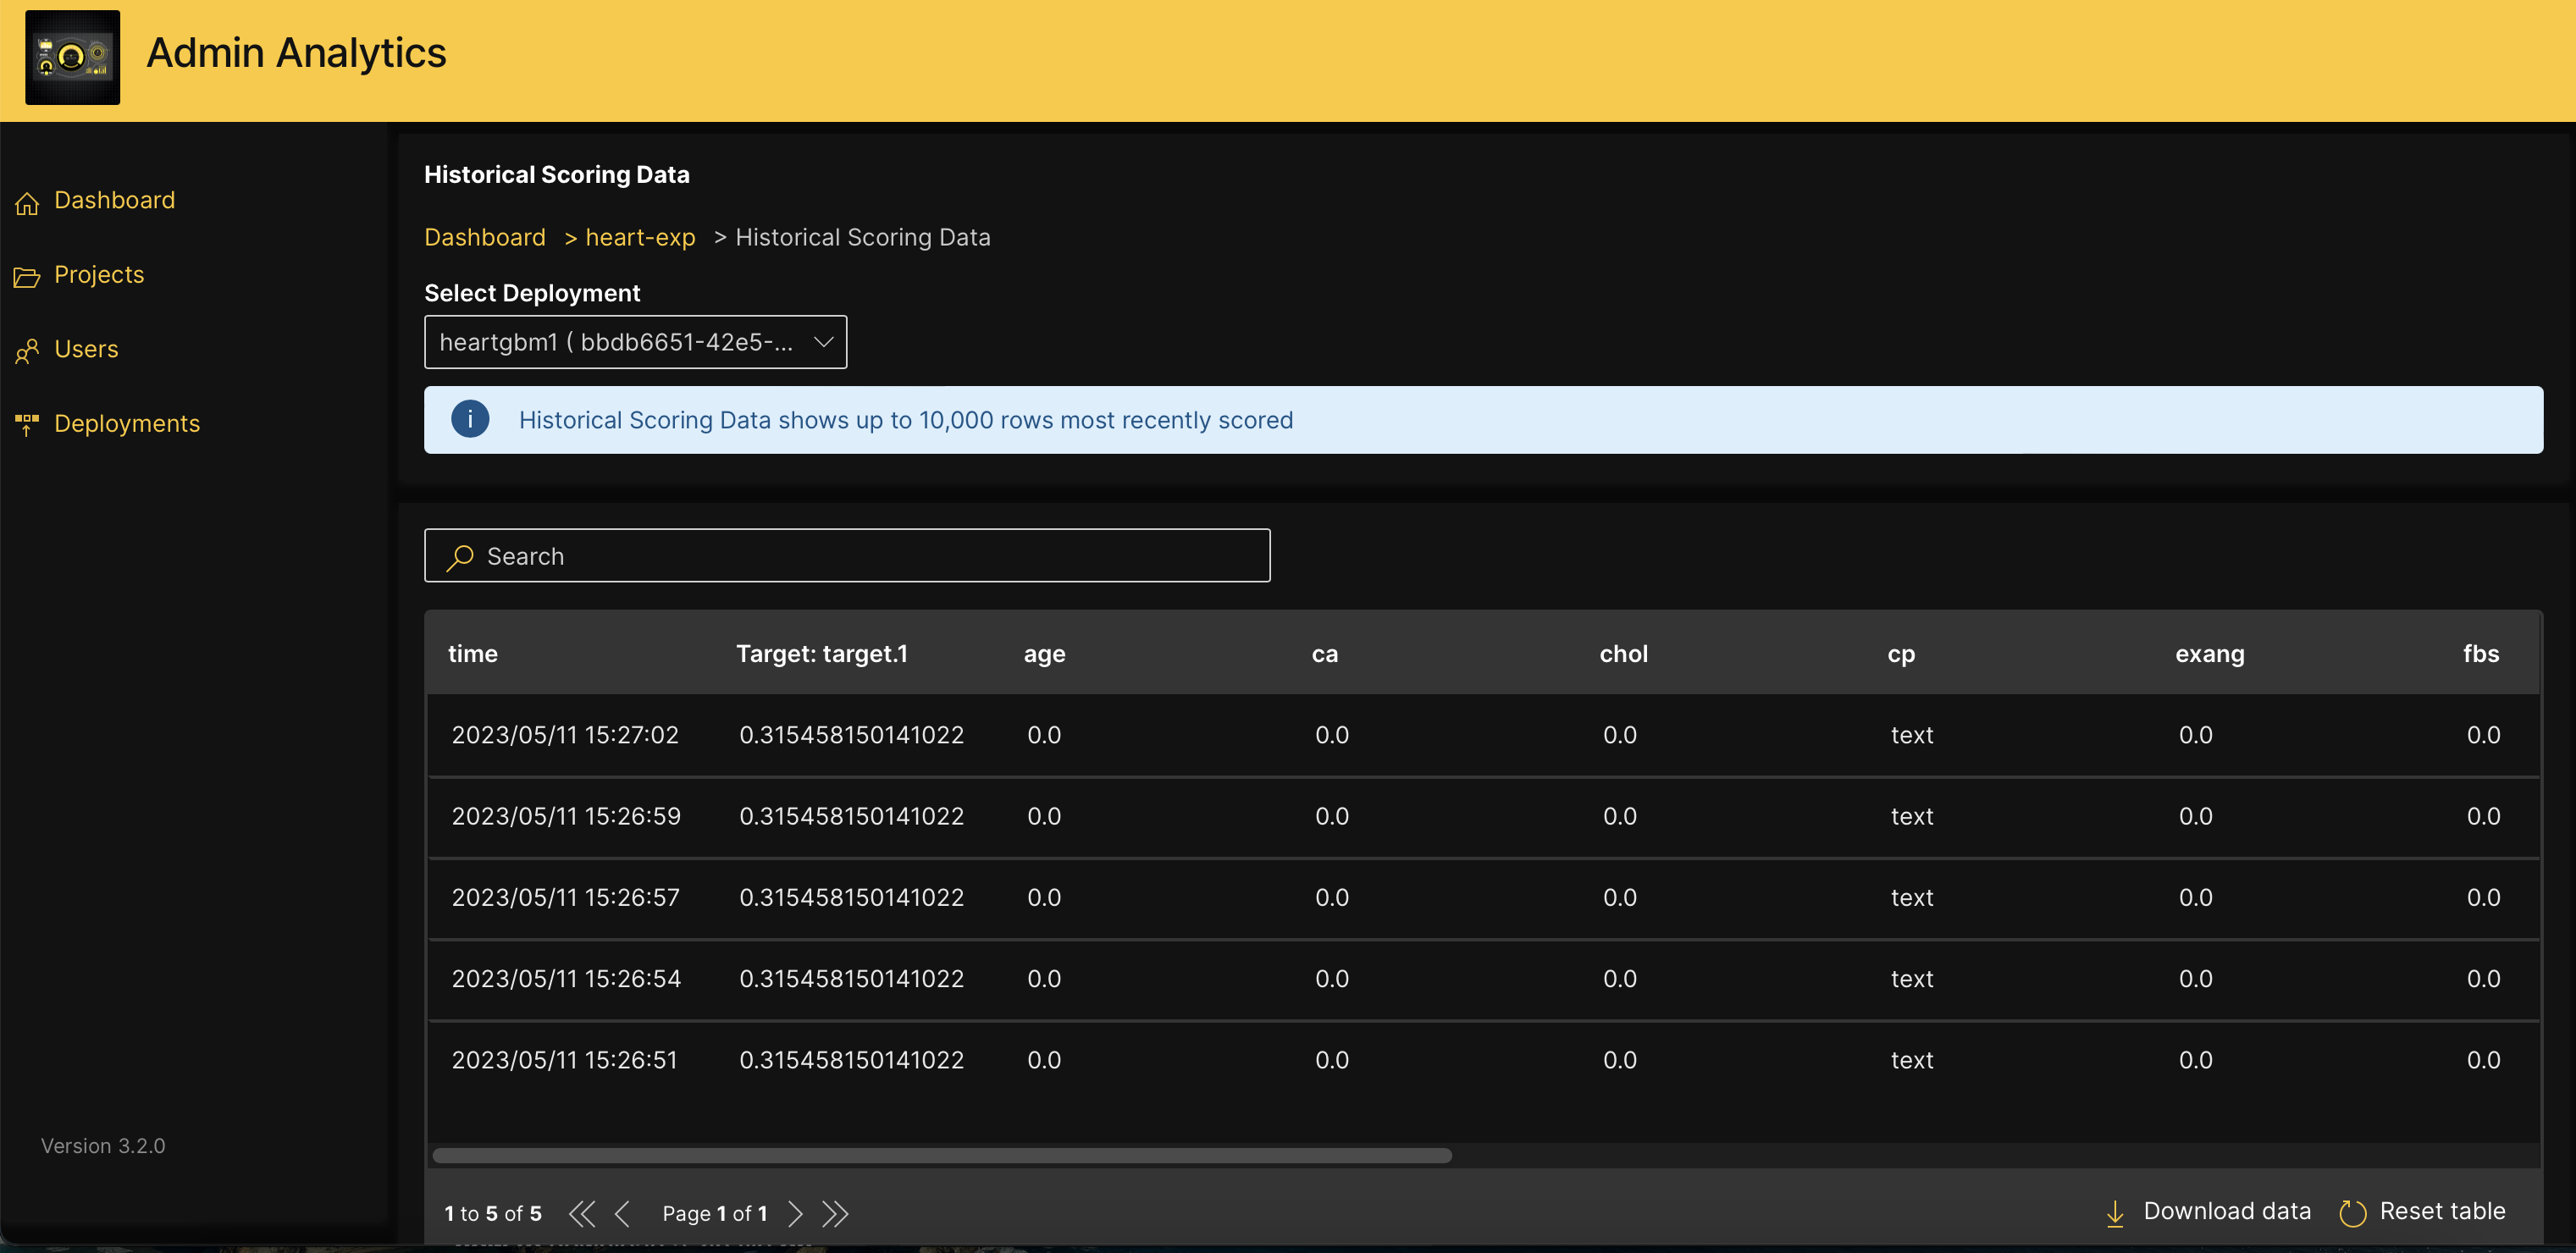
For models that have been deployed, you can view historical scoring data from the Experiment Overview window by clicking a deployment's Deployment name. To download historical scoring data as a ZIP file, click Download data at the bottom of the table.
If there are more than 10000 scoring data records, the most recent 10000 records are displayed.
Download data
To download the data in the table as a ZIP file, click Download data at the bottom of the table.
All tables in H2O Admin Analytics support search, sort, and pagination. To navigate between pages of a table, click on the arrow keys at the bottom of that table. You can use the search box to filter the contents of the table based on the text you enter. To sort the contents based on a given column, click on that column name, and use the arrow keys that appear to sort the content in ascending or descending order. Additionally, these tables support nested operations, where you can combine a search and a sort. You can reset the table to its original state by clicking Reset table at the bottom.
- Submit and view feedback for this page
- Send feedback about Admin Analytics to cloud-feedback@h2o.ai