Metrics: Size dependency
H2O Model Validation offers an array of metrics to understand a size dependency test. Below, each metric is described in turn.
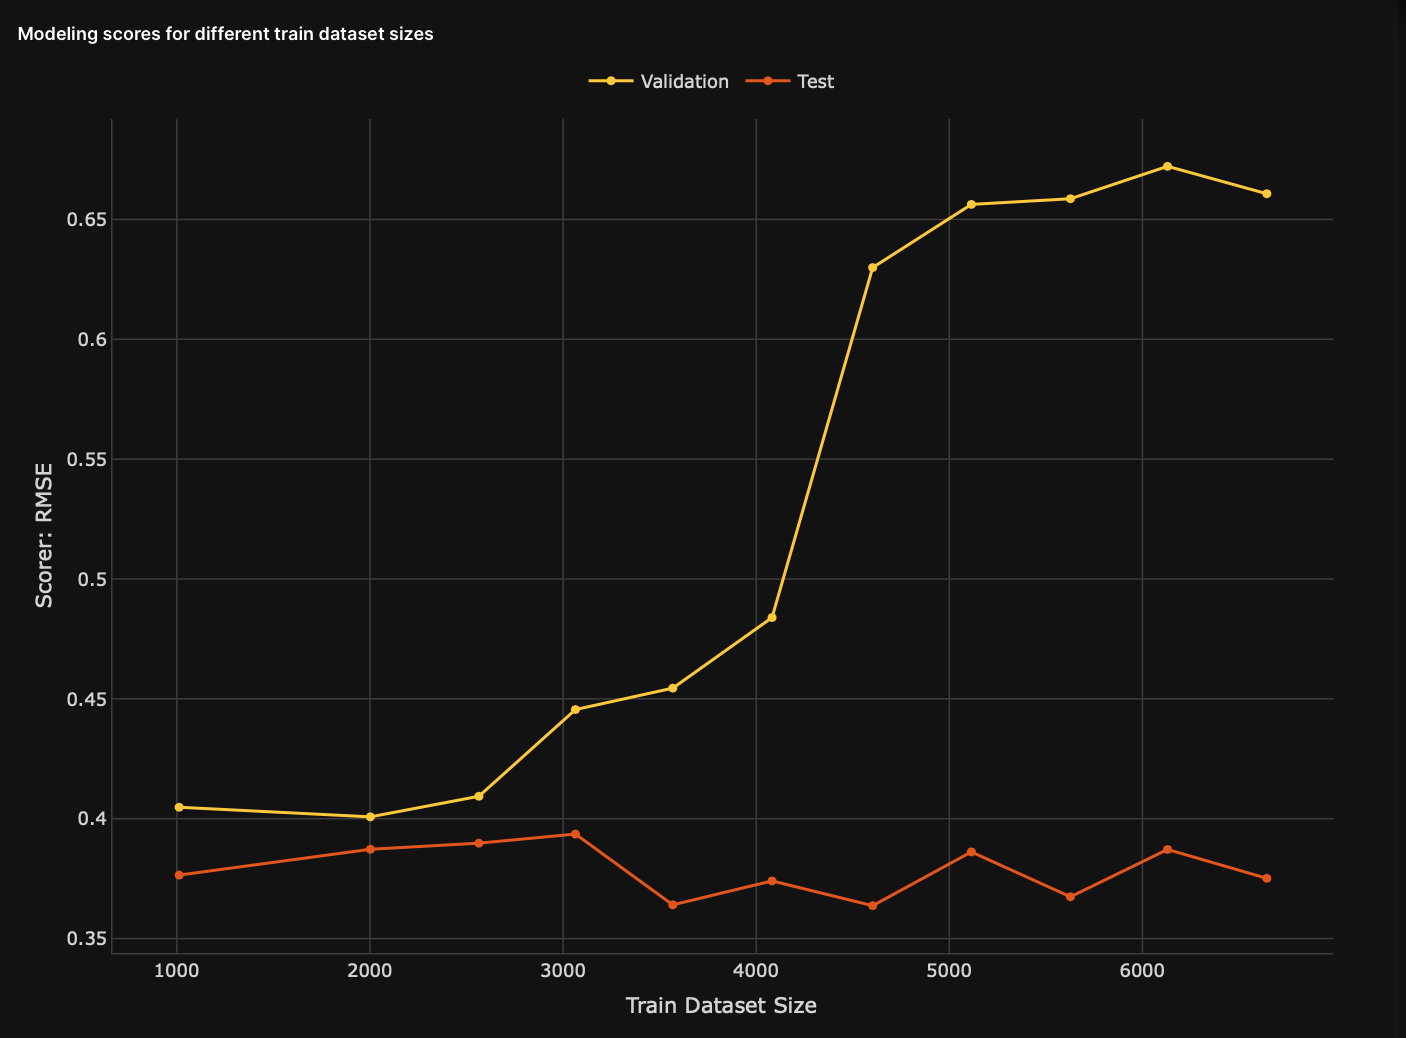
Plot graph: Modeling scores for different train dataset sizes (MSDTDS)
The plot graph visualizes several scorer values for models (identical models) trained with different training data sizes. Observing the MSDTDS plot graph can enable you to understand and find an acceptable train dataset size for your model.
- Y-axis: Scorer values
- X-axis: Size of the training data
- First line: The validation scores of each model
- Second line: The test scores of each model
- Dots: Dots on each line refer to a child model or the parent model
- Child model: A child model refers to a model trained on one of the sub-training samples obtained from the original training data
- Parent model: The parent model refers to a trained model with the original training data and not with one of the sub-training samples.
Scores for models in the MSDTDS plot are positioned from left to right. The first model on the left (also known as a child model) represents the model with the smallest sub-training sample obtained from the original train data. The model furthest to the right, known as the parent model, represents the original model that used the whole original train data. The model right before the parent model represents the model with the highest sub-training sample.
Considering the below two graphs (figures) of a model and that a low RMSE score indicates a better model performance, we can conclude that as the model increases its training data size, the RMSE score will decrease while improving the model performance. When comparing the first child model with the parent model, we can see that by increasing the training data size by 144.0.66k, we obtain a 0.48 RMSE score. A lower RMSE when compared to the one the first child model received.
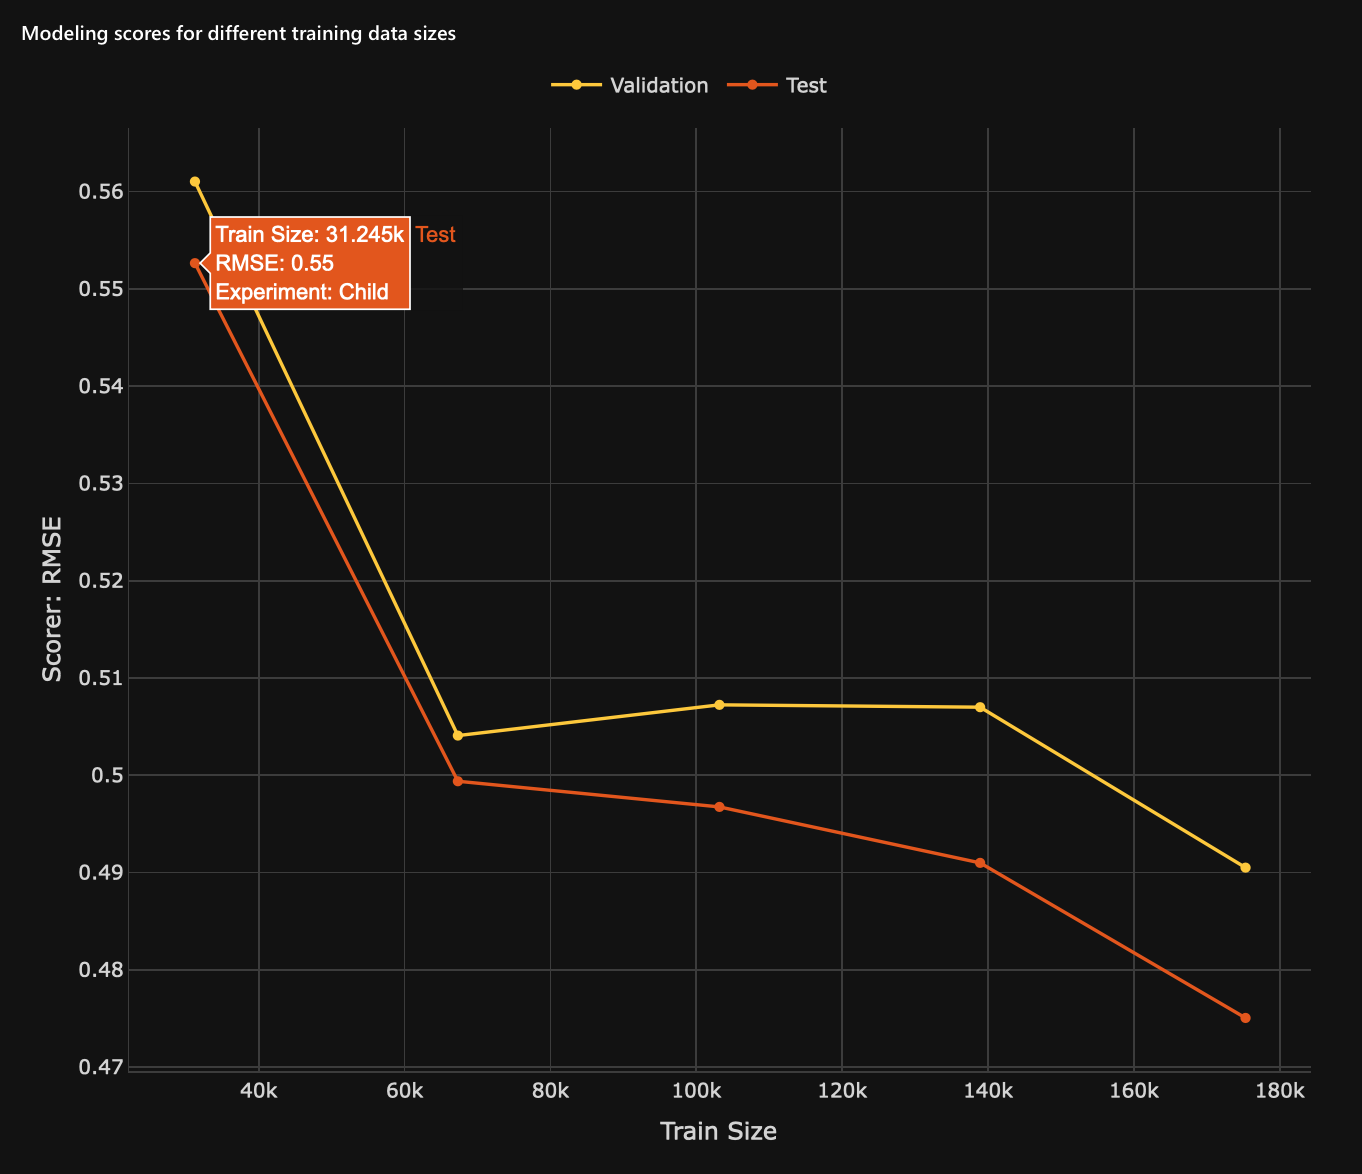
Figure 1: Child model
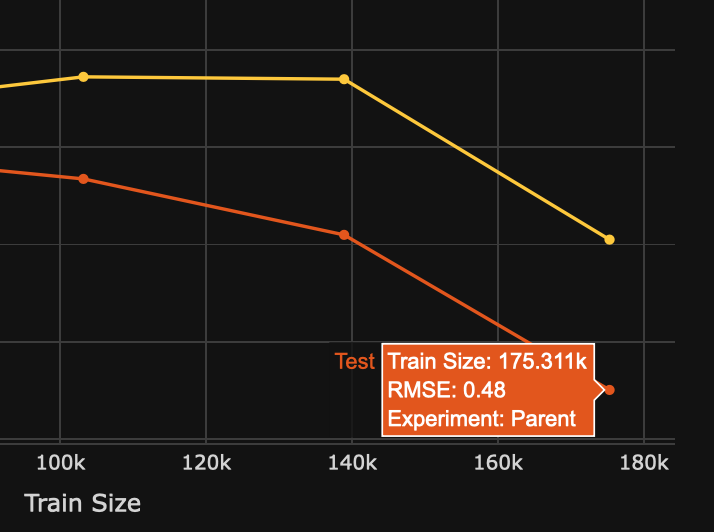
Figure 2: Parent model
Heatmap: Feature importance for different training data sizes (FIDTDS)
The FIDTDS heatmap visualizes the most important features for different models trained on different sizes of training data during the retraining process of a model.
- Rows: Dataset variables (features)
- Columns: Train dataset size
Based on the below heatmap, we can see that throughout the retraining process of a model with different sizes of training data, the customers variable was kept as the most important feature.
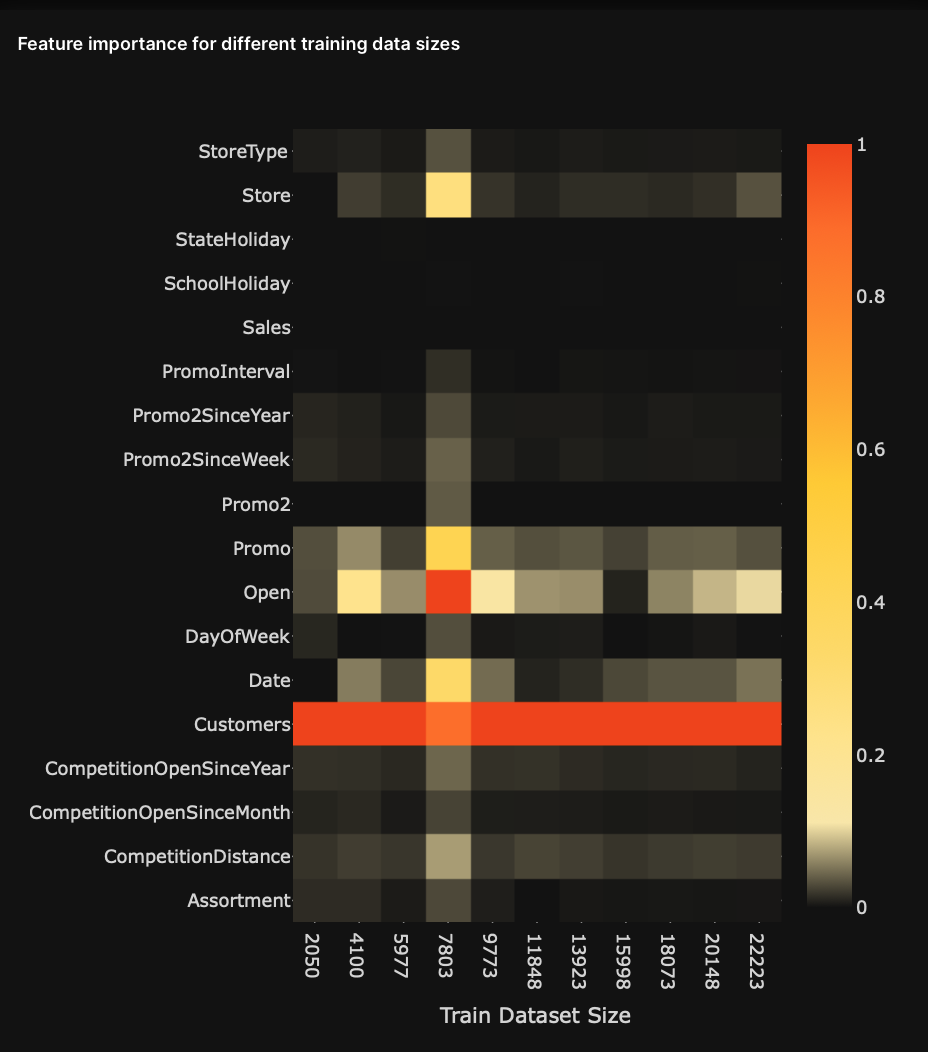
Table: Models
The table displays the Driverless AI experiments corresponding to size dependency models at each split.
| Column name | Description |
|---|---|
# | Experiment number |
Model origin | Origin of the model (Parent or child) |
Ensemble | Ensemble of models used in the Driverless AI experiment with their weights |
Best model | Best machine learning (ML) model used in the Driverless AI experiment |
Train dataset size | Size of the training data used in the Driverless AI experiment |
Best feature | Best feature information of the Driverless AI experiment |
- Submit and view feedback for this page
- Send feedback about H2O Model Validation to cloud-feedback@h2o.ai