Driverless AI Transformations
Transformations in Driverless AI are applied to columns in the data. The transformers create the engineered features in experiments.
Driverless AI provides a number of transformers. The downloaded experiment logs include the transformations that were applied to your experiment.
Notes:
You can include or exclude specific transformers in your Driverless AI environment using the
included_transformersorexcluded_transformersconfig options.You can control which transformers to use in individual experiments with the Include Specific Transformers Expert Setting.
Transformed feature names are encoded as follows:
<transformation/gene_details_id>_<transformation_name>:<orig>:<…>:<orig>.<extra>
So in
32_NumToCatTE:BILL_AMT1:EDUCATION:MARRIAGE:SEX.0, for example:
32_is the transformation index for specific transformation parameters.
NumToCatTEis the tranformation type.
BILL_AMT1:EDUCATION:MARRIAGE:SEXrepresent original features used.
0represents the likelihood encoding for target[0] after grouping by features (shown here asBILL_AMT1,EDUCATION,MARRIAGEandSEX) and making out-of-fold estimates. For multiclass experiments, this value is > 0. For binary experiments, this value is always 0.
Available Transformers
The following transformers are available for classification (multiclass and binary) and regression experiments.
Numeric Transformers (Integer, Real, Binary)
ClusterDist Transformer
The Cluster Distance Transformer clusters selected numeric columns and uses the distance to a specific cluster as a new feature.
ClusterTE Transformer
The Cluster Target Encoding Transformer clusters selected numeric columns and calculates the mean of the response column for each cluster. The mean of the response is used as a new feature. Cross Validation is used to calculate mean response to prevent overfitting.
Interactions Transformer
The Interactions Transformer adds, divides, multiplies, and subtracts two numeric columns in the data to create a new feature. This transformation uses a smart search to identify which feature pairs to transform. Only interactions that improve the baseline model score are kept.
InteractionsSimple Transformer
The InteractionsSimple Transformer adds, divides, multiplies, and subtracts two numeric columns in the data to create a new feature. This transformation randomly selects pairs of features to transform.
NumCatTE Transformer
The Numeric Categorical Target Encoding Transformer calculates the mean of the response column for several selected columns. If one of the selected columns is numeric, it is first converted to categorical by binning. The mean of the response column is used as a new feature. Cross Validation is used to calculate mean response to prevent overfitting.
NumToCatTE Transformer
The Numeric to Categorical Target Encoding Transformer converts numeric columns to categoricals by binning and then calculates the mean of the response column for each group. The mean of the response for the bin is used as a new feature. Cross Validation is used to calculate mean response to prevent overfitting.
NumToCatWoEMonotonic Transformer
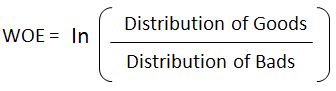
The Numeric to Categorical Weight of Evidence Monotonic Transformer converts a numeric column to categorical by binning and then calculates Weight of Evidence for each bin. The monotonic constraint ensures the bins of values are monotonically related to the Weight of Evidence value. The Weight of Evidence is used as a new feature. Weight of Evidence measures the “strength” of a grouping for separating good and bad risk and is calculated by taking the log of the ratio of distributions for a binary response column.
NumToCatWoE Transformer
The Numeric to Categorical Weight of Evidence Transformer converts a numeric column to categorical by binning and then calculates Weight of Evidence for each bin. The Weight of Evidence is used as a new feature. Weight of Evidence measures the “strength” of a grouping for separating good and bad risk and is calculated by taking the log of the ratio of distributions for a binary response column.
Original Transformer
The Original Transformer applies an identity transformation to a numeric column.
TruncSVDNum Transformer
Truncated SVD Transformer trains a Truncated SVD model on selected numeric columns and uses the components of the truncated SVD matrix as new features.
Time Series Experiments Transformers
DateOriginal Transformer
The Date Original Transformer retrieves date values such as year, quarter, month, day, day of the year, week, and weekday values.
DateTimeOriginal Transformer
The Date Time Original Transformer retrieves date and time values such as year, quarter, month, day, day of the year, week, weekday, hour, minute, and second values.
EwmaLags Transformer
The Exponentially Weighted Moving Average (EWMA) Transformer calculates the exponentially weighted moving average of target or feature lags.
LagsAggregates Transformer
The Lags Aggregates Transformer calculates aggregations of target/feature lags like mean(lag7, lag14, lag21) with support for mean, min, max, median, sum, skew, kurtosis, std. The aggregation is used as a new feature.
LagsInteraction Transformer
The Lags Interaction Transformer creates target/feature lags and calculates interactions between the lags (lag2 - lag1, for instance). The interaction is used as a new feature.
Lags Transformer
The Lags Transformer creates target/feature lags, possibly over groups. Each lag is used as a new feature. Lag transformers may apply to categorical (strings) features or binary/multiclass string valued targets after they have been internally numerically encoded.
LinearLagsRegression Transformer
The Linear Lags Regression transformer trains a linear model on the target or feature lags to predict the current target or feature value. The linear model prediction is used as a new feature.
Categorical Transformers (String)
Cat Transformer
The Cat Transformer sorts a categorical column in lexicographical order and uses the order index created as a new feature. This transformer works with models that can handle categorical features.
CatOriginal Transformer
The Categorical Original Transformer applies an identity transformation that leaves categorical features as they are. This transformer works with models that can handle non-numeric feature values.
CVCatNumEncode Transformer
The Cross Validation Categorical to Numeric Encoding Transformer calculates an aggregation of a numeric column for each value in a categorical column (ex: calculate the mean Temperature for each City) and uses this aggregation as a new feature.
CVTargetEncode Transformer
The Cross Validation Target Encoding Transformer calculates the mean of the response column for each value in a categorical column and uses this as a new feature. Cross Validation is used to calculate mean response to prevent overfitting.
Frequent Transformer
The Frequent Transformer calculates the frequency for each value in categorical column(s) and uses this as a new feature. This count can be either the raw count or the normalized count.
LexiLabelEncoder Transformer
The Lexi Label Encoder sorts a categorical column in lexicographical order and uses the order index created as a new feature.
NumCatTE Transformer
The Numeric Categorical Target Encoding Transformer calculates the mean of the response column for several selected columns. If one of the selected columns is numeric, it is first converted to categorical by binning. The mean of the response column is used as a new feature. Cross Validation is used to calculate mean response to prevent overfitting.
OneHotEncoding Transformer
The One-hot Encoding transformer converts a categorical column to a series of boolean features by performing one-hot encoding. The boolean features are used as new features. If there are more than a specific number of unique values in the column, then they will be binned to the max number (10 by default) in lexicographical order. This value can be chaged with the
ohe_bin_listconfig.toml configuration option.SortedLE Transformer
The Sorted Label Encoding Transformer sorts a categorical column by the response column and uses the order index created as a new feature.
WeightOfEvidence Transformer
The Weight of Evidence Transformer calculates Weight of Evidence for each value in categorical column(s). The Weight of Evidence is used as a new feature. Weight of Evidence measures the “strength” of a grouping for separating good and bad risk and is calculated by taking the log of the ratio of distributions for a binary response column.
This only works with a binary target variable. The likelihood needs to be created within a stratified kfold if a fit_transform method is used. More information can be found here: http://ucanalytics.com/blogs/information-value-and-weight-of-evidencebanking-case/.
Text Transformers (String)
TextBiGRU Transformer
The Text Bidirectional GRU Transformer trains a bi-directional GRU TensorFlow model on word embeddings created from a text feature to predict the response column. The GRU prediction is used as a new feature. Cross Validation is used when training the GRU model to prevent overfitting.
TextCharCNN Transformer
The Text Character CNN Transformer trains a CNN TensorFlow model on character embeddings created from a text feature to predict the response column. The CNN prediction is used as a new feature. Cross Validation is used when training the CNN model to prevent overfitting.
TextCNN Transformer
The Text CNN Transformer trains a CNN TensorFlow model on word embeddings created from a text feature to predict the response column. The CNN prediction is used as a new a feature. Cross Validation is used when training the CNN model to prevent overfitting.
TextLinModel Transformer
The Text Linear Model Transformer trains a linear model on a TF-IDF matrix created from a text feature to predict the response column. The linear model prediction is used as a new feature. Cross Validation is used when training the linear model to prevent overfitting.
Text Transformer
The Text Transformer tokenizes a text column and creates a TFIDF matrix (term frequency-inverse document frequency) or count (count of the word) matrix. This may be followed by dimensionality reduction using truncated SVD. Selected components of the TF-IDF/Count matrix are used as new features.
Time Transformers (Date, Time)
Dates Transformer
The Dates Transformer retrieves any date values, including:
Year
Quarter
Month
Day
Day of year
Week
Week day
Hour
Minute
Second
IsHoliday Transformer
The Is Holiday Transformer determines if a date column is a holiday. A boolean column indicating if the date is a holiday is added as a new feature. Creates a separate feature for holidays in the United States, United Kingdom, Germany, Mexico, and the European Central Bank. Other countries available in the python Holiday package can be added via the configuration file.
Example Transformations
In this section, we will describe some of the available transformations using the example of predicting house prices on the example dataset.
Date Built |
Square Footage |
Num Beds |
Num Baths |
State |
Price |
|---|---|---|---|---|---|
01/01/1920 |
1700 |
3 |
2 |
NY |
$700K |
Frequent Transformer
the count of each categorical value in the dataset
the count can be either the raw count or the normalized count
Date Built |
Square Footage |
Num Beds |
Num Baths |
State |
Price |
Freq_State |
|---|---|---|---|---|---|---|
01/01/1920 |
1700 |
3 |
2 |
NY |
700,000 |
4,500 |
There are 4,500 properties in this dataset with state = NY.
Bulk Interactions Transformer
add, divide, multiply, and subtract two columns in the data
Date Built |
Square Footage |
Num Beds |
Num Baths |
State |
Price |
Interaction_NumBeds#subtract#NumBaths |
|---|---|---|---|---|---|---|
01/01/1920 |
1700 |
3 |
2 |
NY |
700,000 |
1 |
There is one more bedroom than there are number of bathrooms for this property.
Truncated SVD Numeric Transformer
truncated SVD trained on selected numeric columns of the data
the components of the truncated SVD will be new features
Date Built |
Square Footage |
Num Beds |
Num Baths |
State |
Price |
TruncSVD_Price_NumBeds_NumBaths_1 |
|---|---|---|---|---|---|---|
01/01/1920 |
1700 |
3 |
2 |
NY |
700,000 |
0.632 |
The first component of the truncated SVD of the columns Price, Number of Beds, Number of Baths.
Dates Transformer
get year, get quarter, get month, get day, get day of year, get week, get week day, get hour, get minute, get second
Date Built |
Square Footage |
Num Beds |
Num Baths |
State |
Price |
DateBuilt_Month |
|---|---|---|---|---|---|---|
01/01/1920 |
1700 |
3 |
2 |
NY |
700,000 |
1 |
The home was built in the month January.
Text Transformer
transform text column using methods: TFIDF or count (count of the word)
this may be followed by dimensionality reduction using truncated SVD
Categorical Target Encoding Transformer
cross validation target encoding done on a categorical column
Date Built |
Square Footage |
Num Beds |
Num Baths |
State |
Price |
CV_TE_State |
|---|---|---|---|---|---|---|
01/01/1920 |
1700 |
3 |
2 |
NY |
700,000 |
550,000 |
The average price of properties in NY state is $550,000*.
*In order to prevent overfitting, Driverless AI calculates this average on out-of-fold data using cross validation.
Numeric to Categorical Target Encoding Transformer
numeric column converted to categorical by binning
cross validation target encoding done on the binned numeric column
Date Built |
Square Footage |
Num Beds |
Num Baths |
State |
Price |
CV_TE_SquareFootage |
|---|---|---|---|---|---|---|
01/01/1920 |
1700 |
3 |
2 |
NY |
700,000 |
345,000 |
The column Square Footage has been bucketed into 10 equally populated bins. This property lies in the Square Footage bucket 1,572 to 1,749. The average price of properties with this range of square footage is $345,000*.
*In order to prevent overfitting, Driverless AI calculates this average on out-of-fold data using cross validation.
Cluster Target Encoding Transformer
selected columns in the data are clustered
target encoding is done on the cluster ID
Date Built |
Square Footage |
Num Beds |
Num Baths |
State |
Price |
ClusterTE_4_NumBeds_NumBaths_SquareFootage |
|---|---|---|---|---|---|---|
01/01/1920 |
1700 |
3 |
2 |
NY |
700,000 |
450,000 |
The columns: Num Beds, Num Baths, Square Footage have been segmented into 4 clusters. The average price of properties in the same cluster as the selected property is $450,000*.
*In order to prevent overfitting, Driverless AI calculates this average on out-of-fold data using cross validation.
Cluster Distance Transformer
selected columns in the data are clustered
the distance to a chosen cluster center is calculated
Date Built |
Square Footage |
Num Beds |
Num Baths |
State |
Price |
ClusterDist_4_NumBeds_NumBaths_SquareFootage_1 |
|---|---|---|---|---|---|---|
01/01/1920 |
1700 |
3 |
2 |
NY |
700,000 |
0.83 |
The columns: Num Beds, Num Baths, Square Footage have been segmented into 4 clusters. The difference from this record to Cluster 1 is 0.83.