Datasets
On the Datasets page, you can view imported and uploaded datasets.
- To learn how to import a dataset (table), see Import Snowflake table.
- To learn how to upload a dataset, see Upload dataset.
Upload dataset
To upload a new dataset, consider the following instructions:
- In the Gene Mutation AI menu, click Datasets.
- By default, during the process of uploading a dataset, Gene Mutation AI will score the uploaded dataset with the preloaded ‘default’ model. It enables the calculation of mutation frequencies by pathway, which is the data frame that will be imported to the application. If you want to turn this off:
- To turn it off, click the Run the data through pre-processing pipeline toggle.
- If non-genic information such as demographics or ground truth diagnoses is present, please define their column names as follows:
- In the Select columns to retain after pre-processing box,
- To upload your dataset either:
- Click Browse....
- Or drag and drop a file (containing the dataset)
- Click Upload new dataset.
- The dataset should be in a
.csvor.txtfile format, where each row is a patient sample and each column a gene name. Allowed values are 1/0, indicating the presence/absence of detected SNP(s) within the gene’s ORF. - Uploaded datasets through the UI will be stored at the instance level.
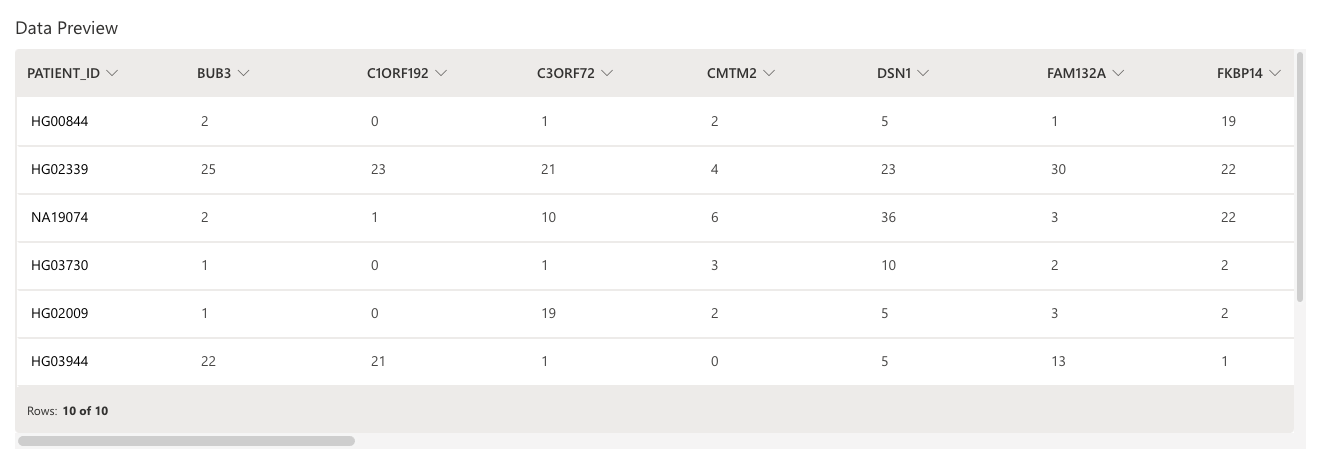
View dataset
To view imported or uploaded datasets (table), consider the following instructions:
- In the Gene Mutation AI menu, click Datasets.
- In the Select an existing dataset list, select the dataset (table) you want to view.
- Click View Dataset.
 Note
NoteA maximum of 10 rows and N columns will be displayed. N refers to the number of columns in the dataset (table).
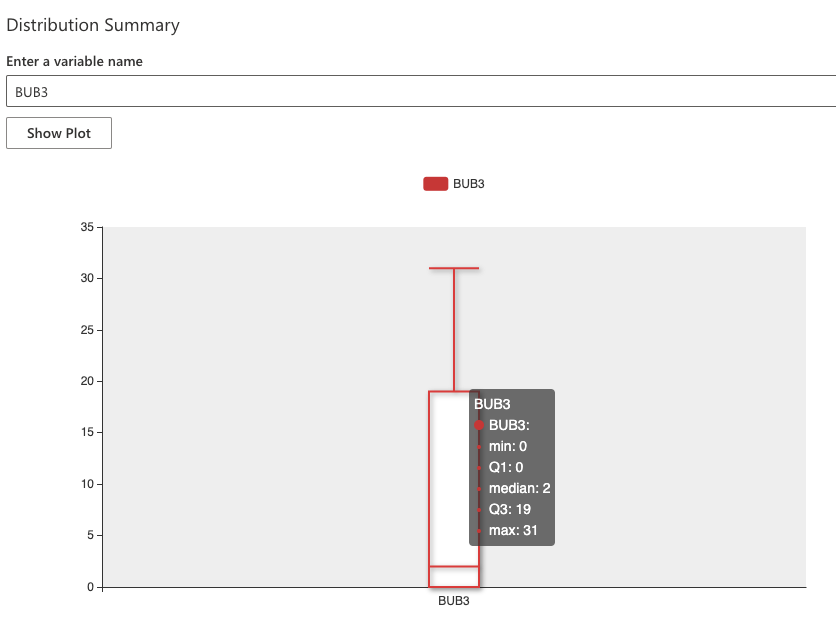
Distribution summary
To view a barplot of the cohort distribution of mutation frequencies for a particular gene (column) from a dataset in view, consider the following instructions:
- In the Enter a variable name box, enter one of the column names. Note
Case sensitive. The entered column name needs to match the column name in the dataset (table).
- Click Show Plot.
 Note
NoteAlthough a maximum of 10 rows are displayed when viewing a dataset (table), the barplots in the distribution summary are generated using the complete dataset in view.
- Submit and view feedback for this page
- Send feedback about H2O Health to cloud-feedback@h2o.ai