Compare a project's experiments
Overview
You can compare experiments in a project to understand their similarities and differences. For example, comparing experiments in one project can help you visually understand similarities in the experiment's learning rate, training batch loss, validation batch loss, and validation metric.
Instructions
To compare experiments in a project, consider the following instructions:
- In the H2O Hydrogen Torch navigation menu, click view projects.
- In the projects table, click the project name containing the experiments you want to compare.
- Click Compare experiments.
- In the experiments table, select the experiments you want to compare.
- Click Compare experiments.
Charts
After comparing a set of experiments from a project, several charts in the Charts tab become available to understand the similarities and differences between the experiment's learning rate, train batch loss, validation batch loss, and validation metric. Available charts are as follows:
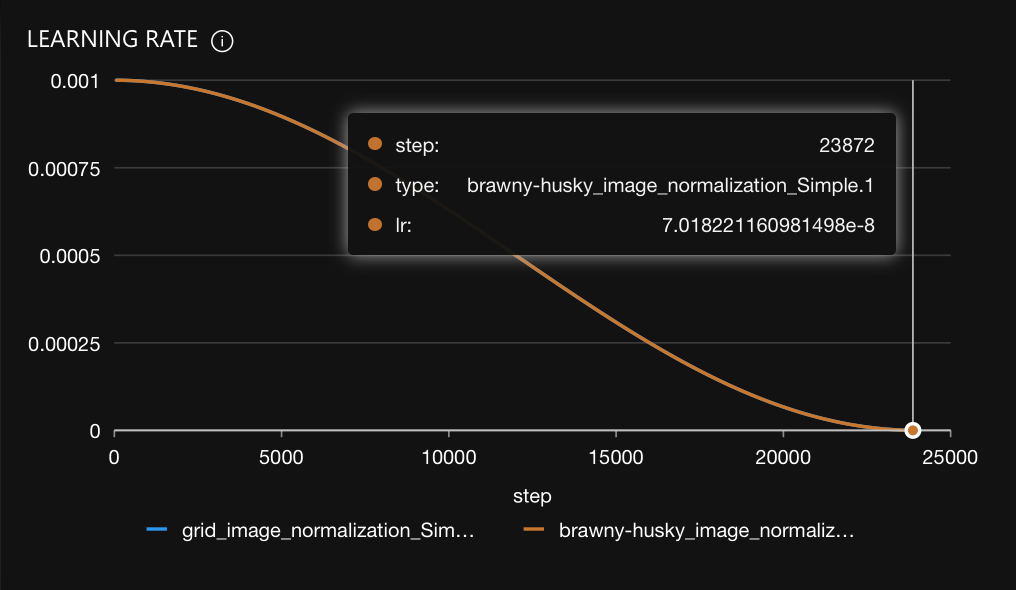
Learning rate
The Learning Rate graph displays the learning rate of all experiments throughout the training process visualized after each training batch.
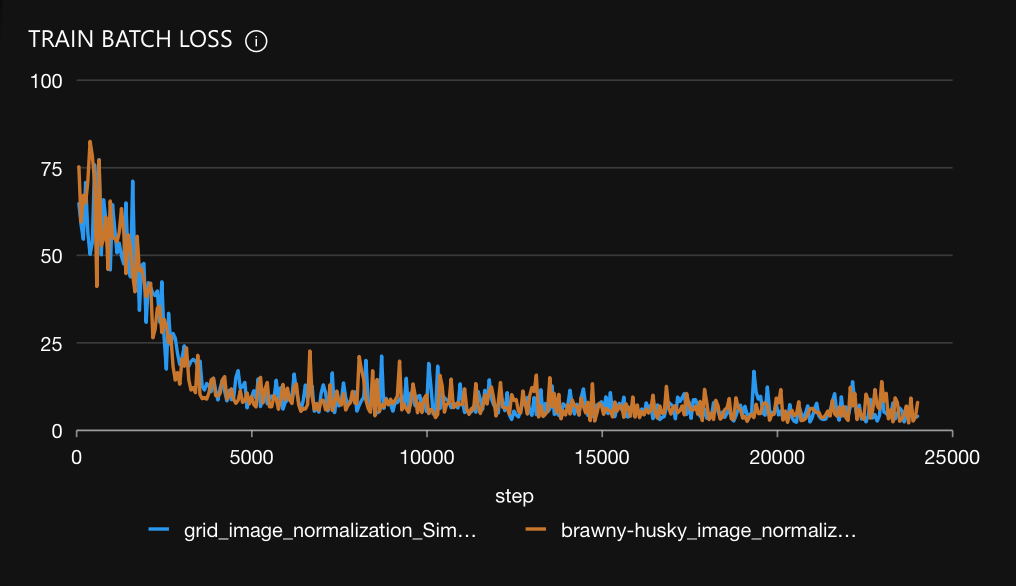
Train batch loss
The Train batch loss graph displays the current training loss of all experiments throughout the training process visualized after each training batch.
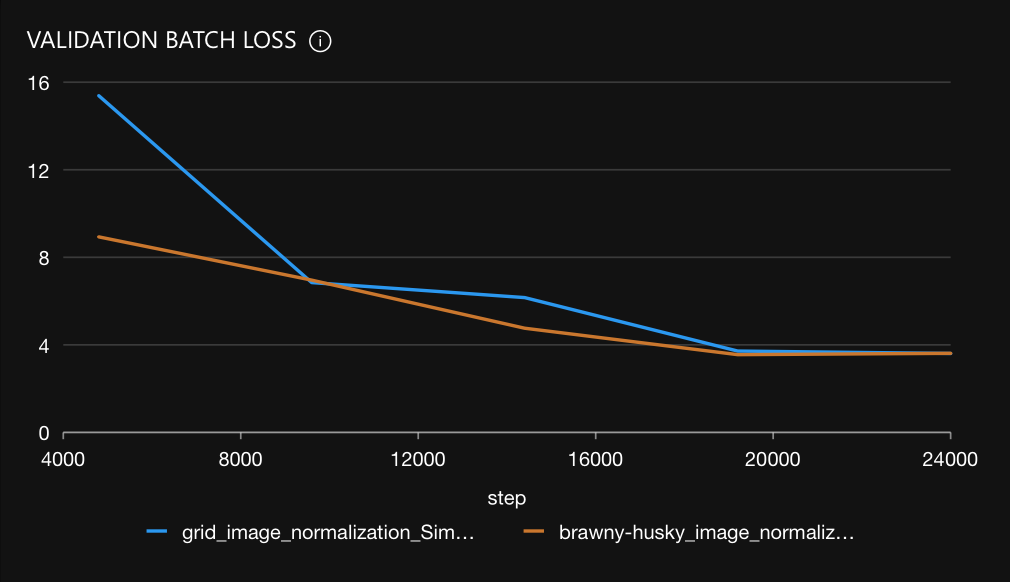
Validation batch loss
The Validation batch loss graph displays the current validation loss of all experiments throughout the training process. Loss is calculated as the average of all validation batches. By default, it is calculated and visualized after each training epoch, but this frequency can be adjusted via the Evaluation epochs setting when creating an experiment.
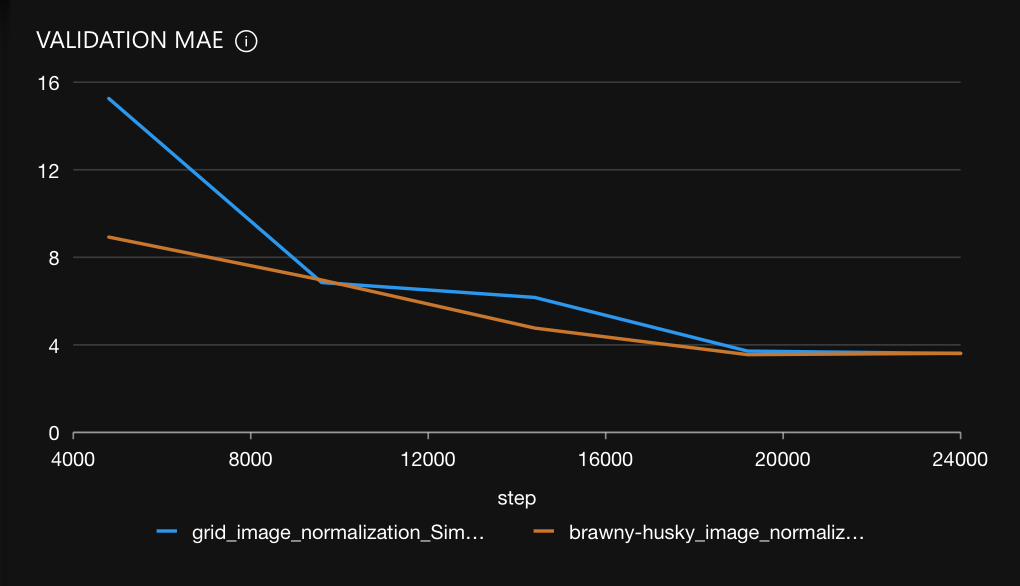
Validation {metric}
The Validation {Metric} graph displays the current validation metric of all experiments throughout the training process. In this case, the {Metric} refers to the selected metric for the problem type (e.g., MAE for an image regression experiment). {Metric} is calculated on full validation set predictions. By default, it is calculated and visualized after each training epoch, but this frequency can be adjusted via the Evaluation epochs setting when creating an experiment.
Config
After comparing a set of experiments from a project, a comparison table becomes available in the Config tab highlighting similarities and differences between compared experiments.
To view only differences in the comparison table:
- Click the Show differences only toggle.
- Submit and view feedback for this page
- Send feedback about H2O Hydrogen Torch to cloud-feedback@h2o.ai