Tutorial: Introduction to H2O AutoInsights
This tutorial uses H2O AutoInsights to discover insights in the Superstore Orders dataset. In a matter of minutes, you will discover insights in the dataset, insights that manually take time to discover. Completing this tutorial should improve your understanding of H2O AutoInsights.
Prerequisites
- A copy of the Superstore Orders dataset
info
To obtain a copy of the Superstore Orders dataset, download the superstore_orders.csv file.
Dataset overview
The Superstore Orders dataset contains details of orders made in a superstore in the United States. There are 20 columns and 9,994 rows. The first row of the dataset is as follows:
| Order ID | Order Date | Ship Date | Ship Mode | Customer ID | Customer Name | Segment | Country | City | State | Postal Code | Region | Product ID | Category | Sub-Category | Product Name | Sales | Quantity | Discount | Profit |
|---|---|---|---|---|---|---|---|---|---|---|---|---|---|---|---|---|---|---|---|
| CA-2013-152156 | 11/9/13 | 11/12/13 | Second Class | CG-12520 | Claire Gute | Consumer | United States | Henderson | Kentucky | 42420 | South | FUR-BO-10001798 | Furniture | Bookcases | Bush Somerset Collection Bookcase | 261.96 | 2 | 0 | 41.9136 |
Most likely, the size of the dataset can overwhelm someone trying to understand the dataset, especially when attempting to discover insights when time is of the essence. As a result, the likelihood of missing important insights increases.
With the above in mind, let's explore how H2O AutoInsights can discover insights in the Superstore Orders dataset in a matter of minutes while decreasing the likelihood of missing important insights.
Step 1: Upload dataset
Let's upload the Superstore Orders dataset. :
- In the H2O AutoInsights home page, click Upload Data:
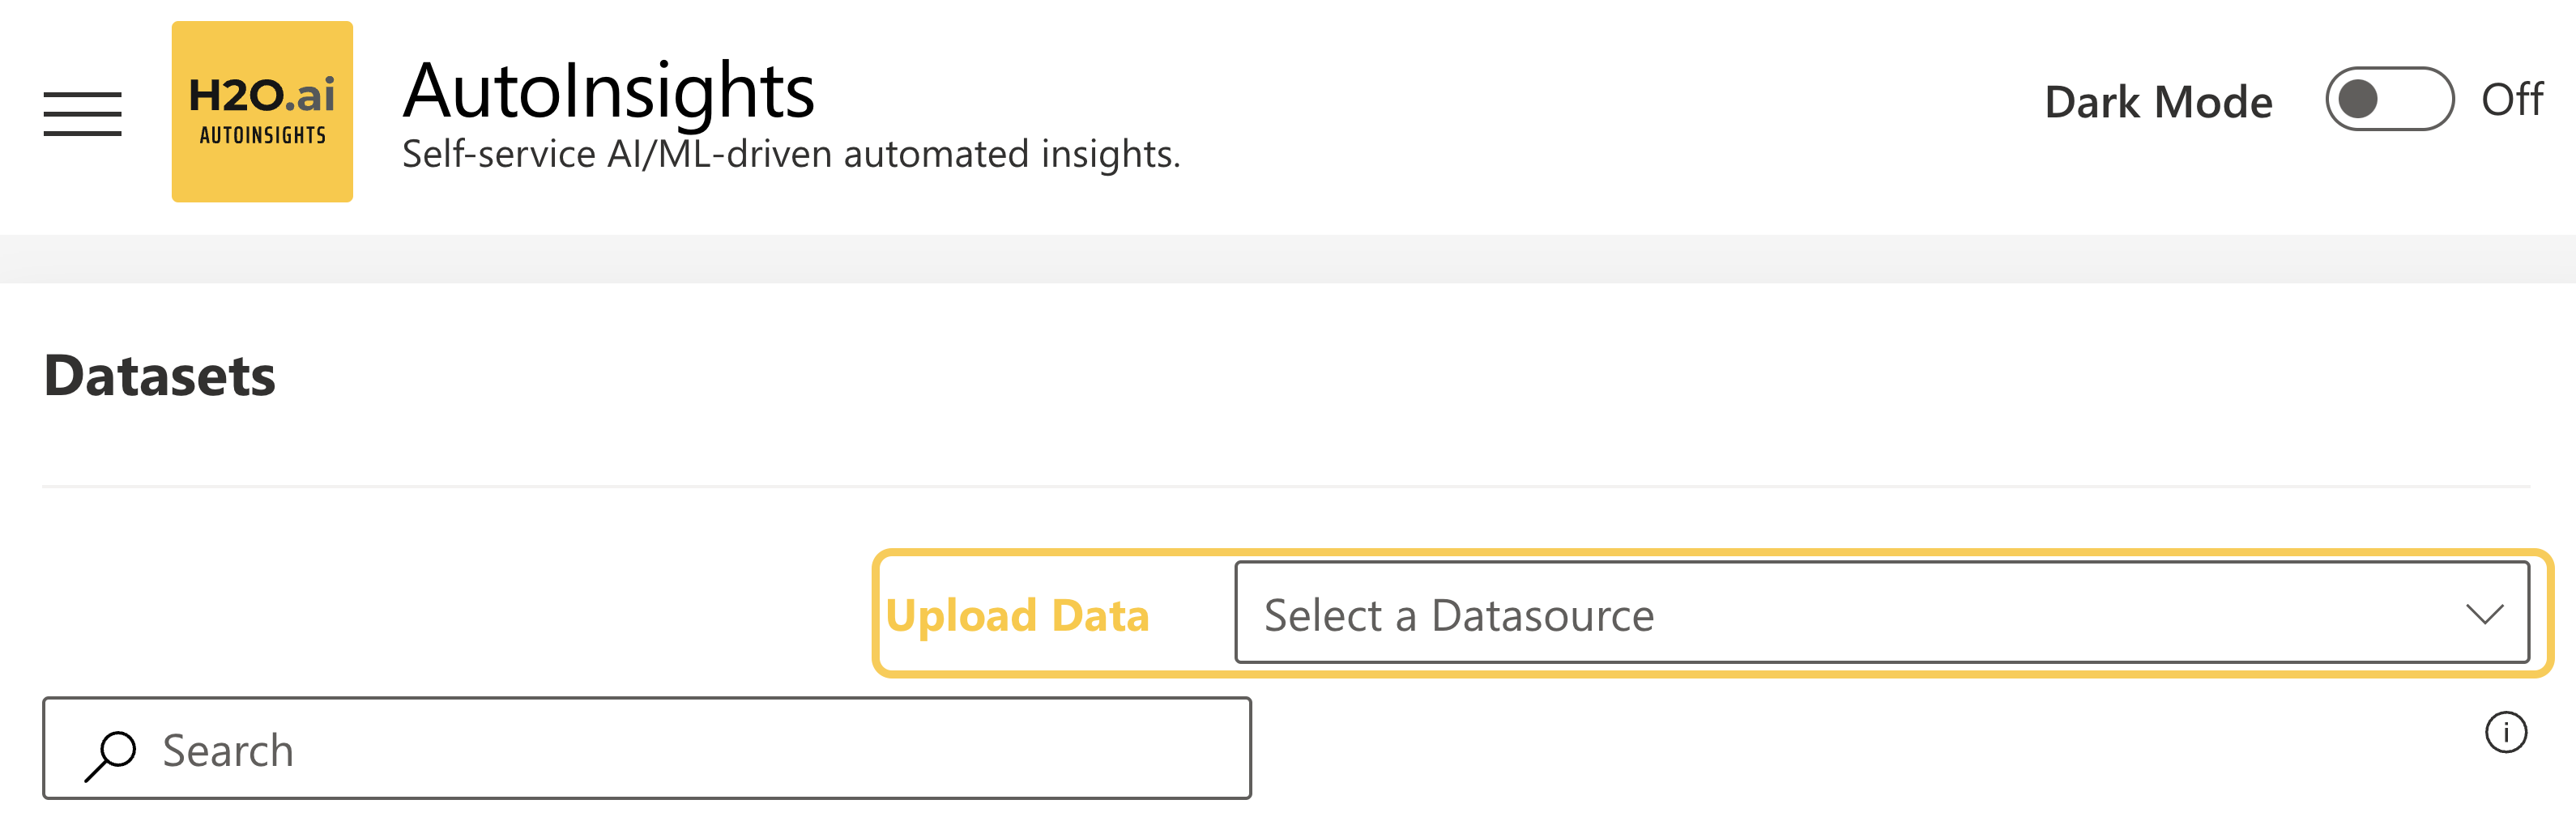
- Select a Datasource:
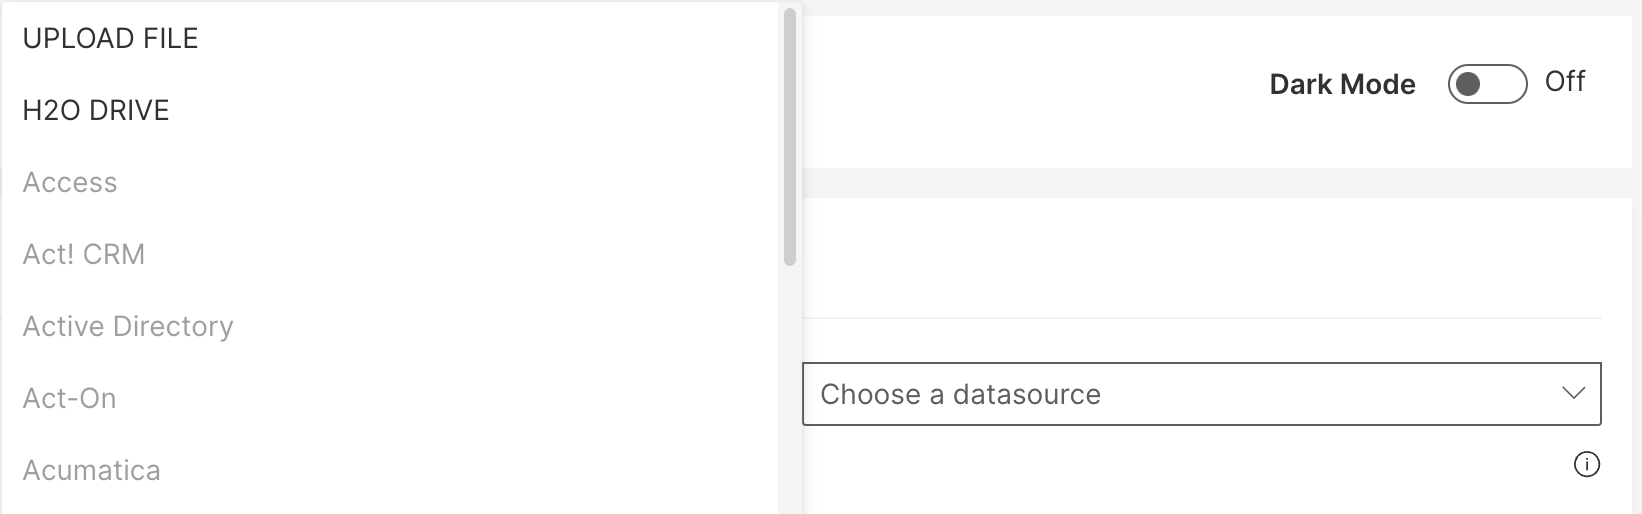
Using the File Upload data connector or H2O Drive, upload the superstore_orders.csv file (dataset).
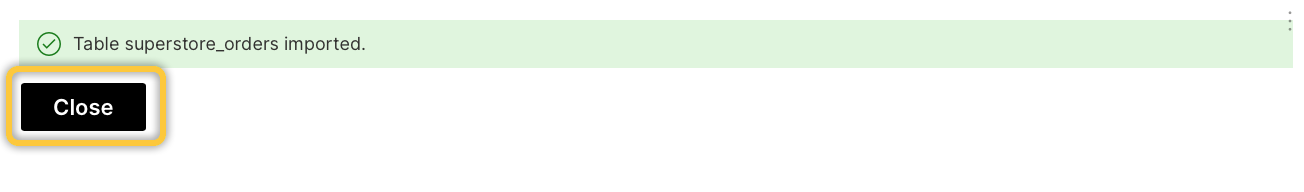
- After successfully uploading the dataset, click Close:
Step 2: Preview and dataset Summary
Now that you have uploaded the dataset, let's preview the dataset.
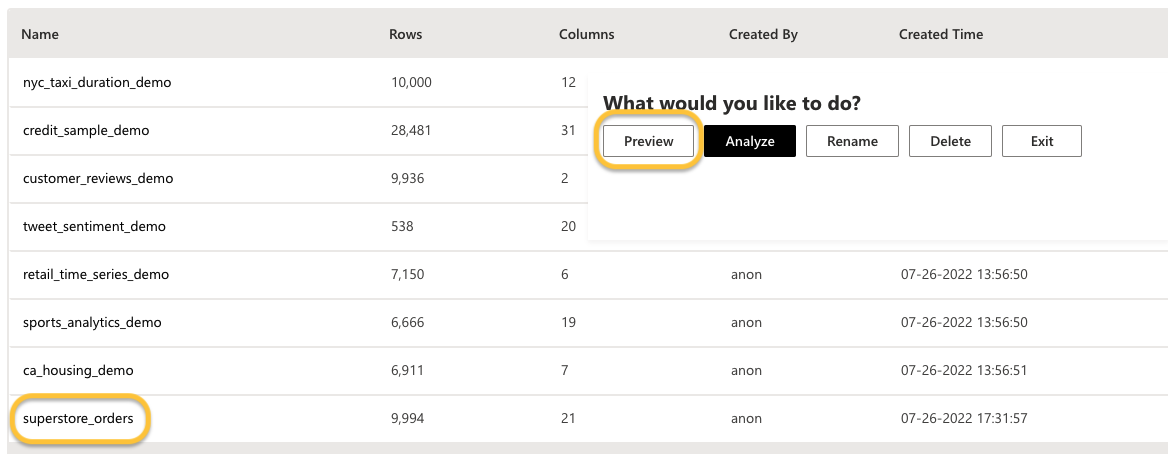
- Click superstore_orders.
- On the What would you like to do? card, click Preview.
To get a detailed summary of the dataset:
- Click Summary.
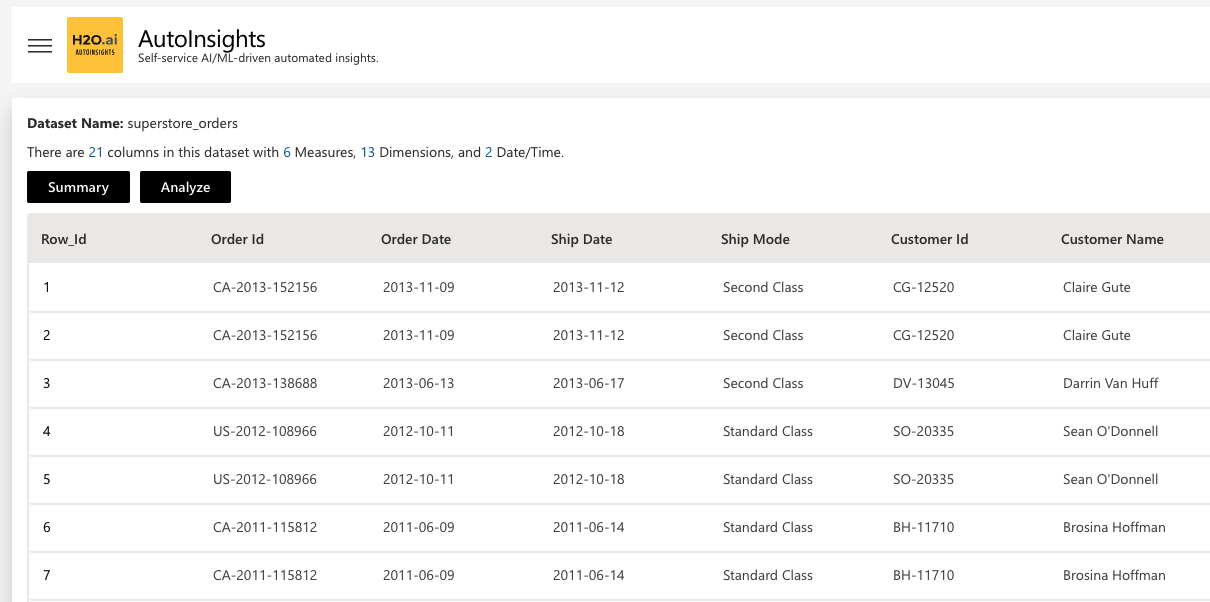
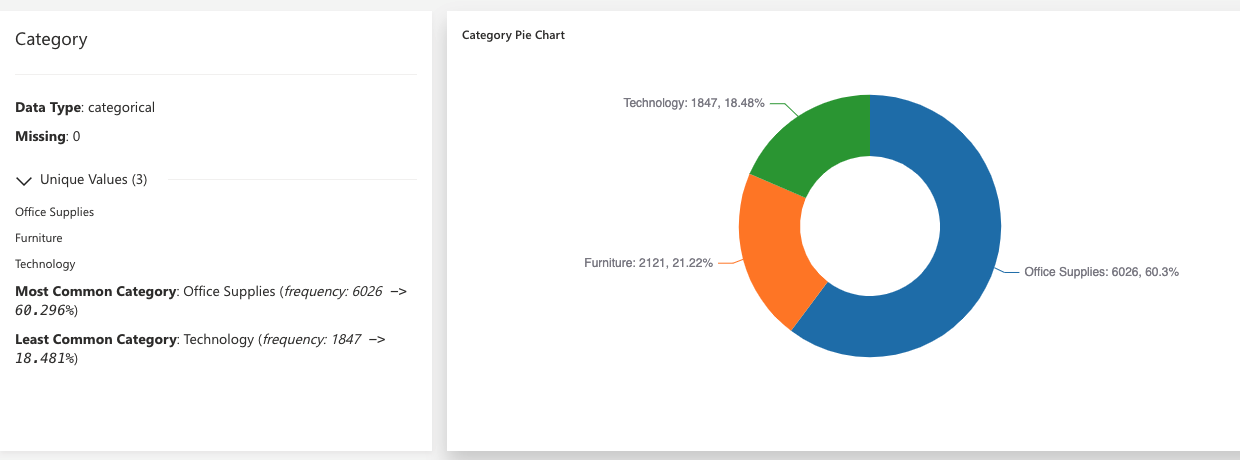
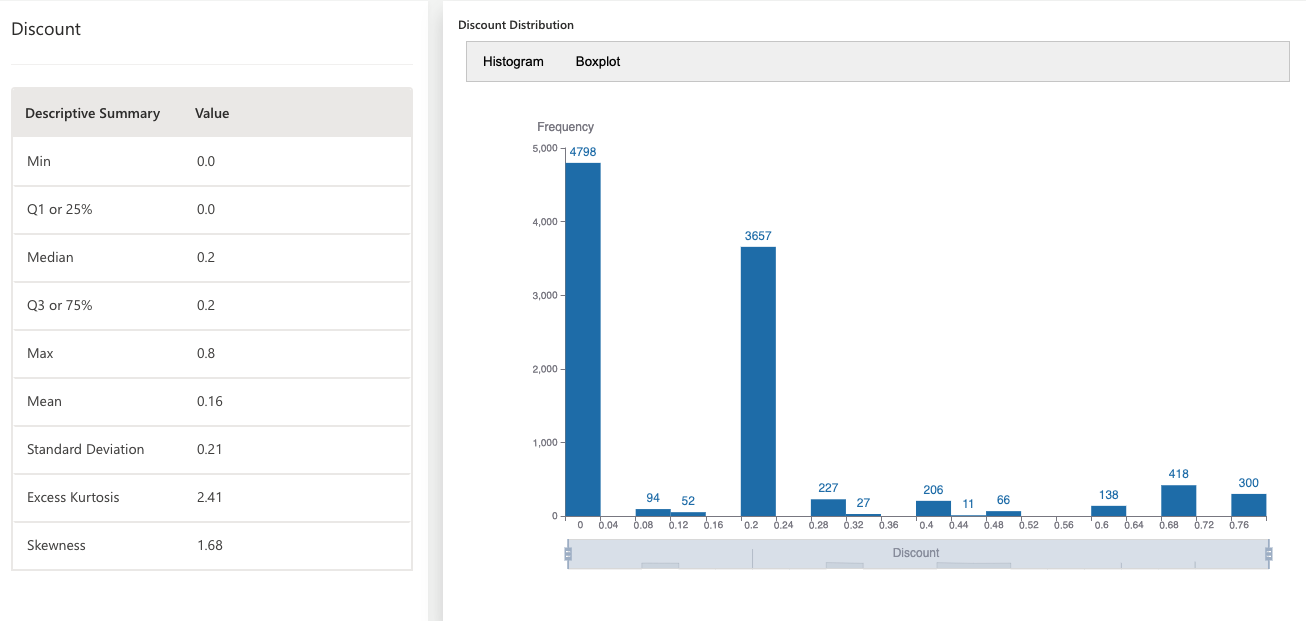
H2O AutoInsights generates a dataset summary by analyzing each column of the dataset.
-
For categorical low cardinality columns, a pie chart is displayed with percentages for all categories, plus a list of all unique values and top/bottom counts.
-
For numeric columns, common descriptive statistics such as min, max, mean, median, quantiles, standard deviation, kurtosis, and skewness are displayed.
- Click Close.
Step 3: Define analysis settings
Now let's analyze the dataset.
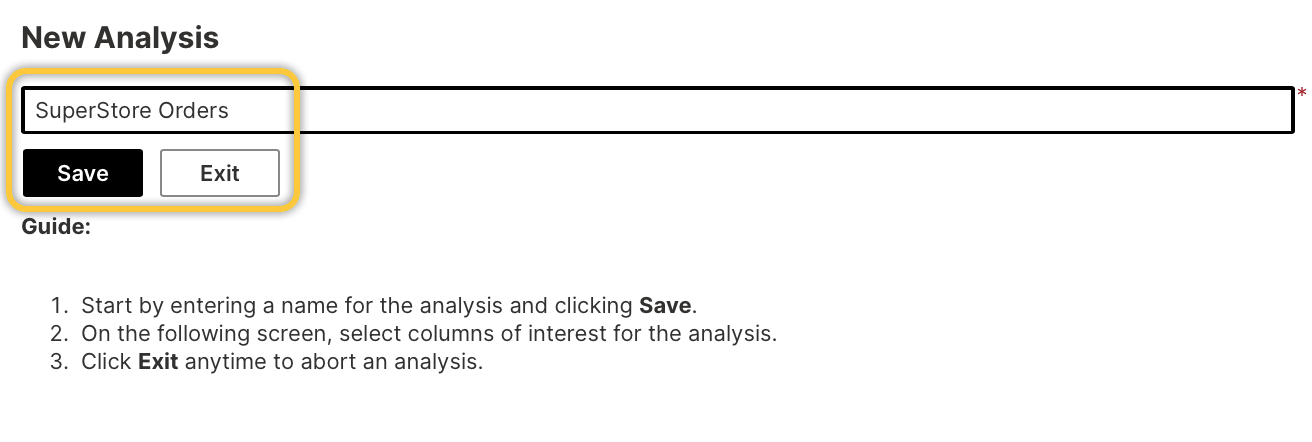
- Click Analyze.
- Name your analysis
SuperStore Orders. - Click Save.
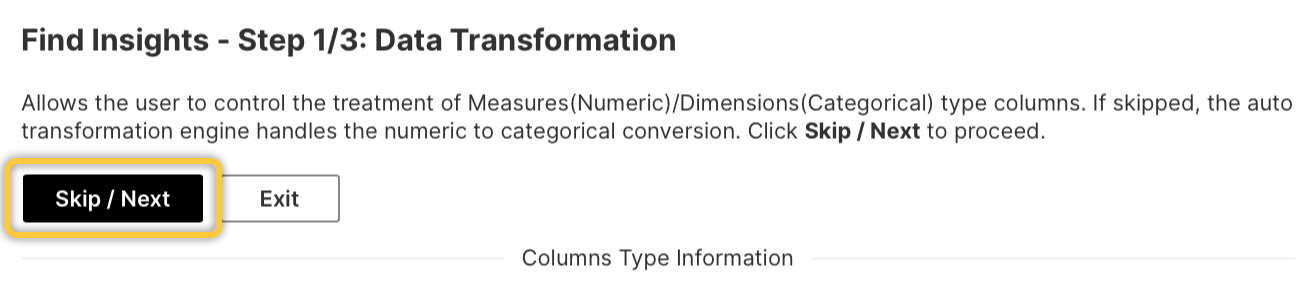
- Click Skip/Next. For purposes of this tutorial, we will skip the data transformation settings.
Now let's select all the columns of the dataset for our analysis.
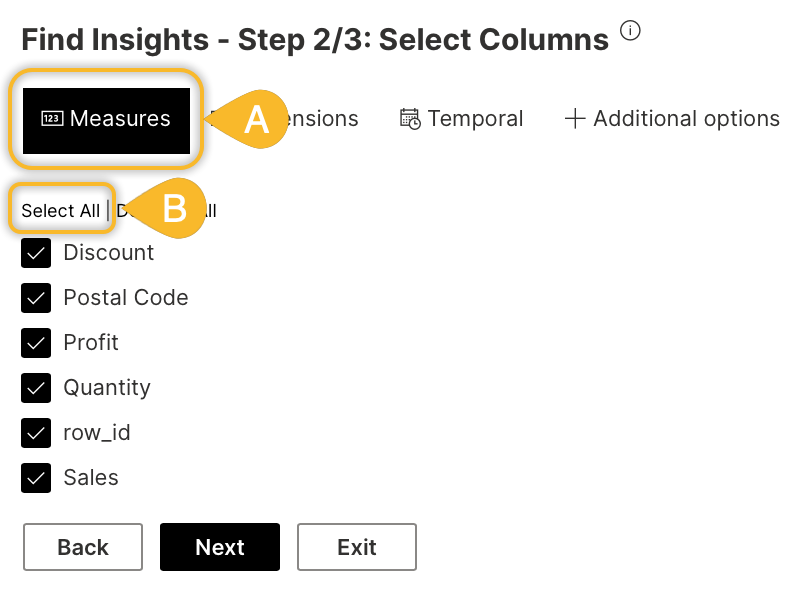
After uploading your dataset and specifying whether to transform specific data columns, H2O AutoInsights enables you to select the columns to analyze.
- In the Measures tab (A), click Select All (B):
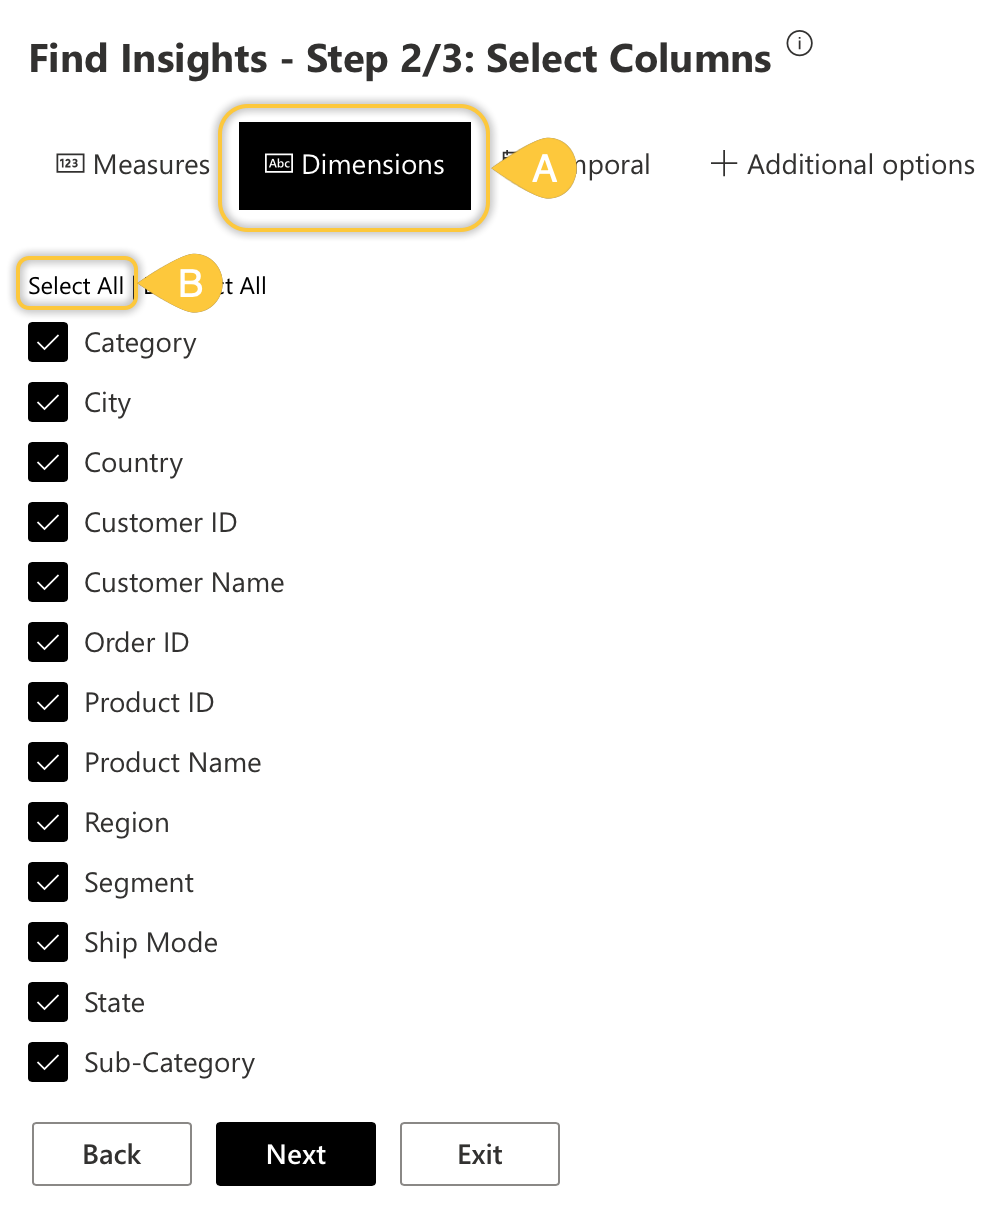
- In the Dimensions tab (A), click Select All (B):
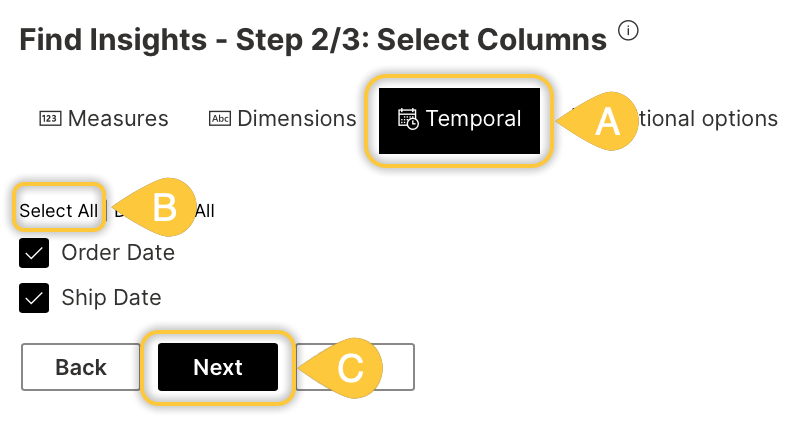
- In the Temporal tab (A), click Select All (B).
- Click Next (C).
Now that you have selected all columns in our dataset, H2O AutoInsights has selected specific analysis types (A) for the H2O AutoInsights analysis based on the data type of the columns. See Supported analysis types to learn about the autoselected analysis types.
With the above in mind, let's start the analysis:
- Click Analyze (B):
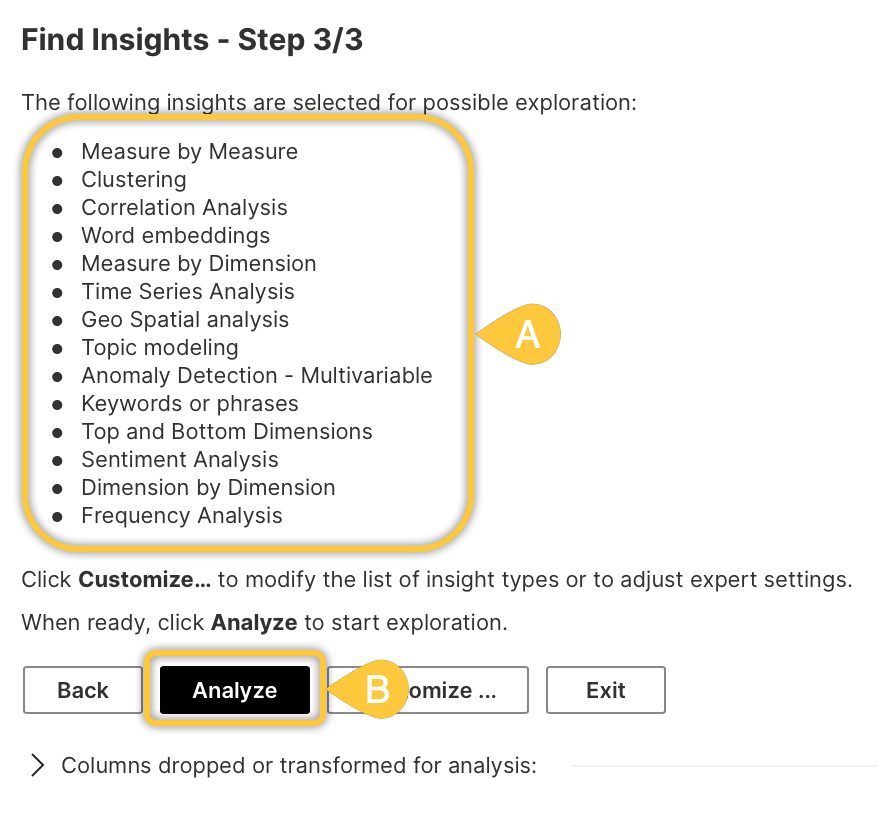
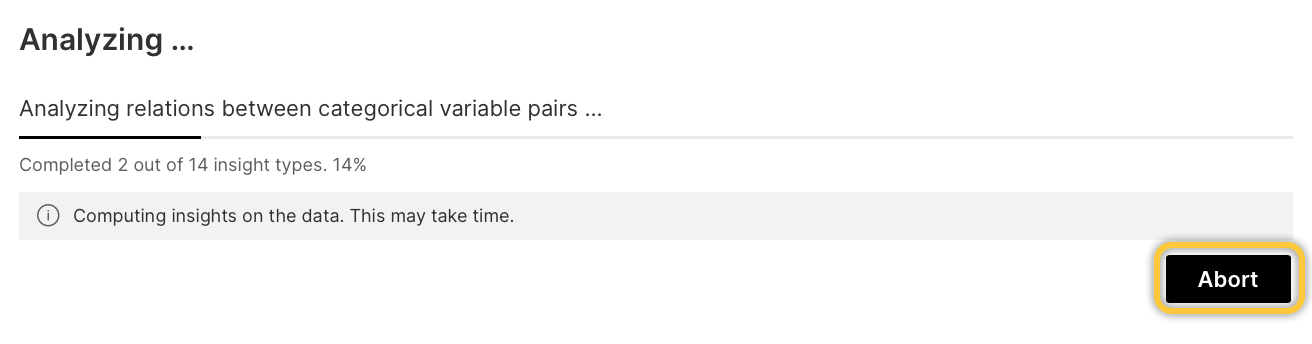
It may take a few minutes for the analysis to complete.
If you want to terminate the analysis for any reason:
- Click Abort.
Step 4: Review completed analysis
Now that our analysis is complete, the storyboard summary contains 38 insights (A) that our analysis has generated. These insights contain new reveling information about the Superstore Orders dataset. To view all 38 insights:
- Click All (B).
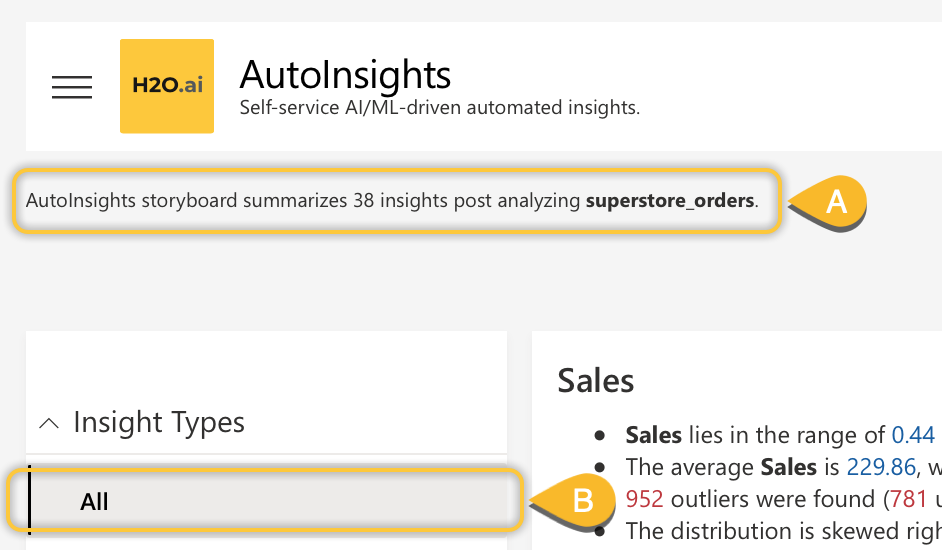
In the Insights Types navigation menu, you can find one of the 38 insights in its respective analysis type category.
As an example, and to highlight the power of H2O AutoInsights, let's see the insights discovered from the shallow Profit column. Recall, the Profit column contains numerical values that provide limited to no insights at first sight.
The Geographic Analysis category has generated several maps; in particular, it has developed a map displaying valuable insights about the Profit column, let's see.
-
In the Insight Types navigation menu, click Geo Spatial Analysis.
-
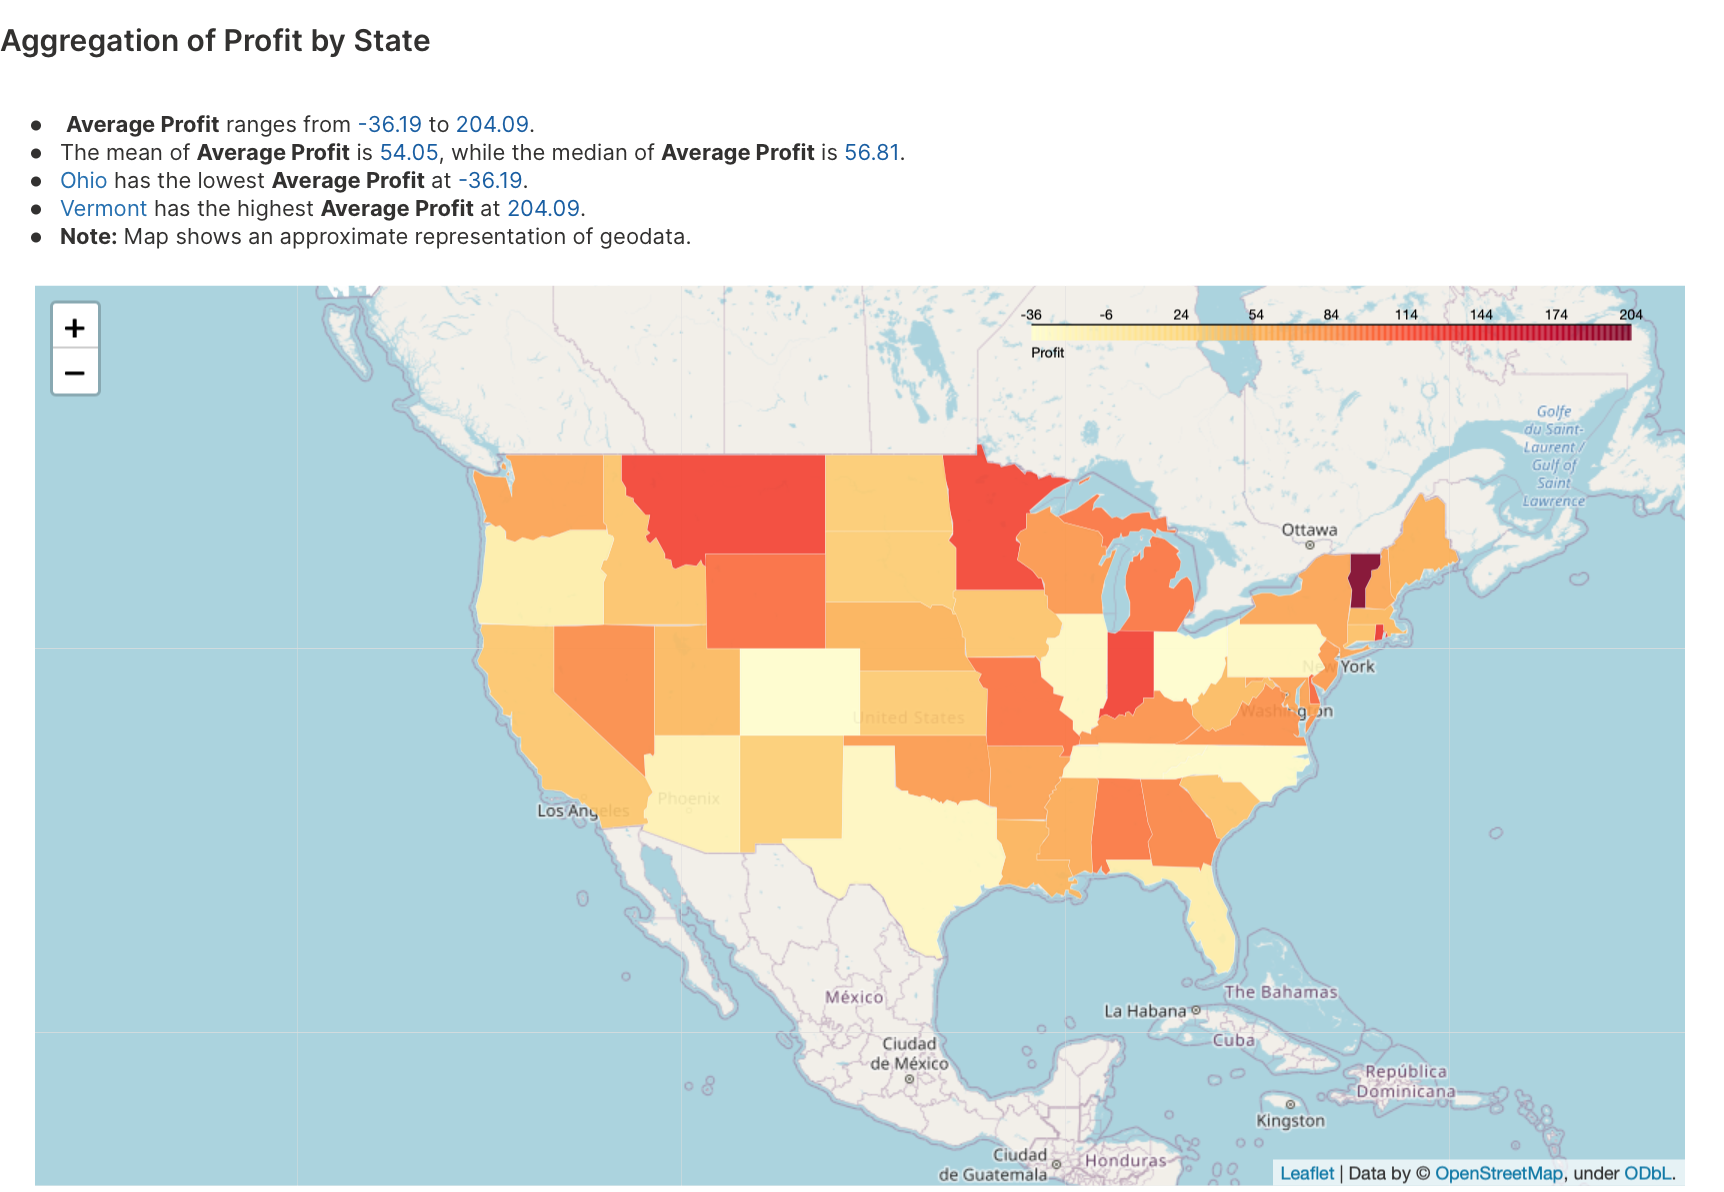
In Geo Spatial Analysis category, scroll down to the Aggregation of Profit by State card.
- According to the Aggregation of Profit by State map:
- Average Profit ranges from -36.19 to 204.09
- The mean of Average Profit is 54.05, while the median of Average Profit is 56.81
- Ohio has the lowest Average Profit at -36.19
- Vermont has the highest Average Profit at 204.09
- According to the Aggregation of Profit by State map:
Like the above insight, other 37 insights are available. You can understand the insights through interactive visuals and simple narrative summaries that clarify and elevate the value of the Superstore Orders dataset.
Summary
In a matter of minutes, you generated 38 insights that range from geographic to sentiment insights. You elevated the value of the Superstore Orders dataset in the span of a few minutes. Well done!
Above all, you learned that H2O AutoInsights could quickly discover hidden insights in a dataset. You also found that H2O AutoInsights provides several analysis types to understand a dataset. The knowledge you have gained from this first tutorial should give you the confidence to use H2O AutoInsights anytime you want to understand a dataset.
- Submit and view feedback for this page
- Send feedback about H2O AutoInsights to cloud-feedback@h2o.ai