Metrics: Robustness
Overview
H2O Model Validation offers an array of metrics to understand a robustness test. Below, each metric is described in turn.
Metrics
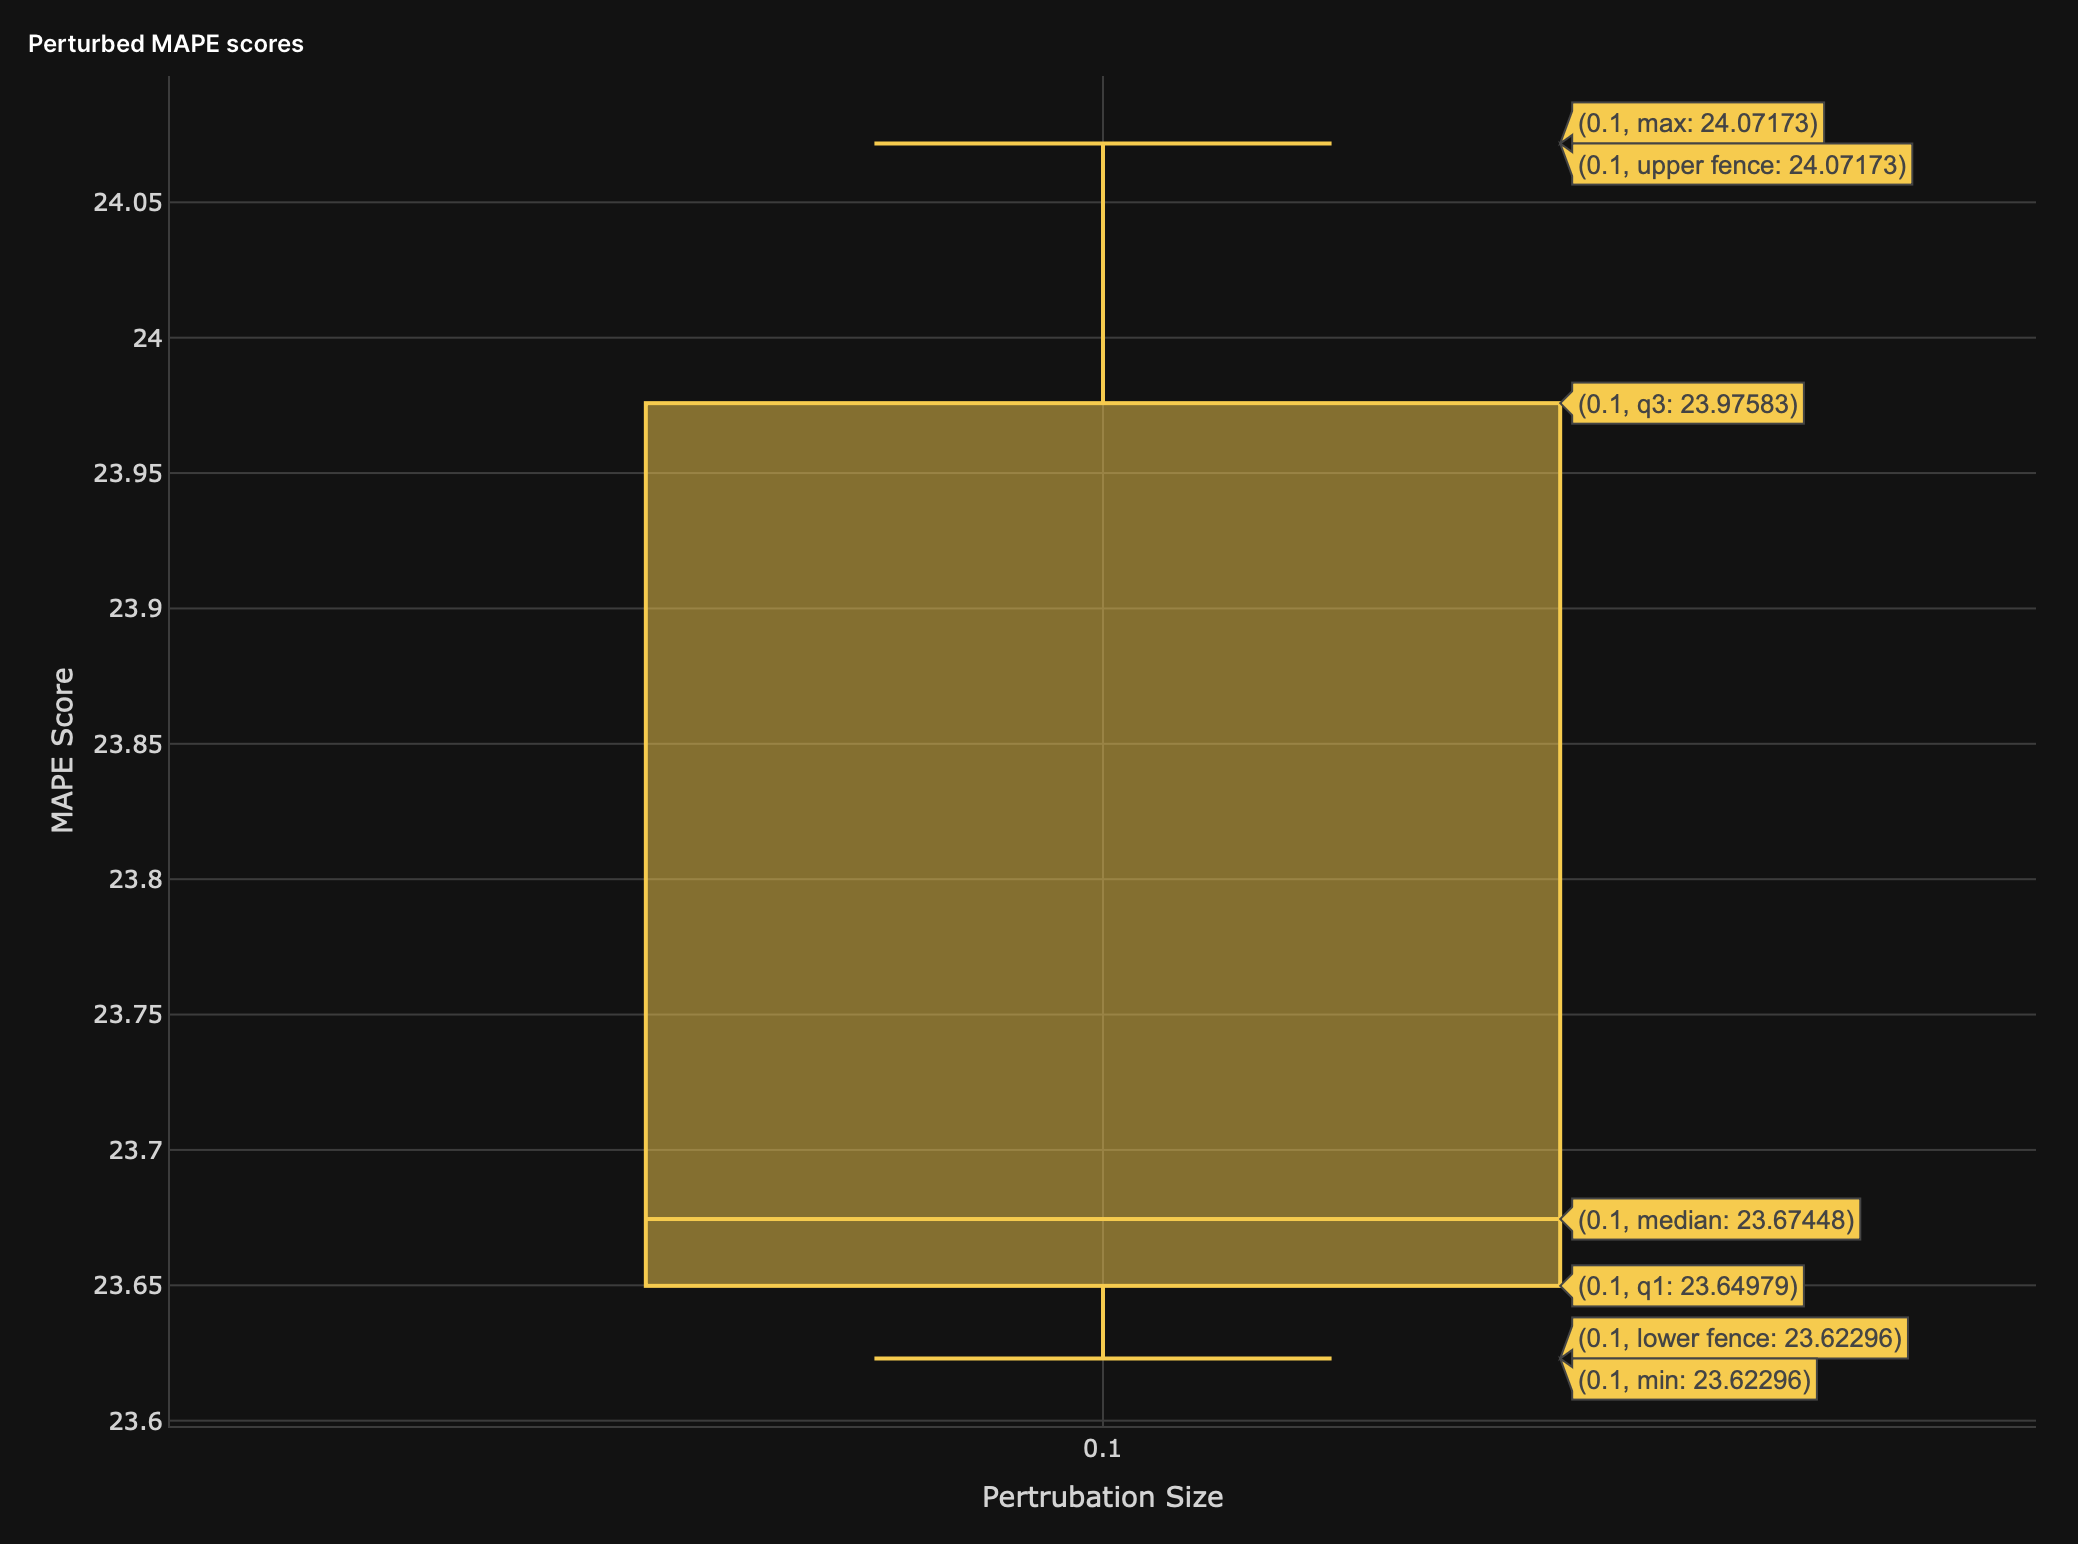
Perturbed {metric} scores
The perturbed {metric} scores box and whisker plot illustrate the quartile, median, third quartile, and maximum value of the perturbated model scores obtained from each generated perturbed dataset. In this case, the {metric} refers to the model's metric (scorer).
- X-axis: The x-axis represents the size of the perturbations.
- Y-axis: The y-axis represents the corresponding performance (metric scores) of the model.
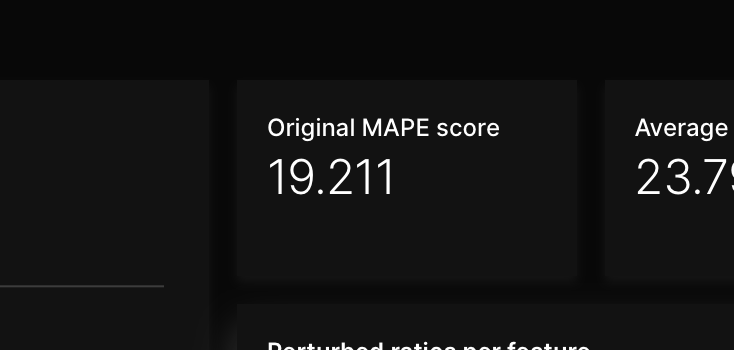
Original {metric} score
The original {metric} score card displays the original model score. In this case, the {metric} refers to the model's metric (scorer).
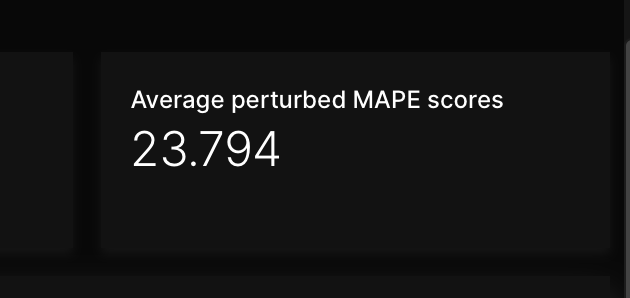
Average perturbed {metric} scores
The average perturbed {metric} scores card displays the average perturbed model scores. In this case, the {metric} refers to the model's metric (scorer).
Perturbed ratios per feature
The perturbed ratios per feature chart displays the average perturbation ratio per feature.
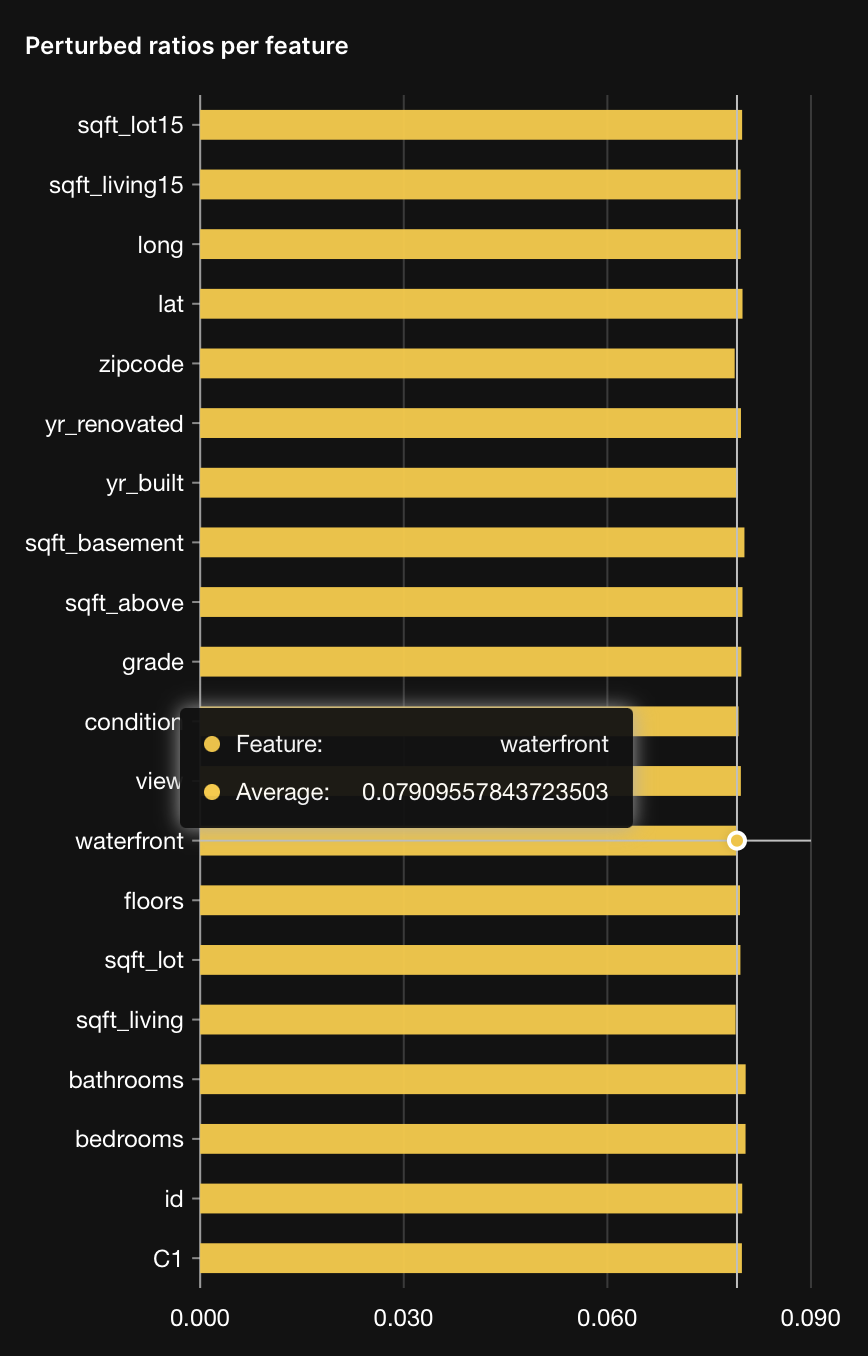
Based on the type of a feature (categorical or numerical) and the perturbation method (raw or quantile for numerical features), calculated perturbation ratios may differ from perturbation sizes.
- Submit and view feedback for this page
- Send feedback about H2O Model Validation to cloud-feedback@h2o.ai