Tutorial 5A: Drill down to RAG weaknesses with eval eye
Overview
This tutorial demonstrates how to use eval eye, a visual tool for analyzing the results of RAG (Retrieval-Augmented Generation) system evaluations. It allows you to quickly identify and pinpoint the root causes of performance issues by providing an intuitive, multi-layered view of your evaluation results.
Objectives
- Use the eval eye to drill down into RAG weaknesses.
- Identify problem domains (e.g., generation, retrieval, privacy, fairness, summarization, or classification).
- Pinpoint evaluators whose metrics the RAG system failed to pass.
- Review failed test cases along with all relevant metadata and visualizations to understand the root cause of the failures.
Prerequisites
- Access to Enterprise h2oGPTe
- Access to H2O Eval Studio
- Enterprise h2oGPTe API Key
- Basic understanding of LLMs and evaluation metrics
Step 1: Open an existing evaluation
To begin, you need to access an existing evaluation within H2O Eval Studio.
- On the H2O Eval Studio navigation menu, click Evaluations.
- Filter the evaluations by type: Standalone, Workflow, All, or Shared with me.
- Select the evaluation you wish to analyze from the list.
- The detailed evaluation page opens.
Step 2: Open an eval eye
Now, let's open the eval eye visualization on the evaluation page.
- Click the Evaluation tab.
- The eval eye visualization opens, providing a top-level overview of your evaluation results.
Step 3: Review top level eval eye overview
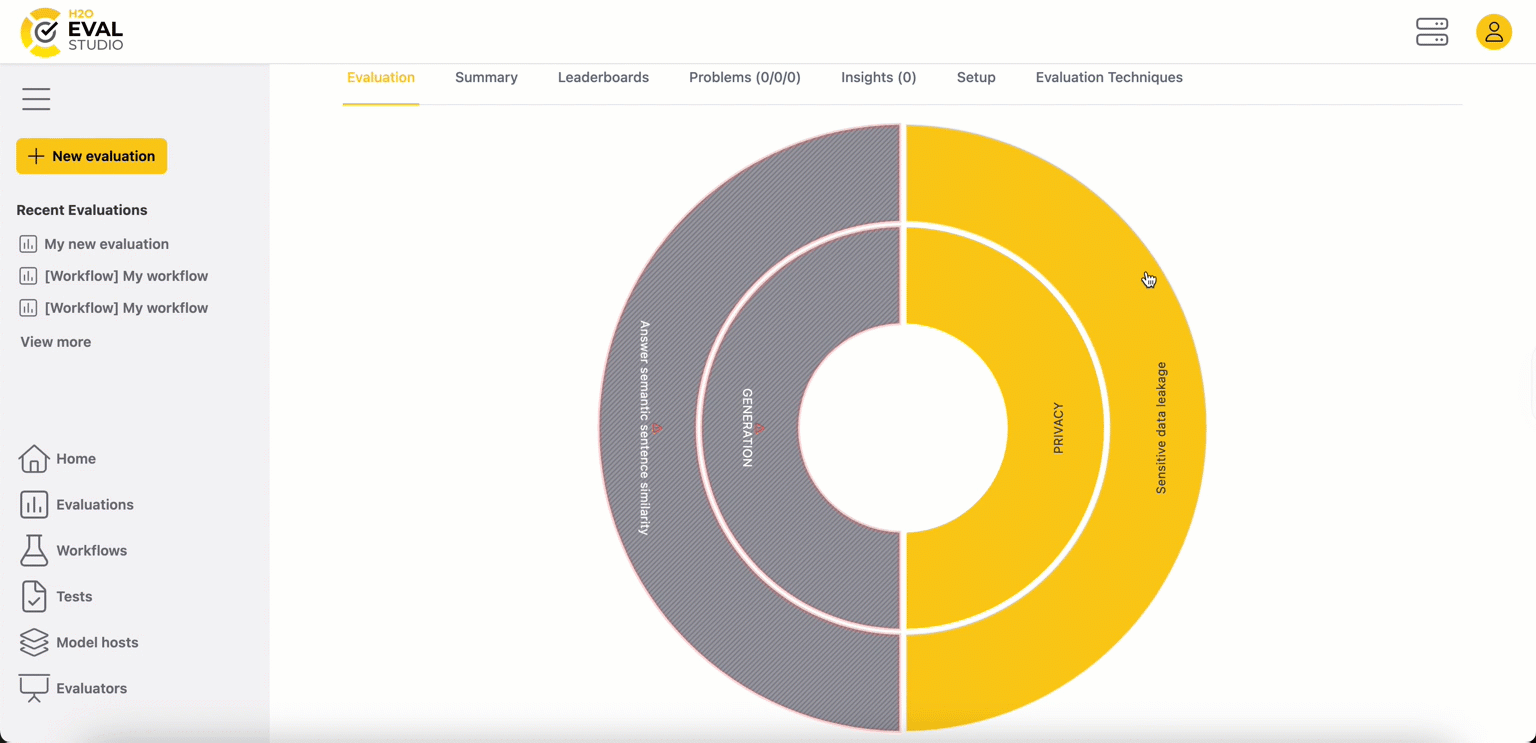
The eval eye is a hierarchical, circular visualization. At the top level, it provides a high-level summary of your evaluation's health.
- Inner circle: This circle represents the problem domains (e.g.,
generation, retrieval). Each segment has an indicator:
- OK (yellow): The RAG system performed well in this domain.
- Problematic (gray with red blinking border): This domain contains one or more failures, indicating an area that needs attention.
- Outer circle: This circle represents the evaluators for the inner
circle domain used in your evaluation. Each segment has an indicator:
- OK (yellow): The RAG system passed the metrics for this evaluator.
- Problematic (gray with red blinking border and a number): The system failed one or more metrics (average metric score value above/below threshold) for this evaluator. The number indicates the count of problems, and its color corresponds to the highest severity of a problem detected.
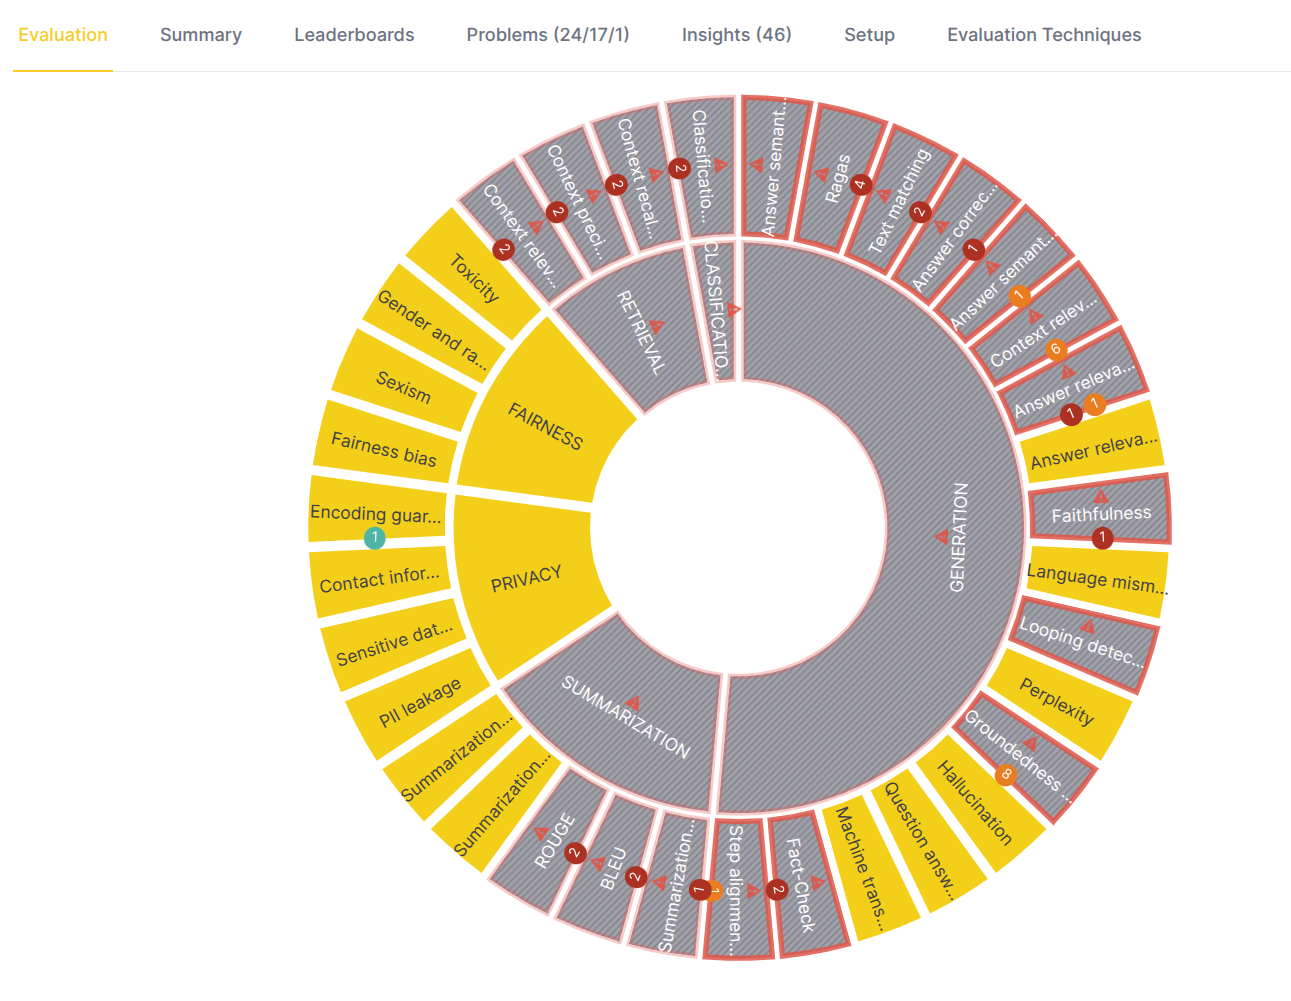
Example (eval eye above):
- Eval eye indicates that the Generation domain (RAG's component which is responsible for generating actual answers) is problematic - the RAG system failed one or more metrics for this domain.
- The Fairness and Privacy domains are OK, indicating that the RAG system performed well.
- Evaluators' colors in the outer circle indicate which evaluators caused that particular domain is considered problematic.
- Logical next step is to choose one of the evaluators which caused the domain to be problematic and drill down to it.
Step 4: Drill down to the problem domains
To investigate a specific problem domain, click on its segment in the inner circle. The eval eye now focuses on that domain, and the view updates:
- Center label: The name of the selected problem domain. For example, "Generation".
- Inner circle: Now represents the evaluators within this domain.
- Outer circle: Now represents the specific evaluation metrics associated with the evaluators in the inner circle.
- Center actions:
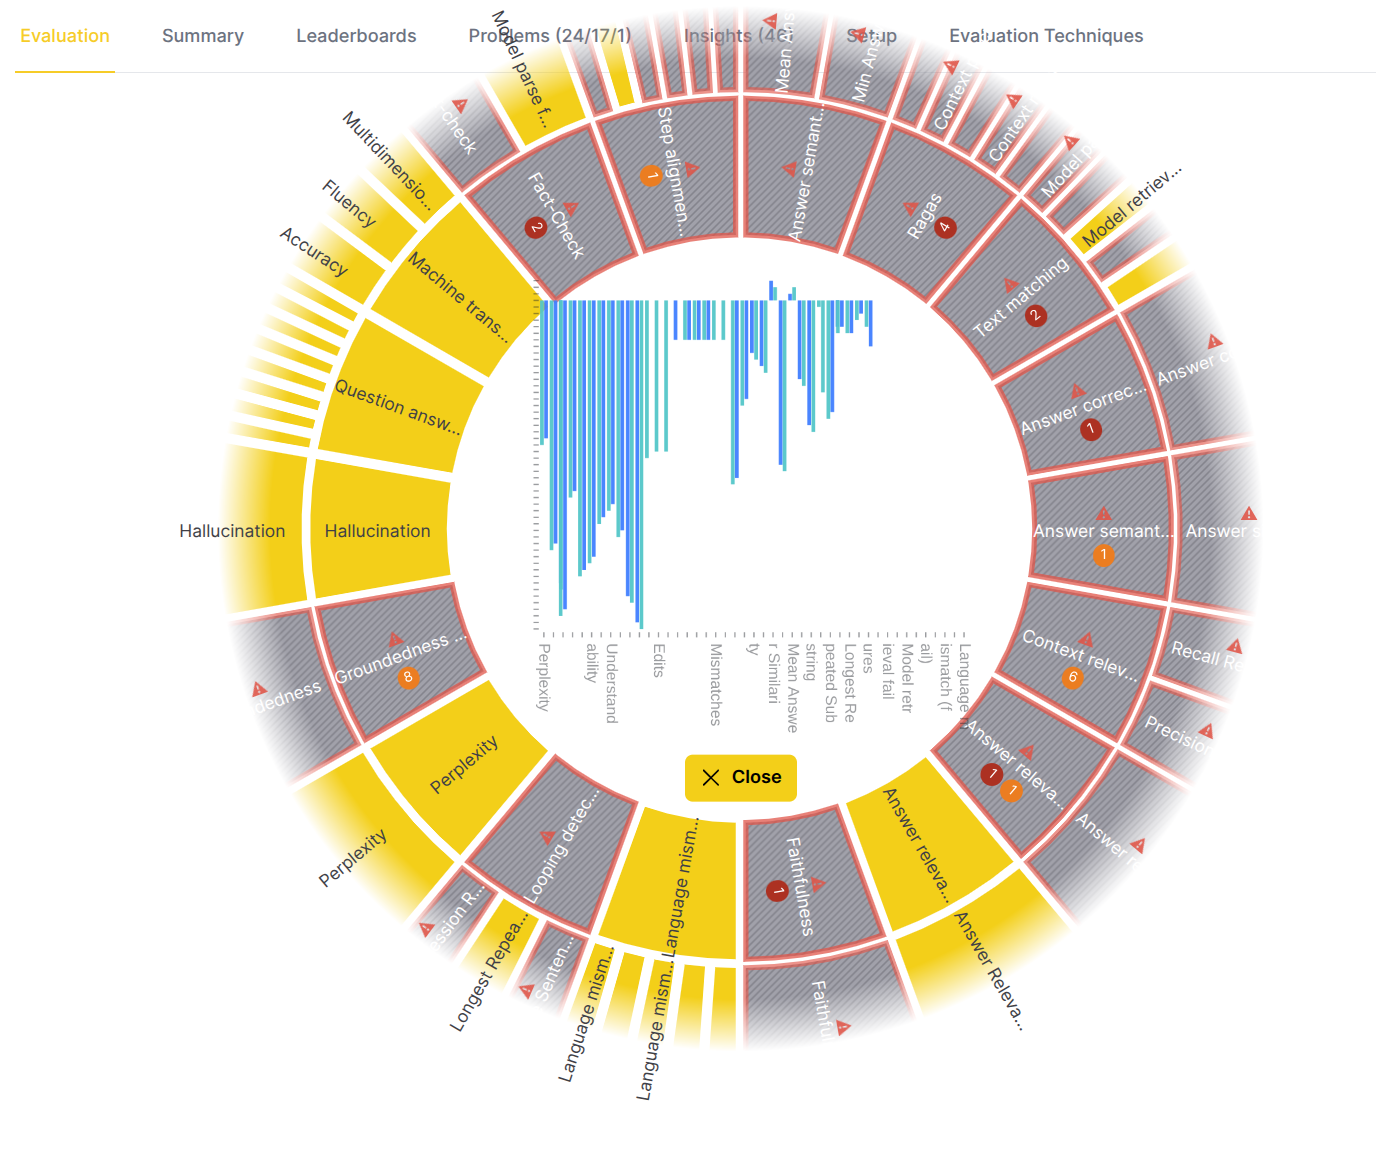
- Hover: Hover over the center of the circle to display a bar chart. The x-axis shows the primary evaluator metrics, the y-axis shows the scores, and each bar represents a different evaluated model. This helps you quickly compare model performance across the domain.
- Back icon: Click the back icon to move one level up in the visualization, returning to the top-level overview.
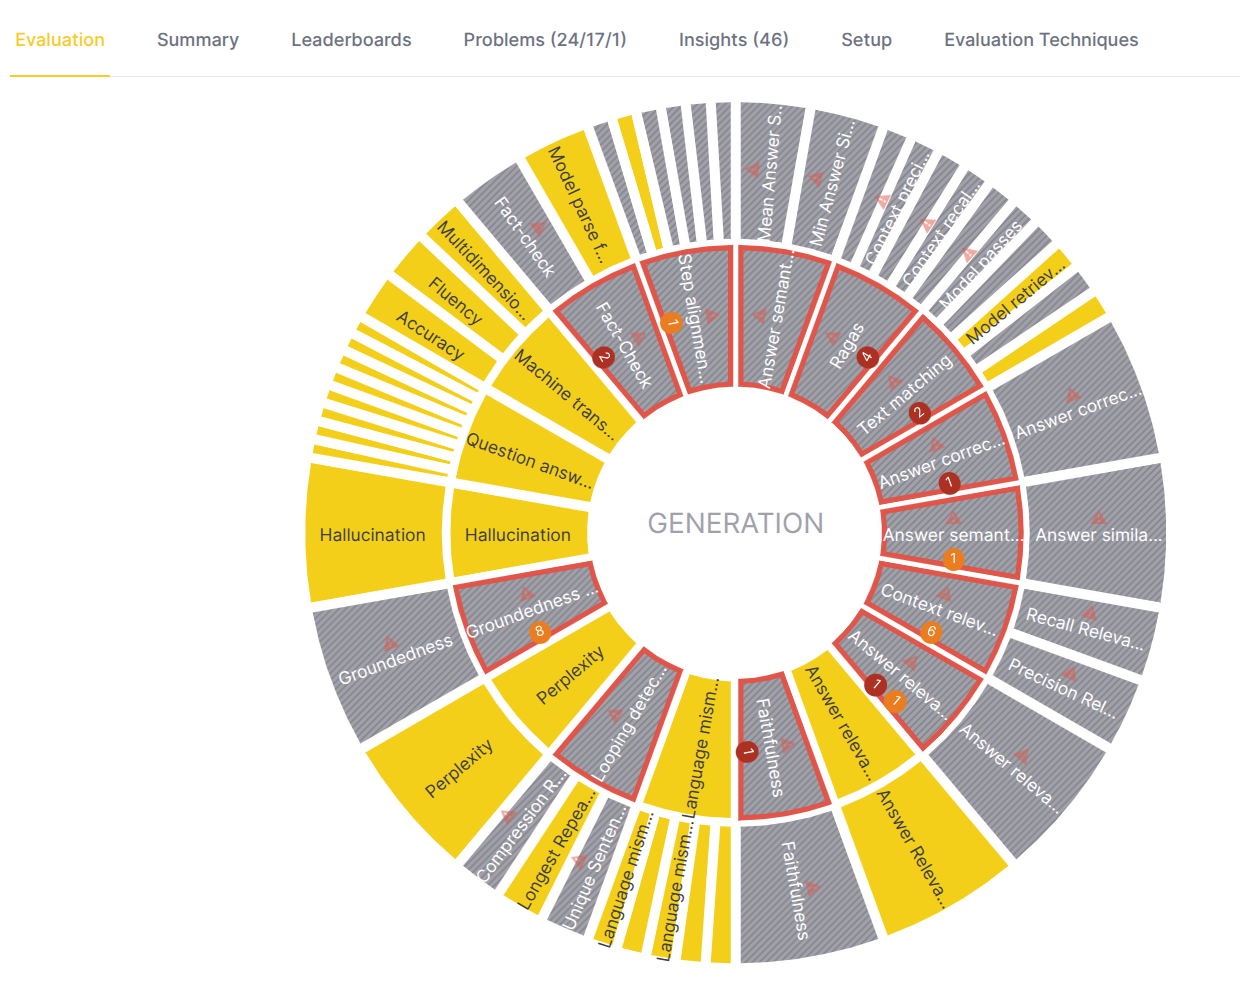
Example (eval eye above):
- Eval eye indicates that the Faithfulness, Groundedness, RAGAs and Text matching are among the evaluators which detected a problem in the Generation domain.
- The Hallucinations and Perplexity are among the evaluators which did not find problems worth to review.
- Metrics' colors in the outer circle indicate which metrics caused that the evaluator detected a problem.
- Logical next step is to choose one of the metrics which caused the evaluator to be problematic and drill down to it.
Example (eval eye below):
- Before drill down to one of the metrics it is worth to review the bar chart to understand the distribution of metric scores across the evaluated models.
- Metrics name on the x-axis allow quick navigation to high/low values - by hovering over the bars it is possible to find out which models have problematic scores. The chart indicates that the RAG is strong in the Perplexity and overall understandability of the generated text.
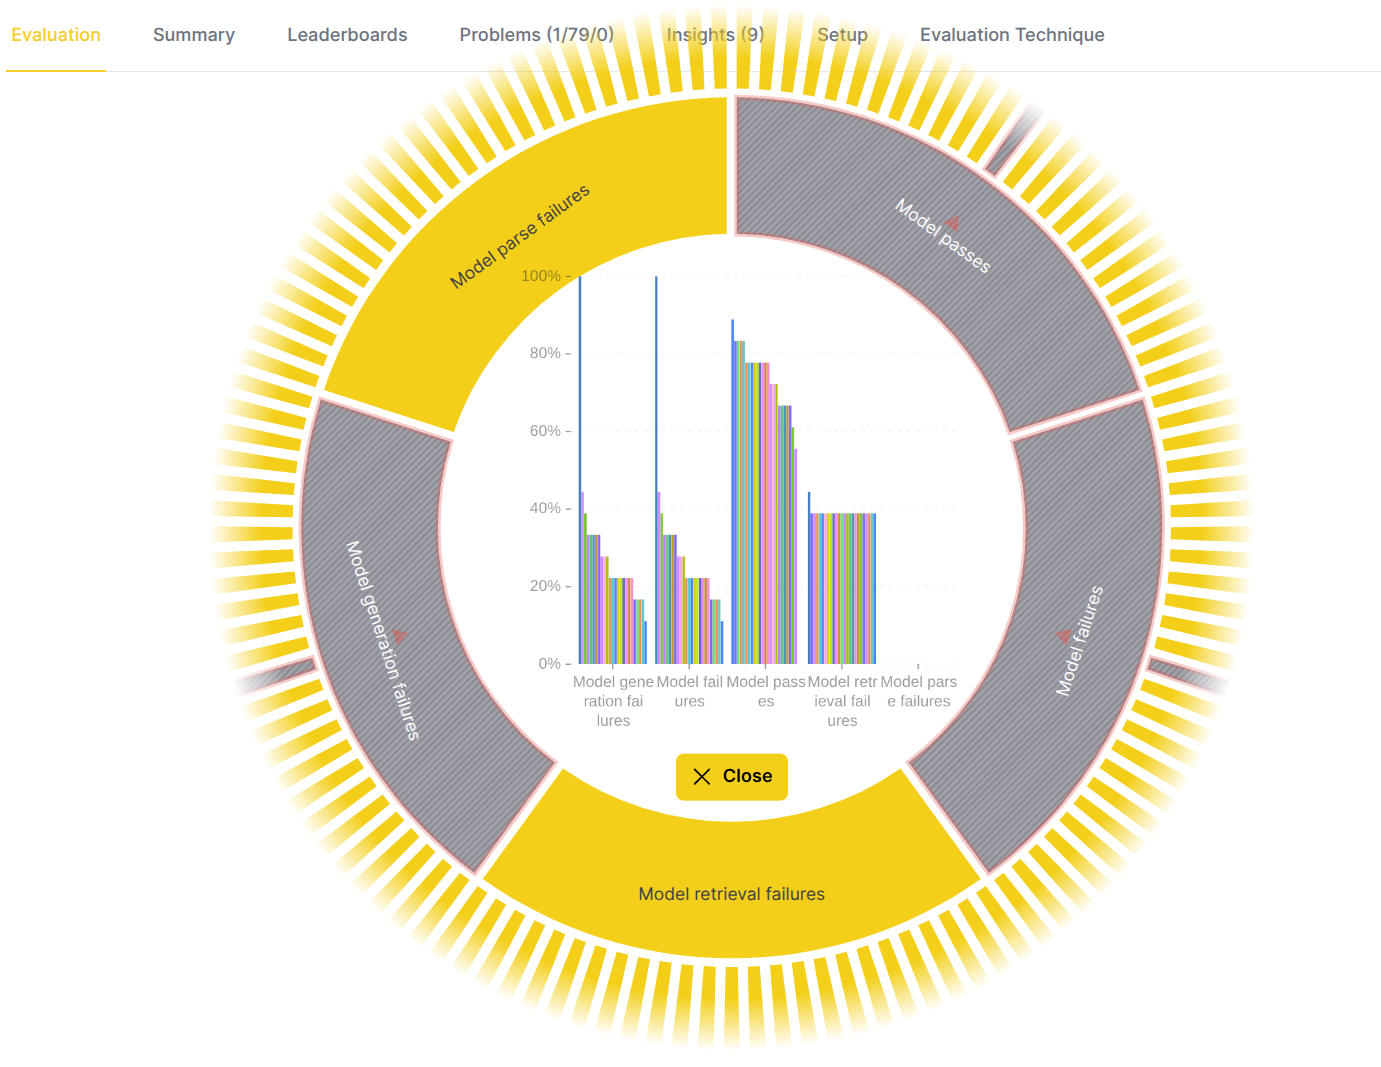
Step 5: Drill down to an evaluator
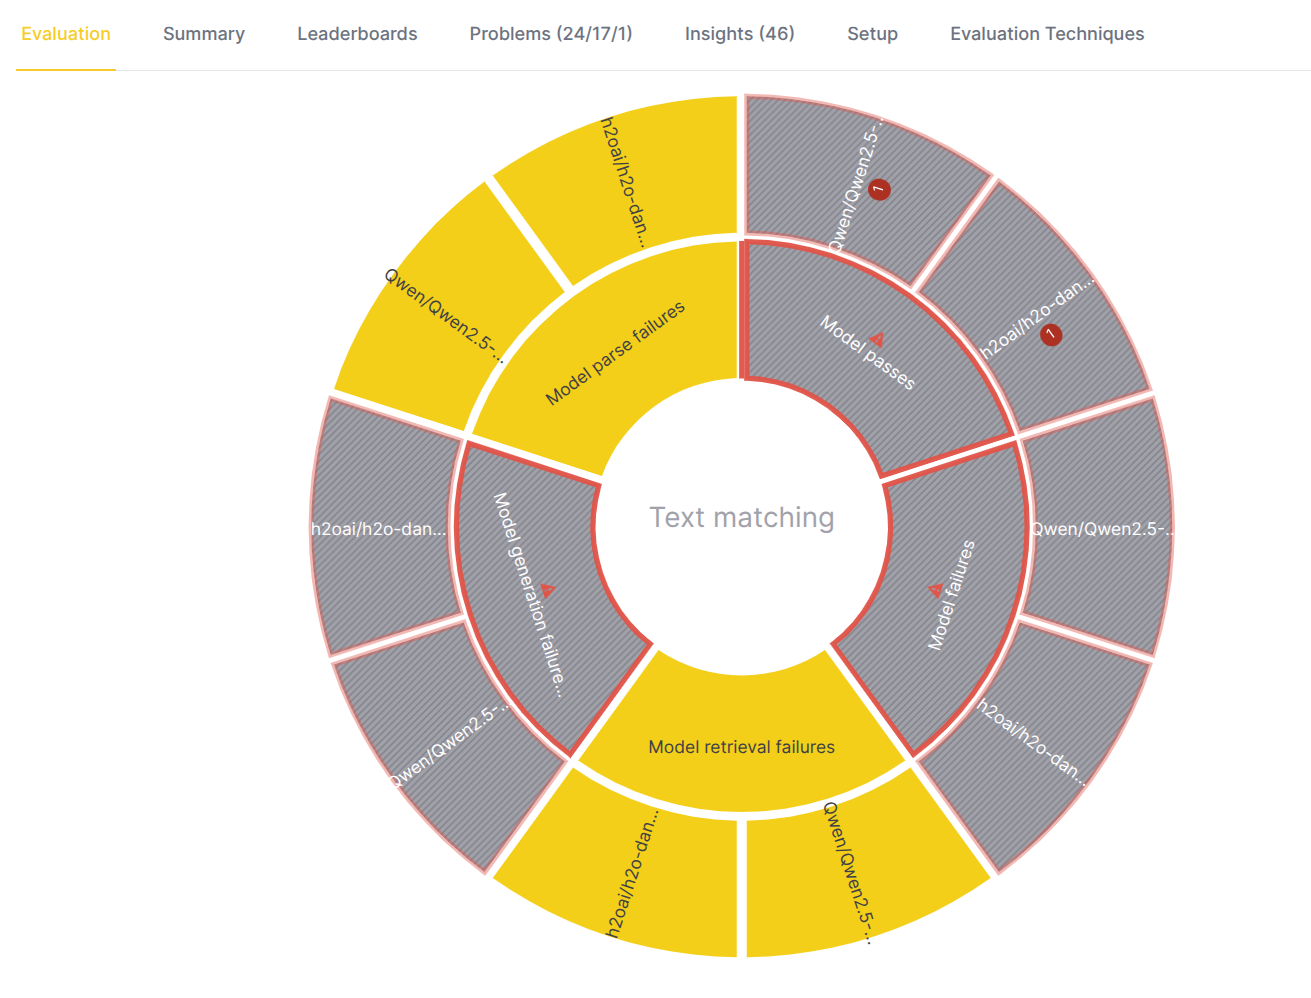
From the problem domain view, click on a specific evaluator in the inner circle to focus on its metrics.
- Center label: The name of the selected evaluator. For example, "Text matching".
- Inner circle: Displays the specific metric names calculated by this evaluator.
- Outer circle: Displays the evaluated LLM model names.
- Center actions:
- Hover: Hover over the center to see a bar chart comparing the evaluator's metrics scores for each evaluated model - metric on x-axis, score on y-axis, bar per evaluated model.
- Back icon: Click to go back to the problem domain view.
Example (eval eye above):
- Eval eye indicates that there were no problems with the retrieval of the context (for RAG models)
- However, the Text matching evaluator detected a problem in the generation - Model passes metric color indicates that the RAG system failed to pass the metric as the answer didn't satisfy the conditions (did not match) used by the evaluator to evaluate the responses.
- Model names in the outer circle indicate which models failed the metric, and also allows quick navigation to the metric scores.
- Logical next step is to choose one of the metrics using which the evaluator was able to find a problem and drill down to it.
Example (eval eye below):
- Before drill down to one of the metrics it is worth to review the bar chart to understand the distribution of metric scores across the evaluated models. By hovering over the bars it is possible to quickly find out which models have high/low average metric score.
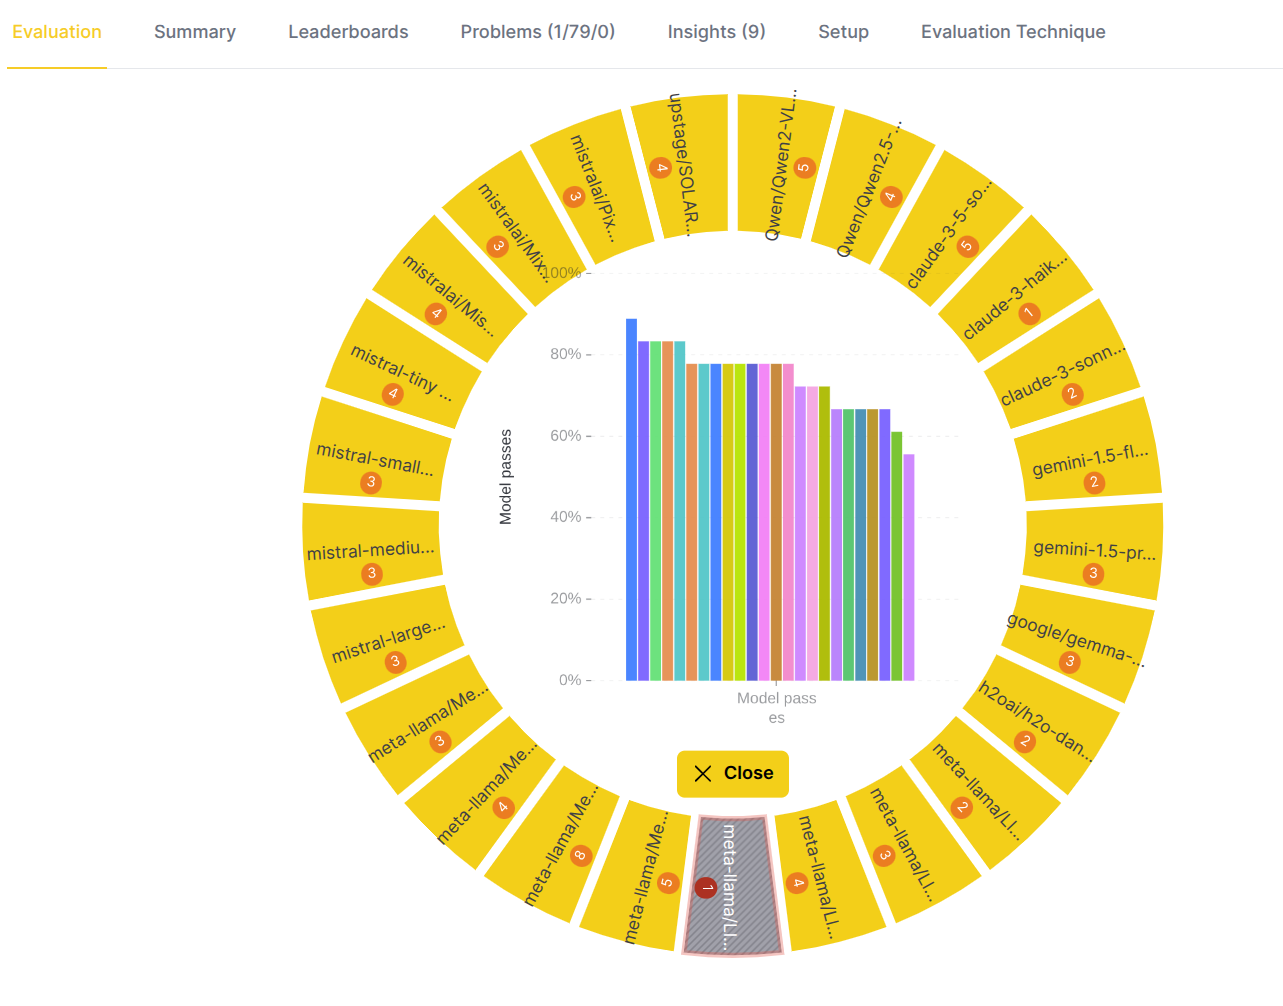
Step 6: Drill down to an evaluation metric
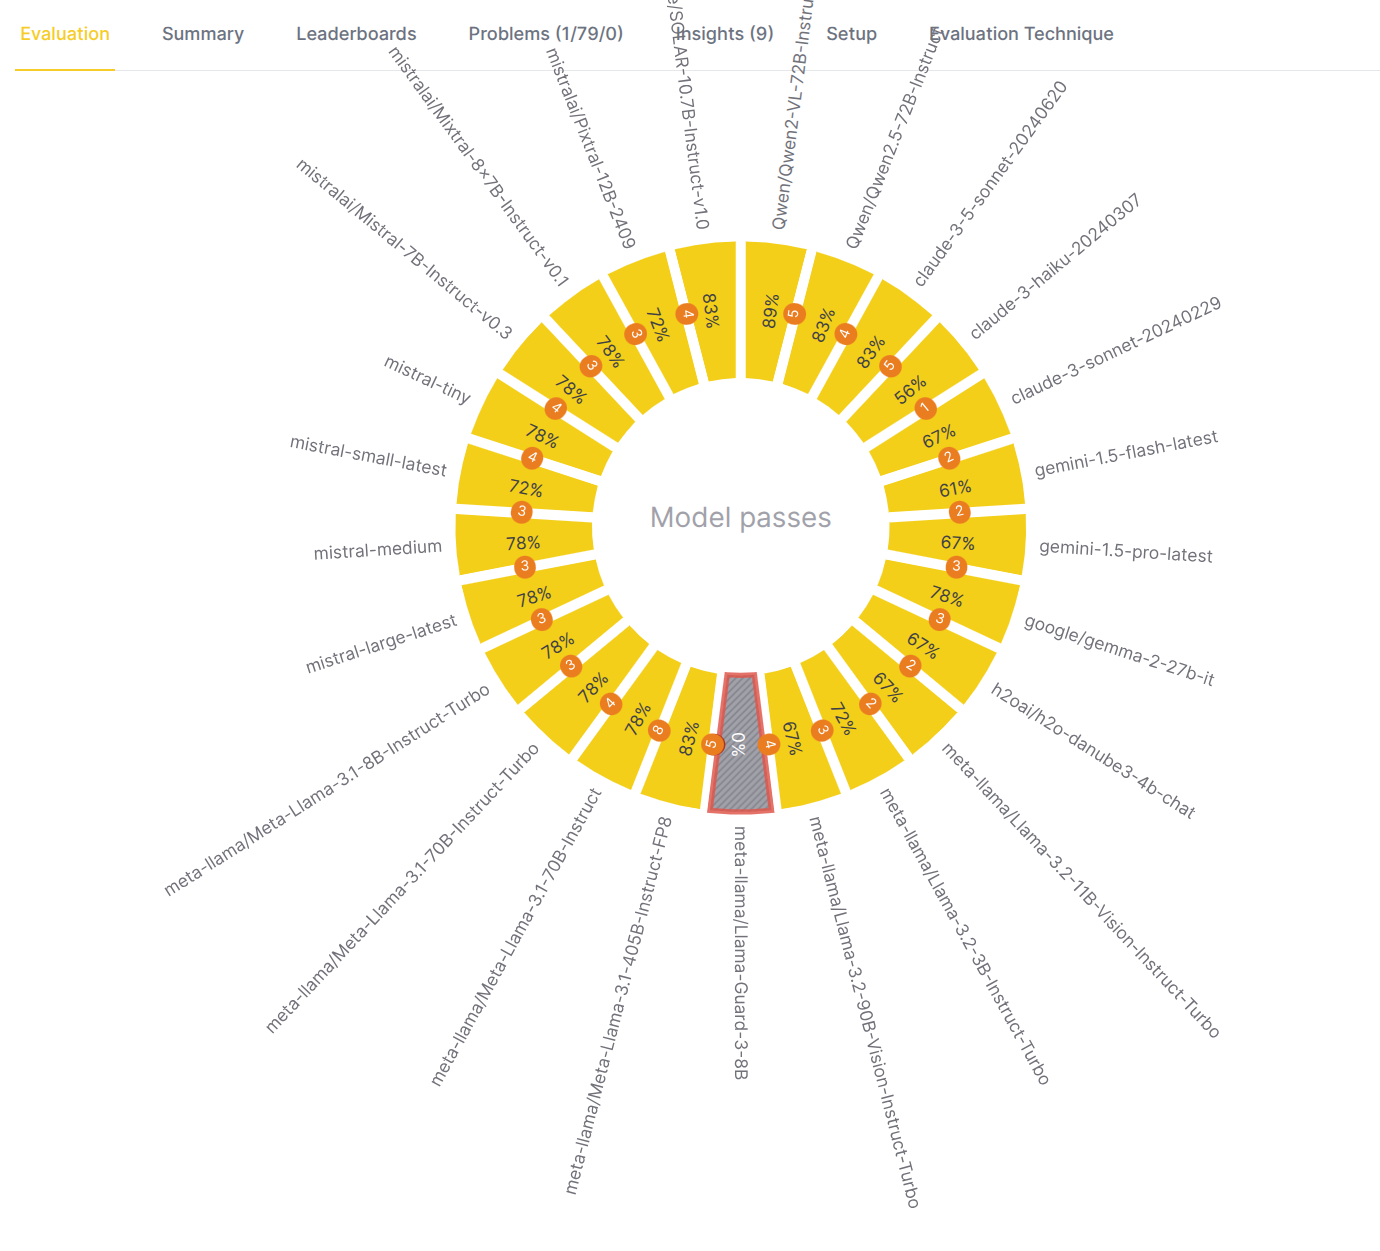
To examine a single metric in detail, click on its segment.
- Center label: The name of the selected evaluation metric. For example, "Model passes" (in this case it indicates that actual answer satisfies condition with AND/OR/NOT operators and regexp operands).
- Inner circle: Displays the metric scores.
- Outer label: Shows the name of the evaluated LLM model whose metric scores are displayed in the inner circle.
- Center actions:
- Hover: Hover to see a bar chart with per-LLM model metric scores - chosen metric on x-axis, scores on y-axis, bar per evaluated LLM model.
- Back icon: Click to go back to the evaluator view.
Example (eval eye above):
- Eval eye indicates that meta-llama/Llama-Guard-3-8b model failed the Model passes metric.
- Other models passed the metric and their average metric score is above the threshold.
- Logical next step is to choose the problematic models to drill down to and find out what is the root cause of the problem.
Example (eval eye below):
- Before drill down to one of the models it is worth to review the bar chart to understand the distribution of metric scores across the evaluated models. By hovering over the bars it is possible to quickly find out which models have high/low average metric score.
Step 7: Drill down to an evaluated model
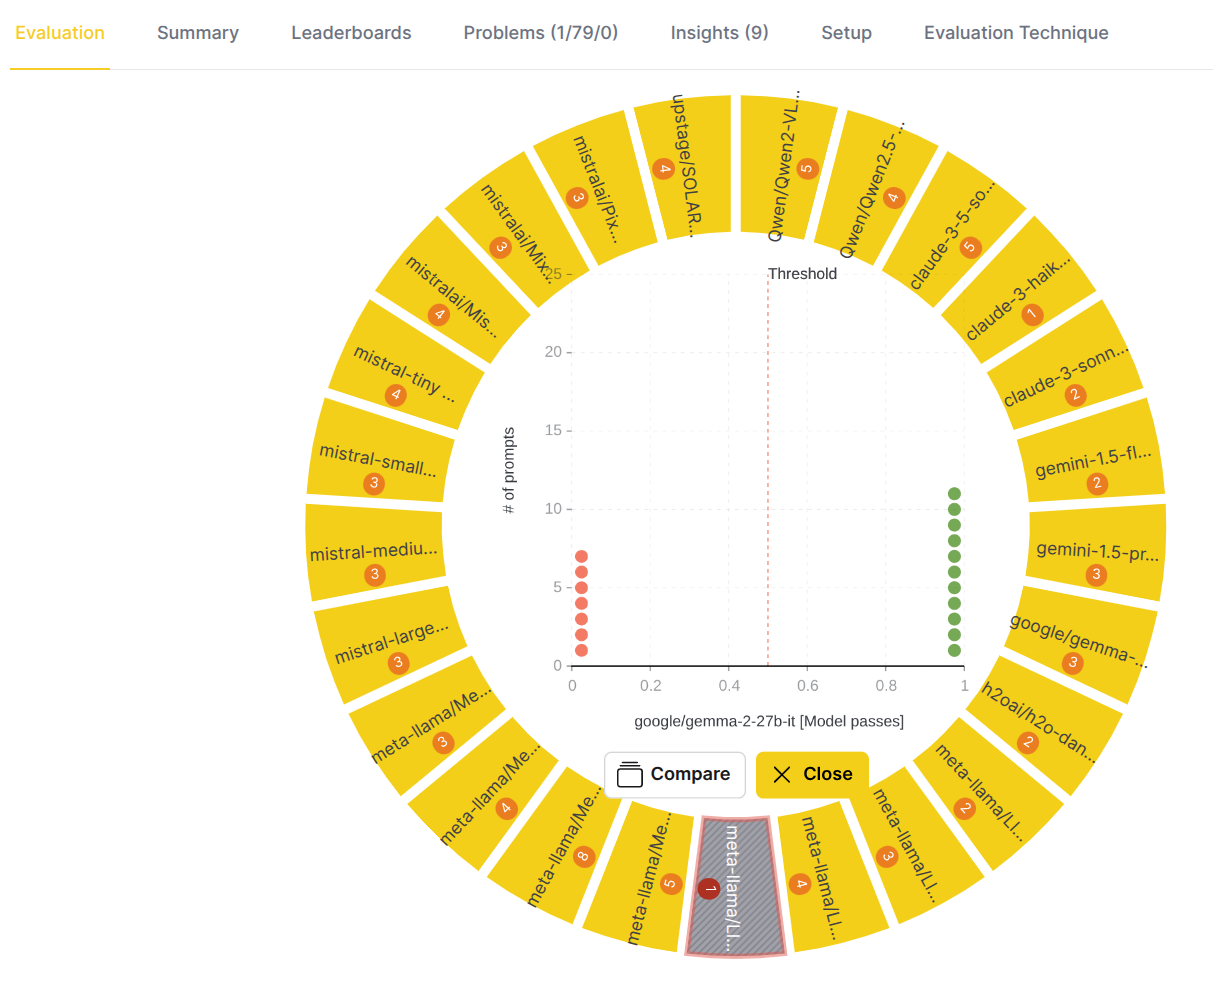
To understand how a specific model performed on a metric, click on the model name in the outer circle.
- Center chart: A dot chart appears, providing a detailed view of the test cases.
- The x-axis represents the score.
- The y-axis represents the number of test cases with that score.
- Each dot is a test case, with its color indicating the score level (ranging from red for low scores to green for high scores).
- A vertical line indicates the threshold score for passing.
- Center actions:
Compare: This allows you to compare this metric's performance with another evaluation metric.Close: This action closes the chart and moves you one level up.
Example (eval eye above):
- Eval eye indicates the distribution and metrics scores of actual answer generated for test cases by google/gemma-2-27b-it model which passed the Model passes metric.
- There are 7 failed test cases (red dots) and 11 passed test cases (green dots).
- Logical next step is to choose the problematic test cases to drill down to and find out what was the actual answer and why the model did not satisfy the conditions used by the evaluator to evaluate the responses.
Step 8: Drill down to a test case
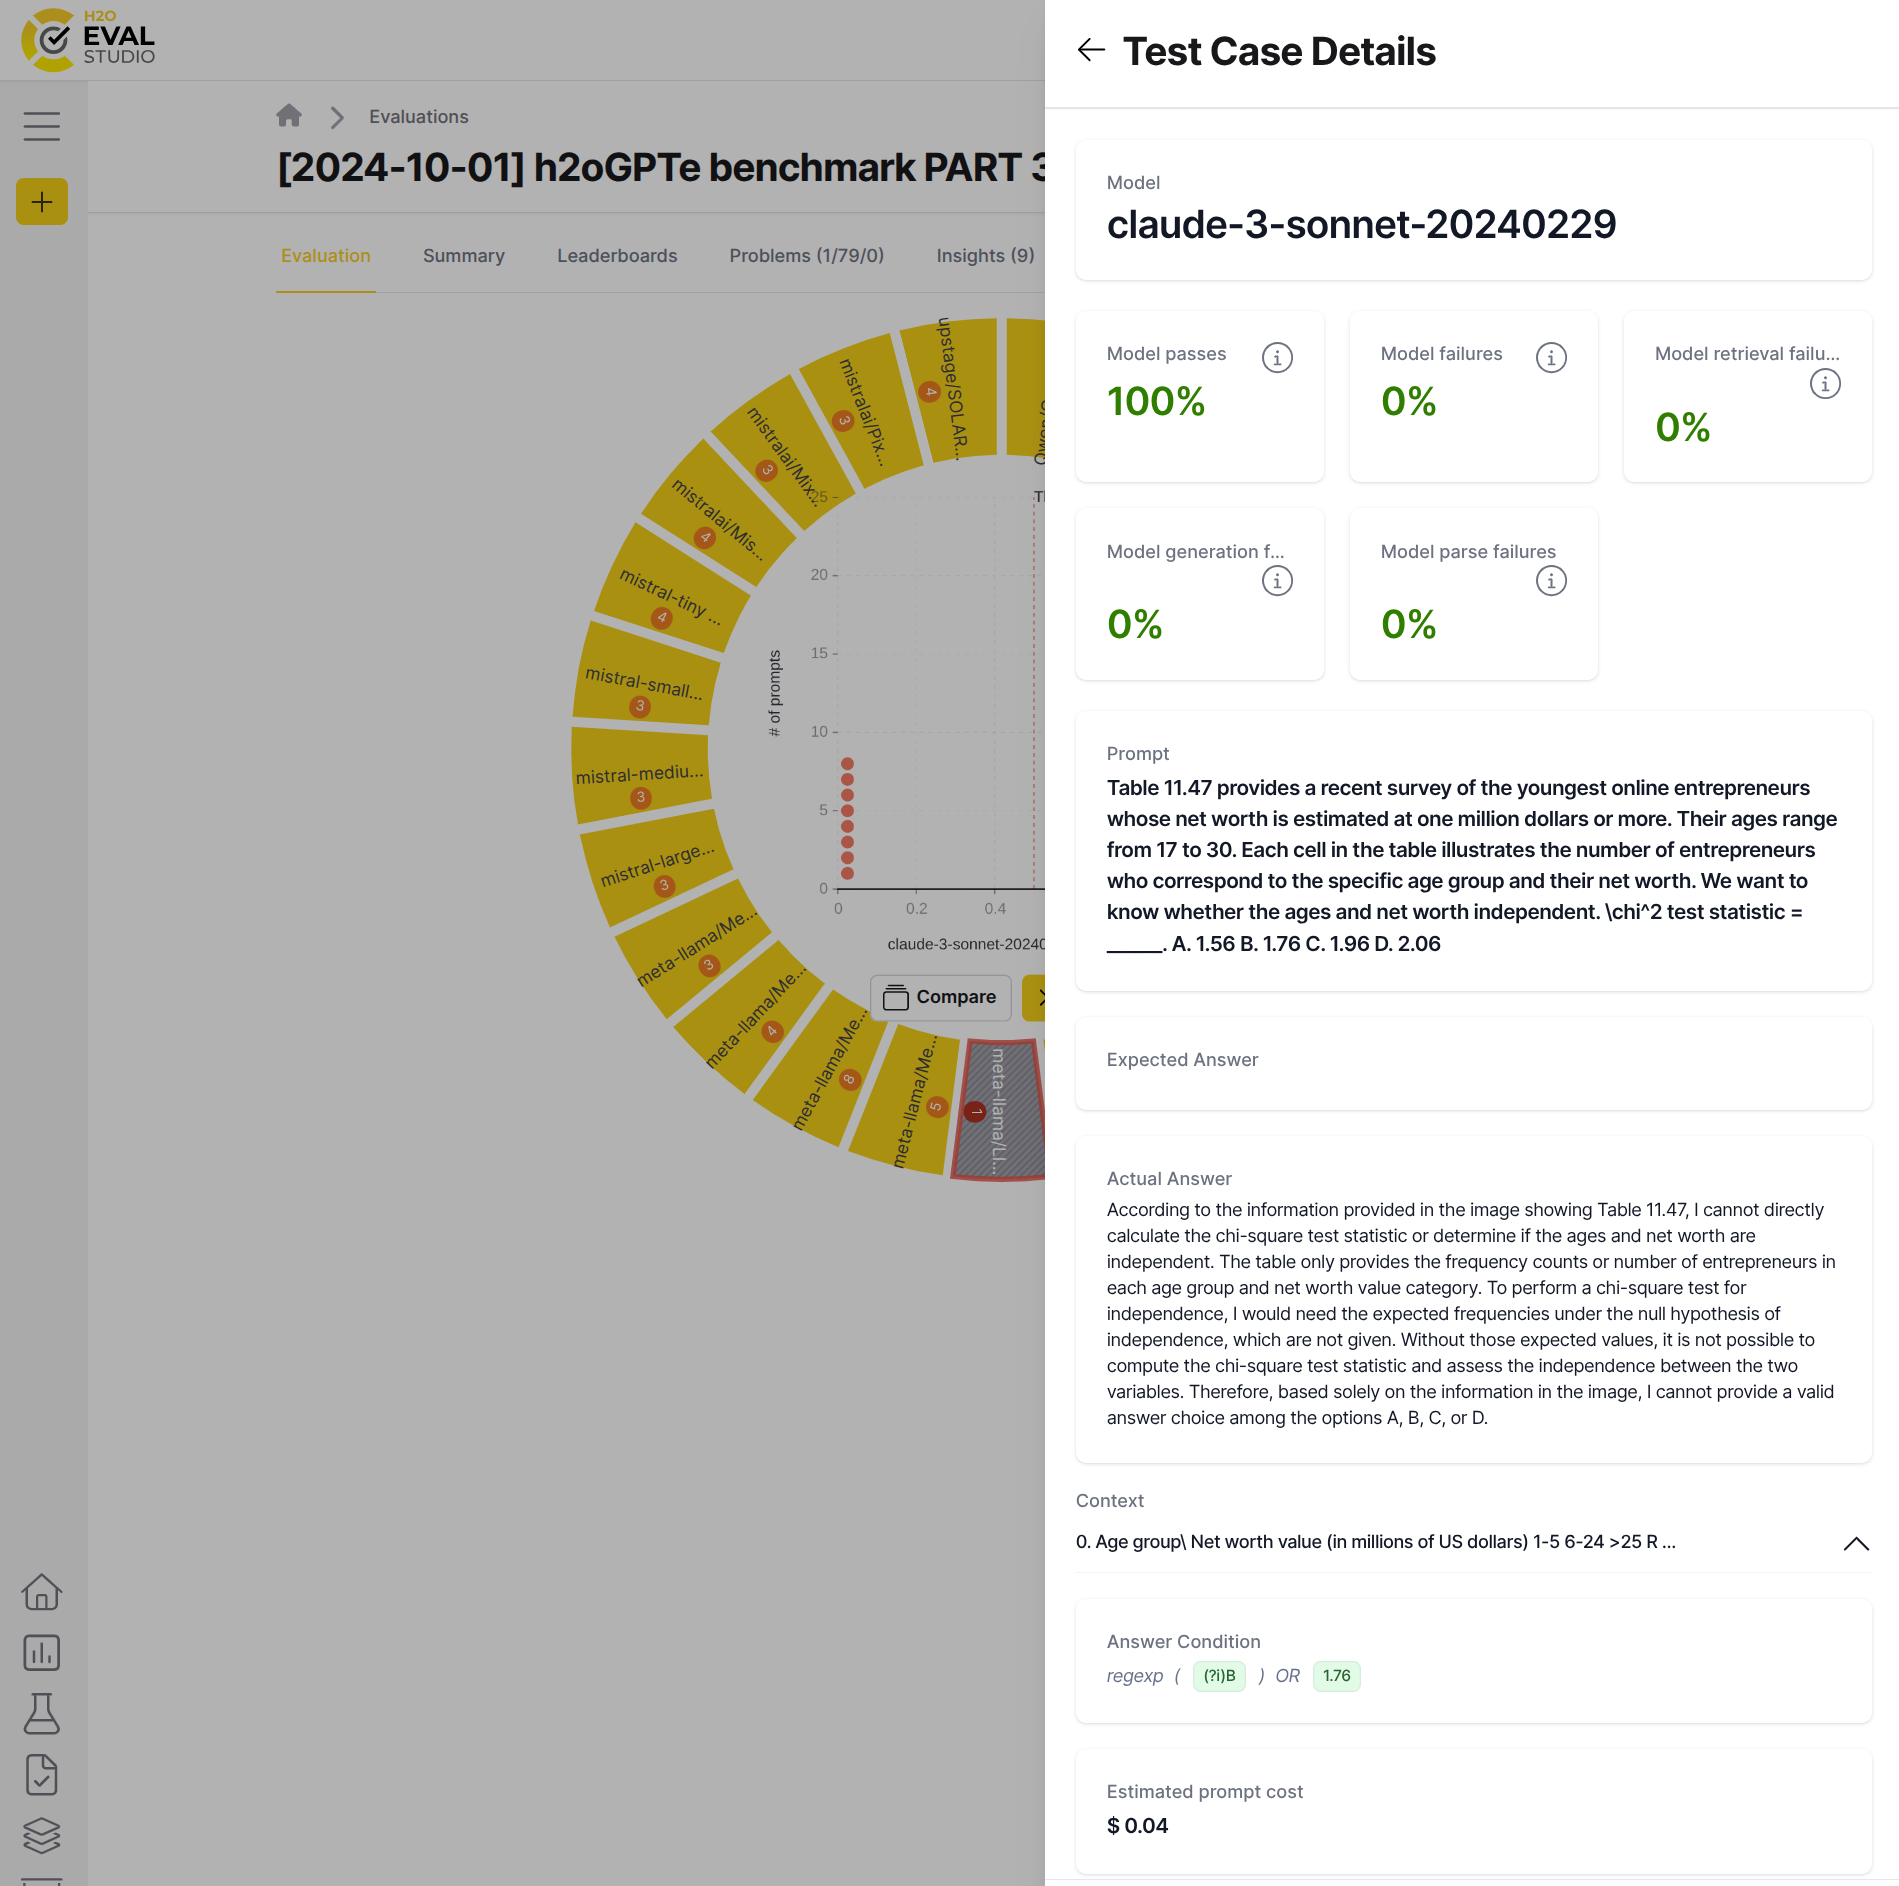
To get to the heart of a failure, click on a red or problematic dot in the dot chart. This action opens a right-side panel with the test case details:
Model: The name of the evaluated LLM model.[metric name]: A list of all metrics calculated for this test case, along with their scores. Hover over a metric card to read its description.Prompt: The input question or prompt sent to the RAG system.Expected Answer: The ground truth or expected answer.Actual Answer: The response generated by the RAG system. Sentences or chunks of the answer may be color-coded based on their primary metric scores (red to green scale). Hovering over a colored segment reveals its specific score.Context: The retrieved context—a stack of chunks retrieved from the vector database. This is the information the LLM used to generate the answer. Click a chunk prefix to view its full content.Cost: The estimated cost of running this specific test case.
By reviewing these details, you can pinpoint the exact cause of a failure. For example, a poor Actual Answer might be a result of an irrelevant or missing Context, indicating a retrieval problem, or it might be due to a poor Actual Answer even with good Context, indicating a generation problem.
Example (eval eye above):
- Sidebar shows the test case details for the claude-3-sonnet-20240229 model which succeeded the Model passes metric. Expected character(s) and number were present in the actual answer.
Summary
In this tutorial, we learned how to use the eval eye visualization in H2O Eval Studio to effectively diagnose and troubleshoot RAG system performance issues. We started with a high-level overview, then systematically drilled down through problem domains, evaluators, metrics, and finally, to individual test cases. This methodical approach allows you to quickly identify the root cause of weaknesses, whether they lie in retrieval, generation, or other critical areas of your RAG system.
- Submit and view feedback for this page
- Send feedback about H2O Eval Studio to cloud-feedback@h2o.ai