Task 4: Monitor H2O Driverless AI model with H2O MLOps
Monitor model
After scoring your H2O Driverless AI model, you can use H2O MLOps to monitor its performance. Monitoring ensures your deployed model operates as expected in production and helps detect unusual or erroneous outputs that may indicate issues with the input data, model, or deployment infrastructure.
- Click View Monitoring. note
The View Monitoring button becomes available only after H2O MLOps finishes setting up the monitoring panel for the deployed model. This process typically takes about 4–5 minutes. During this time, a "Setting Up Monitoring" message is displayed.
Tabs
- Health
- Drift summary
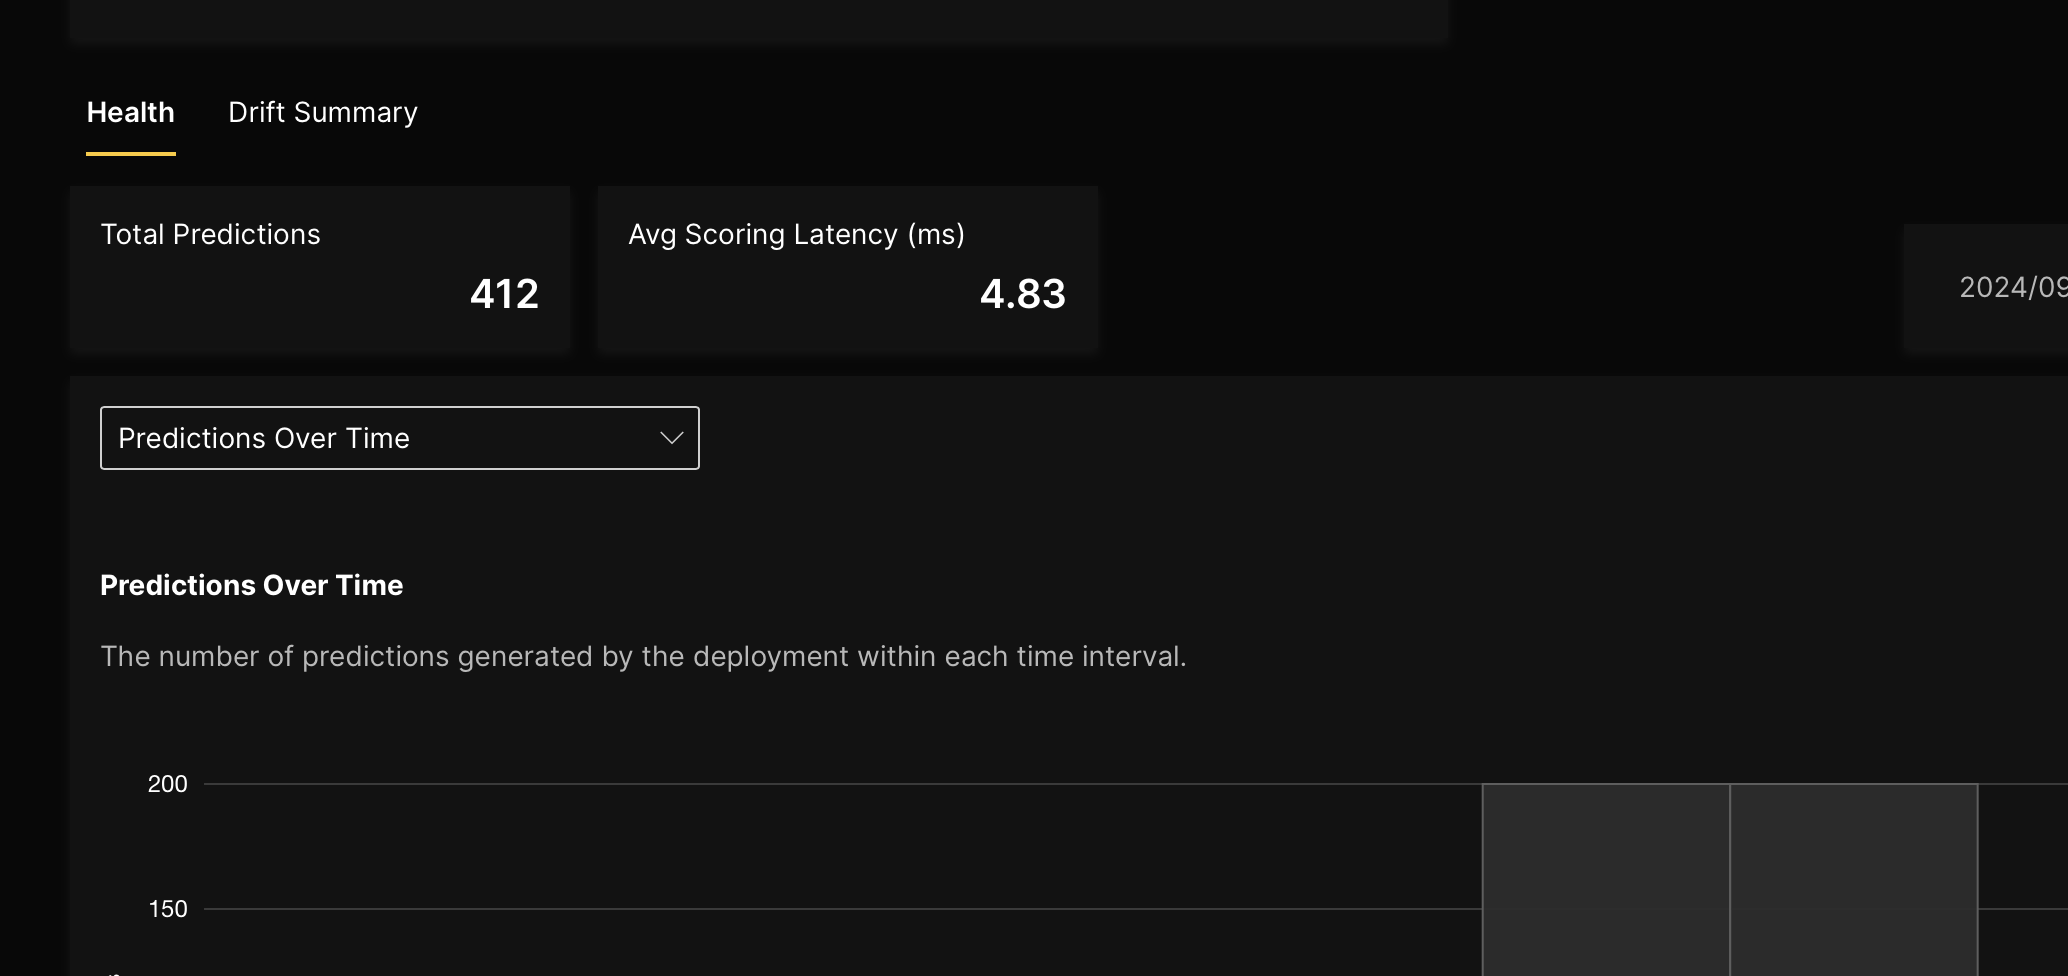
The Health tab provides the following information about the deployed model's health:
The Health tab is updated around 5+ minutes after a new score.
- Total predictions: This card displays the total number of predictions generated by the deployment within the specified date range (it defaults to the past 1 hour).
- Avg scoring latency (ms): This card displays the average scoring latency in milliseconds (ms) of the deployment within the specified date range (it defaults to the past 1 hour).
- Predictions over time: This graph displays the number of predictions generated by the deployment in each time interval for the filtered date range (it defaults to the past 1 hour). note
Prediction values over time are currently only supported for regression problem types.
The Drift summary tab contains information about drifted features since its deployment.
Feature drift refers to changes in a machine learning model's statistical properties or distribution of input features (variables) over time. These changes can degrade the model's performance, as it was trained on data with different characteristics. Feature drift can also occur when feature values fall outside the range of values seen during training. It is important to monitor these changes because they can lead to inaccurate predictions, reduced model reliability, and poor decision-making in production environments. Detecting and addressing feature drift helps ensure the model remains effective as real-world data evolves.
The Drift summary tab is populated when at least 200 scoring records have been logged. In that case, let's score the model 200 times (on top of the already made request).
Update the scoring.py script as follows:
scoring.pyimport random
import requests
# Fill in the endpoint URL from H2O MLOps
URL = "endpoint_url"
# Base data to be sent to API
data_template = {
"fields": [
"LIMIT_BAL", # Credit Limit Balance
"SEX", # Gender (1 = male; 2 = female)
"EDUCATION", # Education (1 = graduate school; 2 = university; 3 = high school; 4 = others)
"MARRIAGE", # Marital Status (1 = married; 2 = single; 3 = others)
"AGE", # Age
"PAY_1", # Repayment Status in September (The repayment status is categorized on a scale where -1 indicates payment made duly, and values from 1 to 9 indicate payment delays of one month up to nine months or more.)
"PAY_2", # Repayment Status in August
"PAY_3", # Repayment Status in July
"PAY_4", # Repayment Status in June
"PAY_5", # Repayment Status in May
"PAY_6", # Repayment Status in April
"BILL_AMT1", # Bill Statement Amount in September
"BILL_AMT2", # Bill Statement Amount in August
"BILL_AMT3", # Bill Statement Amount in July
"BILL_AMT4", # Bill Statement Amount in June
"BILL_AMT5", # Bill Statement Amount in May
"BILL_AMT6", # Bill Statement Amount in April
"PAY_AMT1", # Previous Payment Amount in September
"PAY_AMT2", # Previous Payment Amount in August
"PAY_AMT3", # Previous Payment Amount in July
"PAY_AMT4", # Previous Payment Amount in June
"PAY_AMT5", # Previous Payment Amount in May
"PAY_AMT6" # Previous Payment Amount in April
],
"rows": [
[
"20000", # LIMIT_BAL
"2", # SEX
"2", # EDUCATION
"1", # MARRIAGE
"20", # AGE
"2", # PAY_1
"2", # PAY_2
"-1", # PAY_3
"-1", # PAY_4
"-2", # PAY_5
"-2", # PAY_6
"3913", # BILL_AMT1
"3100", # BILL_AMT2
"689", # BILL_AMT3
"0", # BILL_AMT4
"0", # BILL_AMT5
"0", # BILL_AMT6
"0", # PAY_AMT1
"689", # PAY_AMT2
"0", # PAY_AMT3
"0", # PAY_AMT4
"0", # PAY_AMT5
"0" # PAY_AMT6
]
]
}
# Loop to make 200 requests with random values for EDUCATION, MARRIAGE, and AGE
for i in range(200):
# Modify EDUCATION, MARRIAGE, and AGE values randomly
random_one = random.randint(7, 200)
random_two = random.randint(4, 30)
random_three = random.randint(80, 200)
data_template["rows"][0][2] = str(random_one) # EDUCATION between 7-10
data_template["rows"][0][3] = str(random_two) # MARRIAGE between 4-10
data_template["rows"][0][4] = str(random_three) # AGE between 80-100
# Make the POST request
r = requests.post(url=URL, json=data_template)
if r.status_code != 200:
raise ValueError(
f"Error in H2O MLOps deployment with a status code: {r.status_code}. "
"Please, check the H2O MLOps deployment logs."
)
else:
# Extract and print data in JSON format
ret = r.json() # Response
print(f"Request {i+1} EDUCATION ({random_one}) MARRIAGE ({random_two}) AGE ({random_three}): {ret}")On line 5 of the scoring.py script, paste the copied endpoint URL of the deployed model.
To understand the type of information H2O MLOps can provide when features are drifting, let's intentionally drift the values for the following three features, EDUCATION, MARRIAGE, and AGE, in the 200 new requests. The minimum (min) and maximum (max) values for the three features are as follows:
- EDUCATION: 0 (min) and 6 (max)
- Education (1 = graduate school; 2 = university; 3 = high school; 4 = others)
- MARRIAGE: 0 (min) and 3 (max)
- Marital Status (1 = married; 2 = single; 3 = others)
- AGE: 21 (min) and 79 (max)
Accordingly, a value exceeding the maximum of any of the three features will be deemed indicative of feature drift. The script has been adjusted to set the values of the following features outside their maximum limits: EDUCATION, MARRIAGE, and AGE. Specifically, the script modifies the EDUCATION values to fall within the range of 7-10, the MARRIAGE values to range from 4-10, and the AGE values to fall between 80-100.
- Run the scoring.py script.
The Drift summary tab contains the following plots:
- The Drift summary tab is updated around 5+ minutes after a new score.
- H2O MLOps only supports drift calculation for tabular data types.
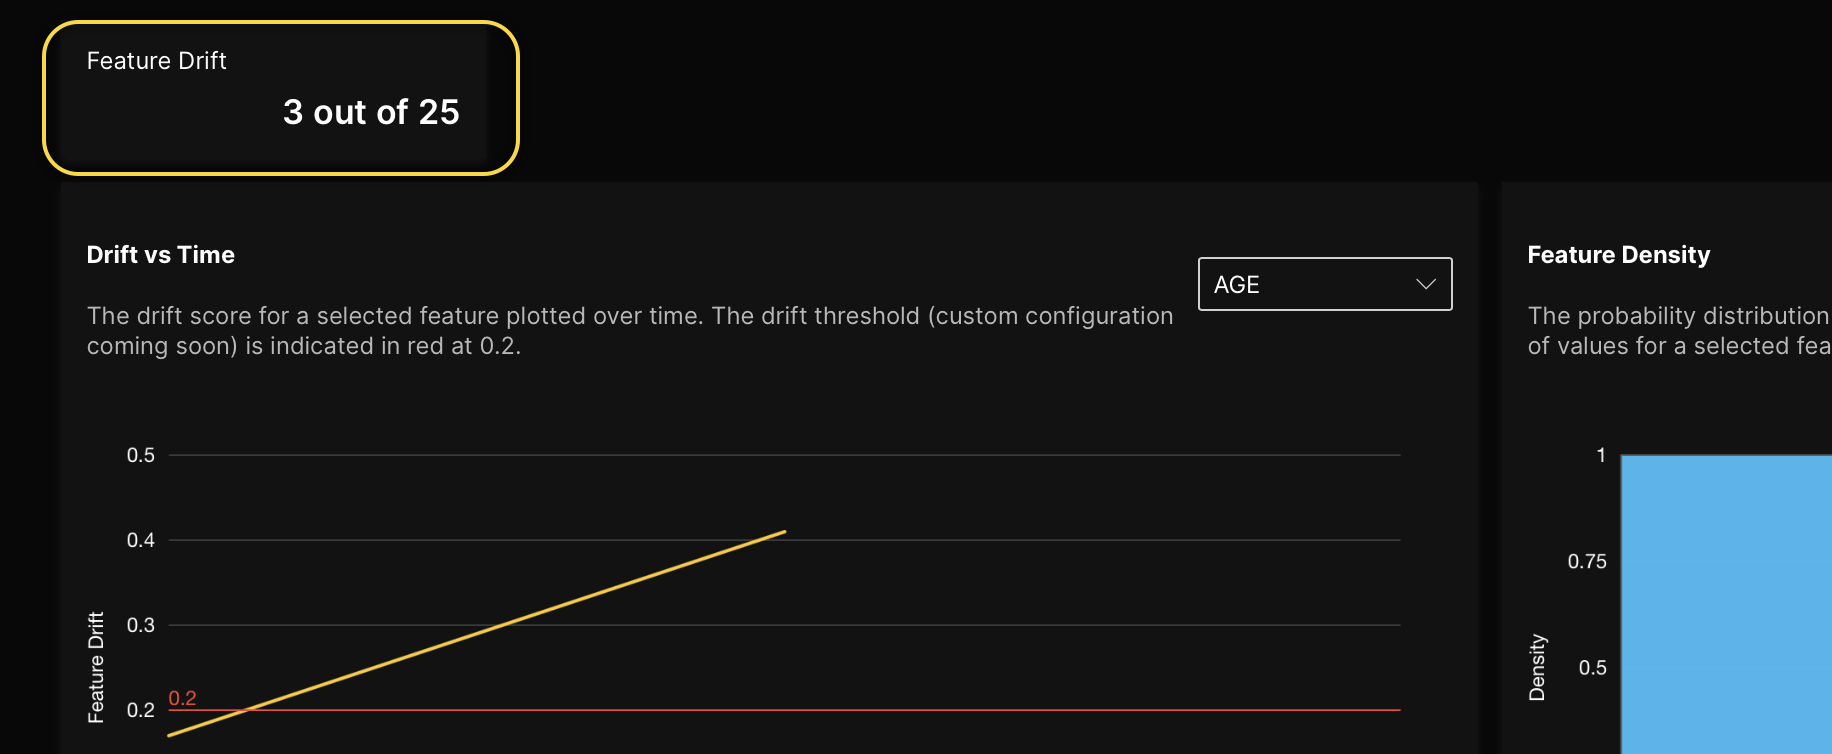
- Feature drift: This card displays the number of features that have drifted.
- Drift vs time: This plot shows the drift of a feature over time. You can use the drop-down menu to select a specific feature and view its drift information across a chosen time range.
- Feature density: This plot shows the probability distribution of values for a particular selected feature within a specified time range. Use the drop-down menu to choose a feature and view its drift information. If a feature with categorical values is selected, H2O MLOps displays a Feature frequency table instead of the Feature density plot.
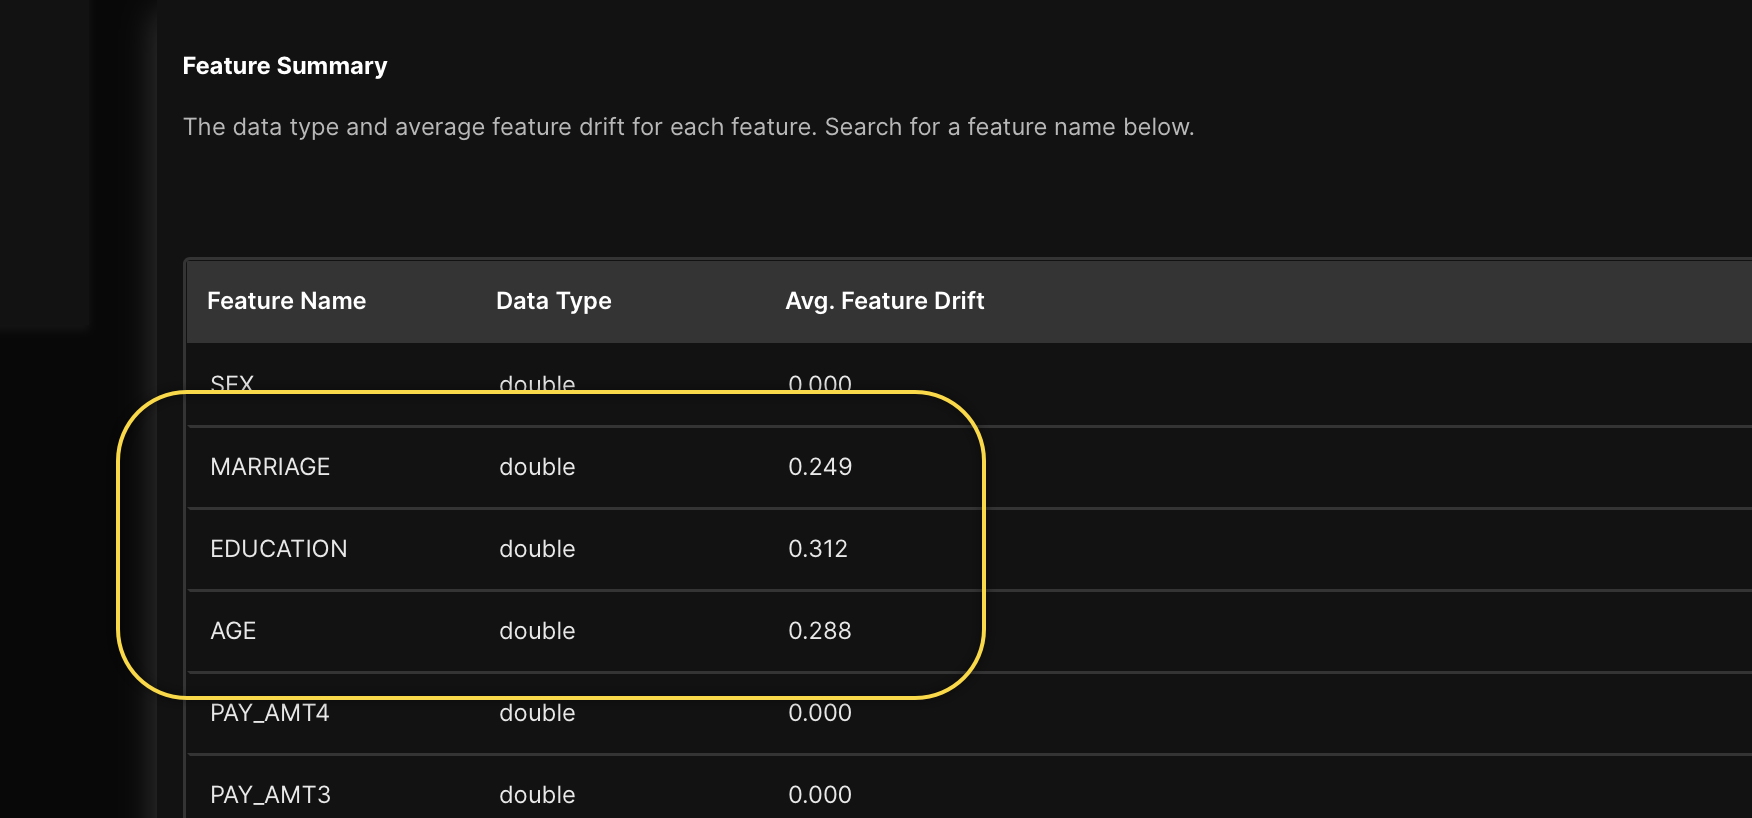
- Feature summary: This table details the model's features, including the feature name, data type, and average feature drift for each feature.
In the Feature drift card, we observe that 3 out of the 25 features have exhibited some level of drift. This corresponds directly to the drift values introduced for the following features: EDUCATION, MARRIAGE, and AGE.
In the Feature summary table, we can see that the features with an average drift value above 0.00 are those that were altered with drift values when 200 requests (scores) were made to the deployed model.
- Submit and view feedback for this page
- Send feedback about H2O Driverless AI | Tutorials to cloud-feedback@h2o.ai