Task 5: Explore Experiment results summary
Once the experiment is completed, the experiment summary page will appear. Let's explore the summary of the experiment results.
In the Experiments section select the experiment with the following name:
Sentiment Analysis Tutorial:Let's review the experiment summary page, and determine the goodness and efficiency of the built model:
 note
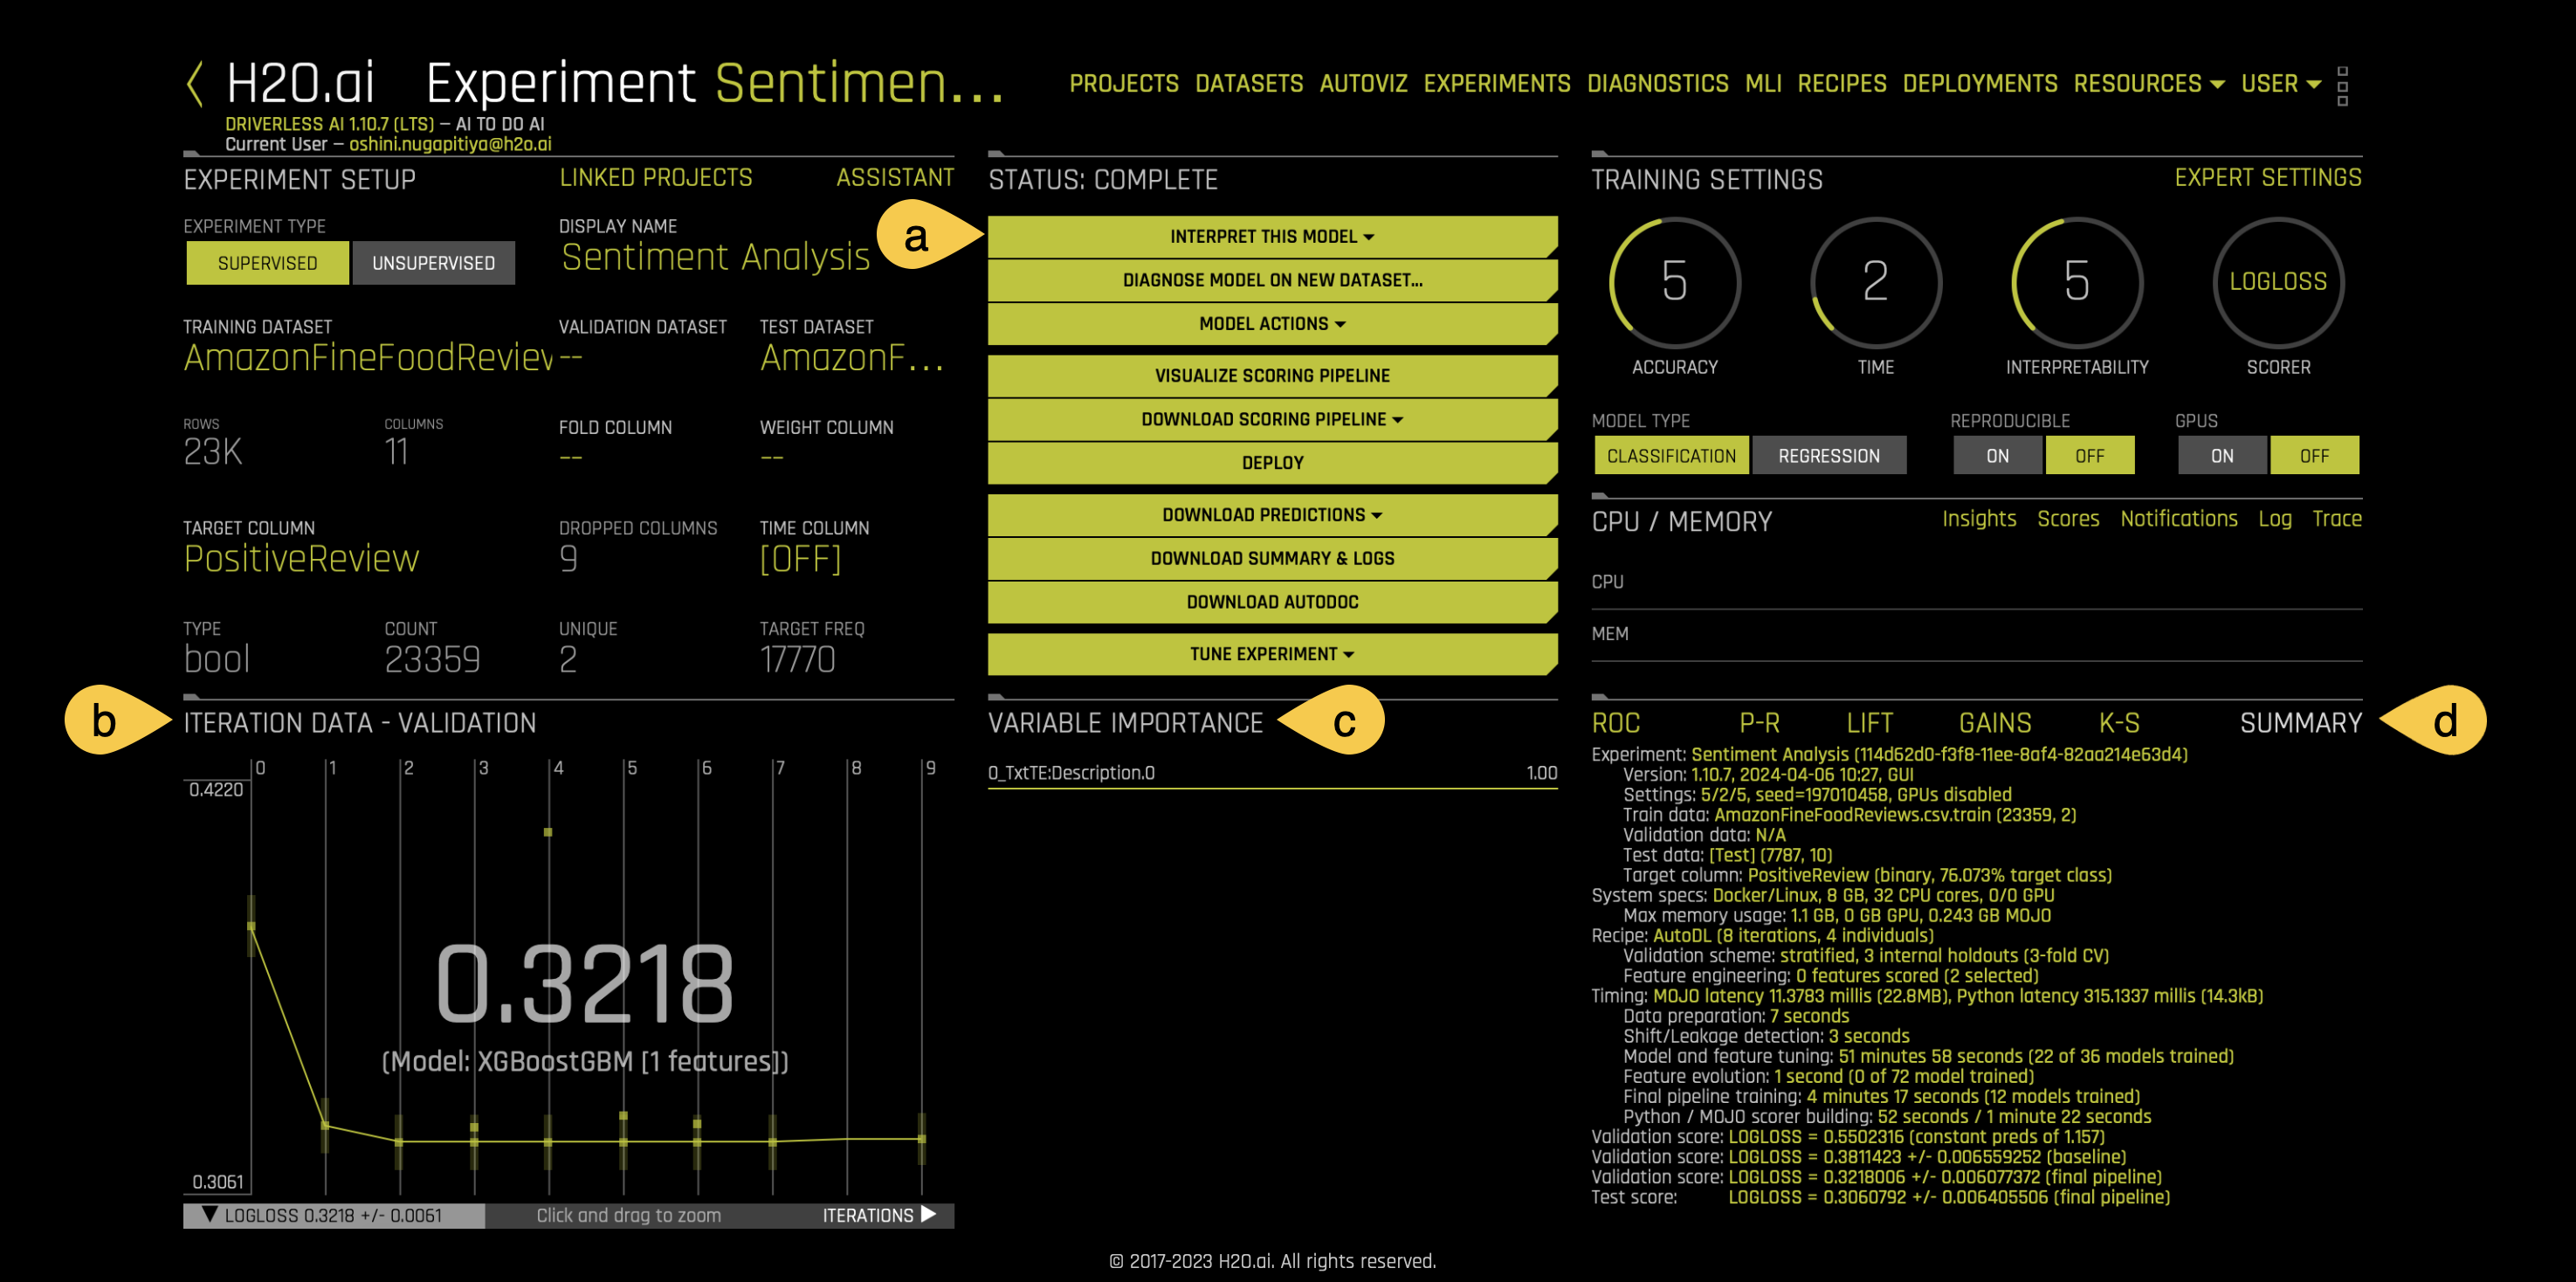
notea. Interpret this Model - this option allows you to understand your model through several Driverless AI and Surrogate Models. It also provides reason codes for the trained model and its results. For example, when running NLP experiments, Driverless AI offers the following visuals through the Interpret this Model option:
- The following two plots can be located in the NLP tab on the MLI Explanations page (only visible for NLP models):
- NLP Partial Dependence Plot Explainer - this plot is available for NLP models. NLP partial dependence (yellow) portrays the average prediction behavior of the Driverless AI model when an input text token is left in its respective text and not included in its respective text along with +/- 1 standard deviation bands. ICE (grey) displays the prediction behavior for an individual row of data when an input text token is left in its respective text and not included in its respective text. The text tokens are generated from TF-IDF.
- NLP LOCO Explainer - this plot is available for NLP models. It applies a leave-one-covariate-out (LOCO) styled approach to NLP models by removing a specific token from all text features in a record and predicting local importance without that token. The difference between the resulting score and the original score (token included) is useful when determining how specific changes to text features alter the model's predictions:
b. Iteration Data - Validation:
- The winning model's validation score and the algorithm used are as follows:
- Validation Score: 0.2431
- Model Type: LIGHTGBM
c. Variable Importance - Summary of top 20 Feature Engineered variables:
- Driverless AI performs feature engineering on the training dataset to determine the optimal representation of the data. Various stages of the features appear throughout the iteration of the data. These can be viewed by hovering over points on the Iteration Data - Validation Graph while the Variable Importance section updates its variables accordingly.
- The complete list of features used in the final model is available in the Experiment Summary artifacts. The Experiment Summary also provides a list of the original features and their estimated feature importance.
- Looking at the Variable Importance section can highlight important variables in NLP experiments.
d. Summary:
- This option gives a brief summary of the entire experiment including:
- The number of features tested and selected
- The models that Driverless AI trained for feature evolution
- There are also several plots adjacent to the summary tab that give insight into the experiment. If you are interested in learning more about each plot and the metrics derived from those plots, check out the following self-paced course: Machine Learning Experiment Scoring and Analysis - Financial Focus.
- The following two plots can be located in the NLP tab on the MLI Explanations page (only visible for NLP models):
If you would like to explore how custom recipes can improve predictions; in other words, how custom recipes could decrease the value of LOGLOSS (in our current observe experiment), refer the Task 6: Upload a Custom Recipe.
- Submit and view feedback for this page
- Send feedback about H2O Driverless AI | Tutorials to cloud-feedback@h2o.ai