View an experiment's tabs
Overview
An experiment contains the following tabs during and after model training:
- Charts
- Summary
- Metrics
- Train data insights
- Validation prediction insights
- Validation interpretation insights
- Logs
- Config
- Deployments
Instructions
To access the tabs of a completed or running experiment, consider the following instructions:
- In the H2O Hydrogen Torch navigation menu, click View experiments.
- In the Experiments table, click the name of the experiment you want to view its tabs.
Tabs
Charts
H2O Hydrogen Torch offers four different graphs to highlight performance metrics during an experiment, and such graphs can be located on the Charts tab of an experiment. The graphs are as follows:
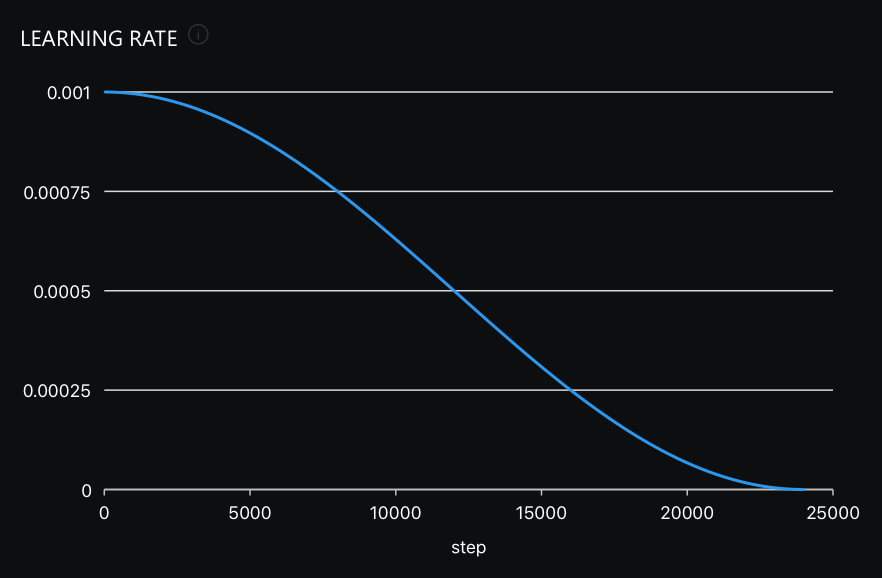
Learning rate
The Learning Rate graph displays the current learning rate throughout the training process visualized after each training batch.
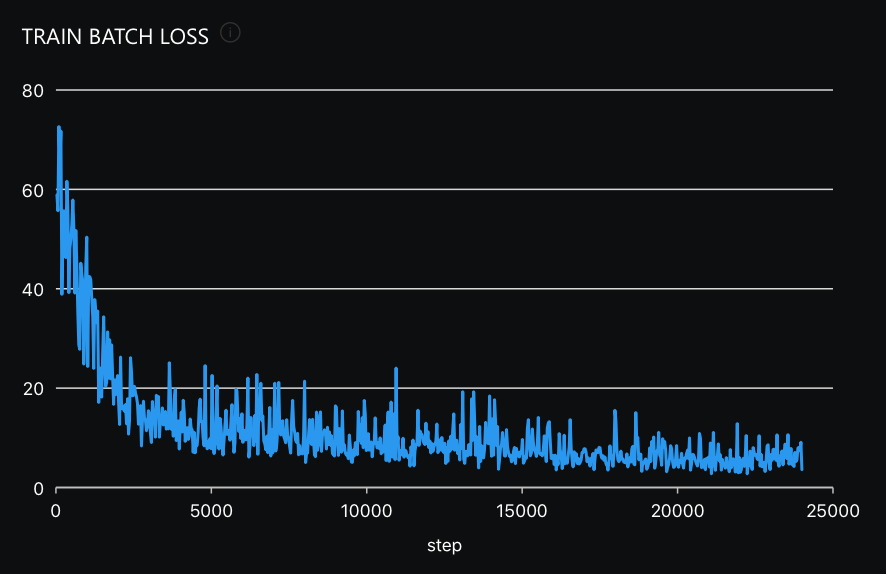
Train batch loss
The Train Batch Loss graph displays the current training loss throughout the training process visualized after each training batch.
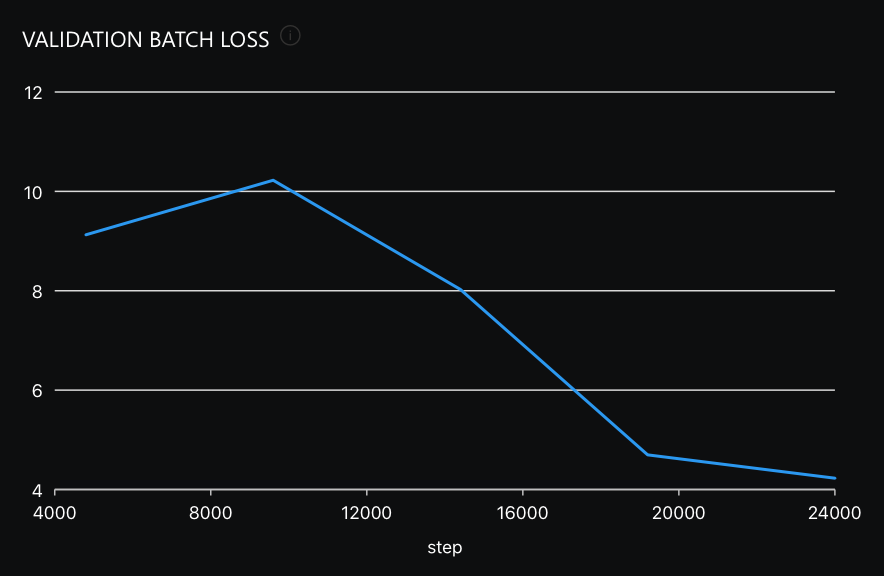
Validation batch loss
The Validation batch loss graph displays the current validation loss throughout the training process. Loss is calculated as the average of all validation batches. By default, it is calculated and visualized after each training epoch, but this frequency can be adjusted via the Evaluation epochs setting when creating an experiment.
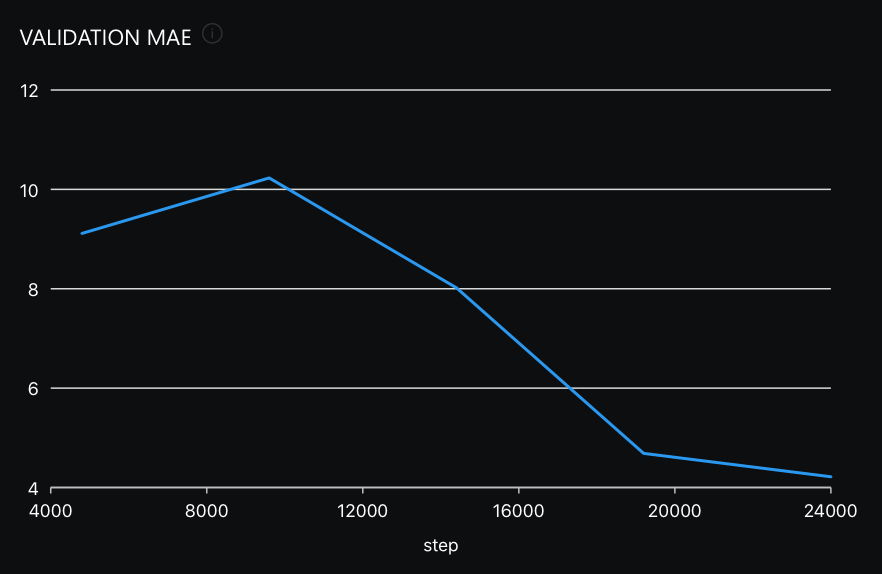
Validation {Metric}
The Validation {Metric} graph displays the current validation metric throughout the training process. In this case, the {Metric} refers to the selected metric for the problem type (e.g., MAE for an image regression experiment). {Metric} is calculated on full validation set predictions. By default, it is calculated and visualized after each training epoch, but this frequency can be adjusted via the Evaluation epochs setting when creating an experiment.
Summary
On the Summary tab, H2O Hydrogen Torch displays the below table containing summary metrics about the experiment.
| Name | Description |
|---|---|
| Name | Name of the experiment. |
| Dataset | Dataset used for the experiment. |
| Problem Type | Problem type of the experiment. |
| Fold | The validation fold value. |
| Seed | The random seed value that you selected for model training. |
| GPU List | List of GPUs that H2O Hydrogen Torch used during model training. |
| Loss | Loss refers to the objective function optimized directly during model training. |
| Metric | Metric refers to the selected metric to evaluate model performance. |
| Epoch | The number of epochs used to train the model. |
| Train Metric | Train metric refers to evaluation metric computed on train data. A value for Train metric is available when Calculate Train Metric is turned on when defining the experiment settings. |
| Val Metric | Val Metric refers to the evaluation metric computed on the validation data. |
| Test Metric | Test metric refers to the evaluation metric computed on the test data. |
Metrics
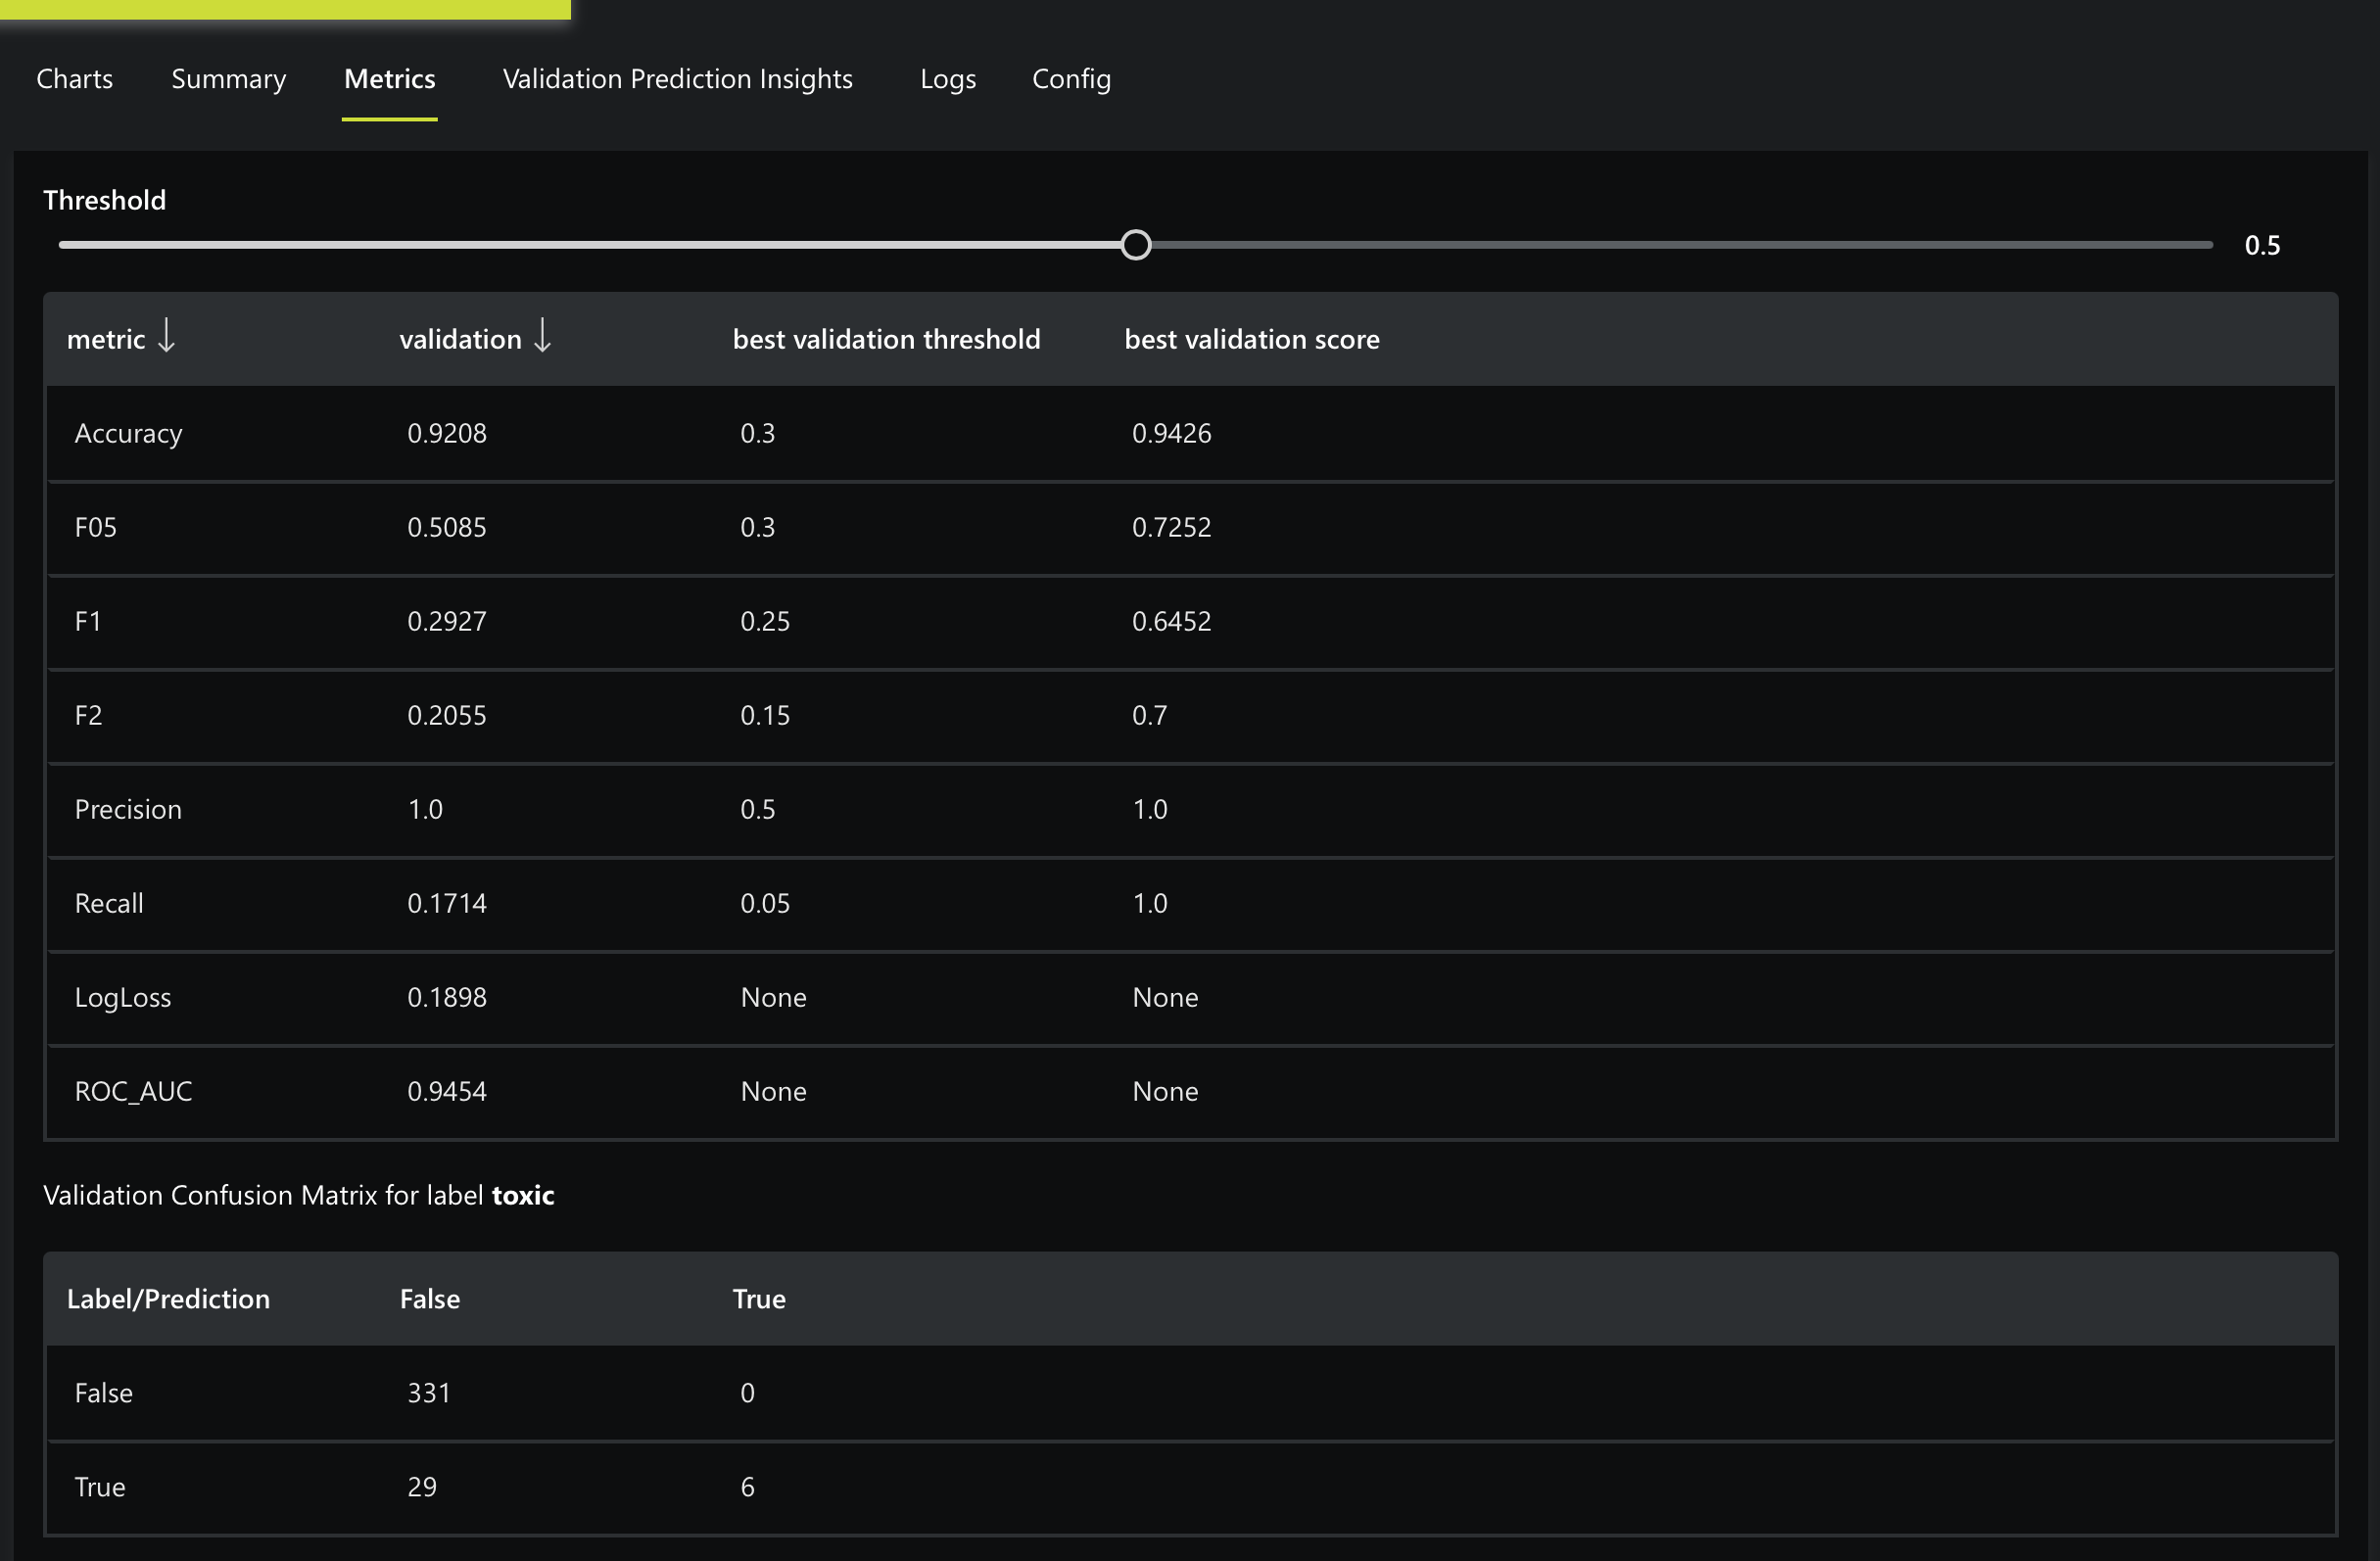
On the Metrics tab, H2O Hydrogen Torch displays the following experiment metrics:
- An array of scorer values (metrics) applicable to the problem type of the experiment (e.g., Accuracy, MAE, MSE, MAPE, etc.), where the scorer values refer to the validation dataset
- If you turned the Calculate Train Metric setting (for the experiment), H2O Hydrogen Torch also provides scorer values for the training dataset
- If you provided a test dataset, H2O Hydrogen Torch also provides scorer values for the training dataset
- Best thresholds and their corresponding metric values are shown for threshold-dependant metrics
- For classification experiments, H2O Hydrogen Torch displays confusion matrices where an interactive threshold slider is available in the case of binary or multi-label classification. Moving the slider changes the metric values for threshold-dependant metrics along with the confusion matrices
Precision, recall, F1, F05, and F2 are micro-average. To learn more, see Metrics.
Train data insights
H2O Hydrogen Torch displays random visual samples of the training data on the Train data insight tab after the experiment's augmentations.
- For text models, you can view text samples tokenized and in their original form. For example, observing a tokenized text allows you to see the beginning (
[CLS]) and end ([SEP]) of a sample text + its label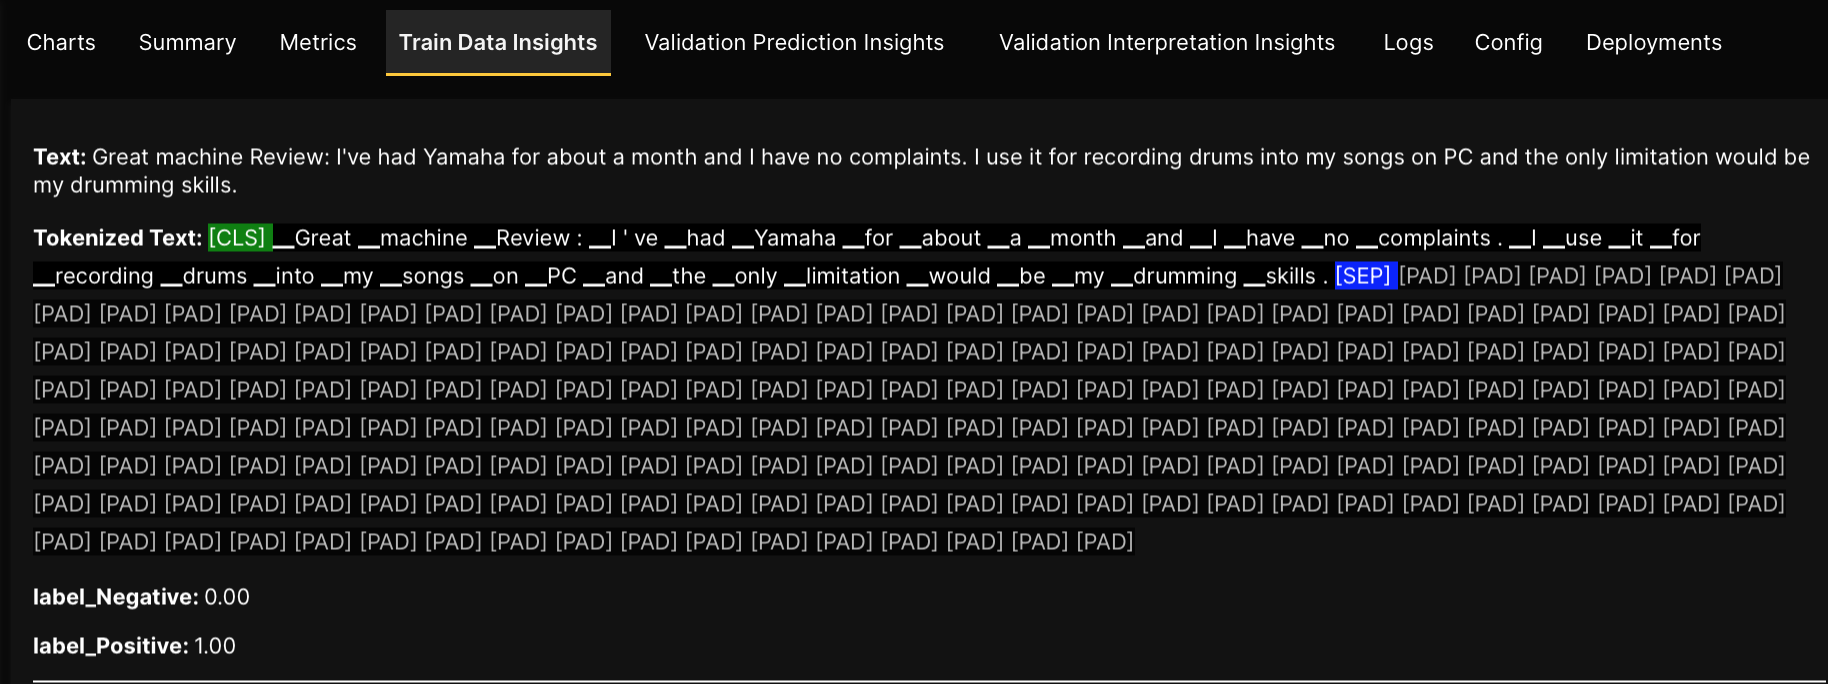
- The
[CLS]token representation depends on the tokenizer model backbone. For example, it may look like<s>for some models - The
[SEP]token may not be present for some models
- The
- The Train data insights tab is available for the following problem types:
- Image regression
- 3D image regression
- Image classification
- 3D image classification
- Image object detection
- Image semantic segmentation
- 3D image semantic segmentation
- Image instance segmentation
- Image metric learning
- Text regression
- Text classification
- Text sequence to sequence
- Text metric learning
- Audio regression
- Audio classification
- Speech recognition
Validation prediction insights
On the Validation Prediction Insights tab, H2O Hydrogen Torch visualizes the validation samples of the experiment while providing the loss value of each sample. In particular, isights are divided as follows:
- Random validation samples
- In the Random validation samples tab, H2O Hydrogen Torch visualizes an experiment's best and worst validation samples while proving the loss value for each sample.
- Best validation samples
- In the Best validation samples tab, H2O Hydrogen Torch visualizes the best validation samples of an experiment while providing the loss value of each sample. Samples in this tab are regarded as the model's smallest significant errors.
- Worst validation samples
- In the Worst validation samples tab, H2O Hydrogen Torch visualizes the worst validation samples of an experiment while providing the loss value of each sample. Samples in this tab are regarded as the model's most significant errors. Samples in this tab can help identify issues the model might have.
Evaluating the best and the worst performance differs for each problem type and might vary from the selected loss and the selected metric to assess the model.
Validation interpretation insights
The Validation interpretation insights tab is only available for image, text, and audio classification and regression experiments.
- Image
- For an image regression and classification experiment, on the Validation interpretation insights tab, H2O Hydrogen Torch highlights with Gradient-weighted Class Activation Mapping (Grad-CAM) the areas of an image the model considered the most when generating a prediction for the image.
- Text
- For a regression and classification text experiment, on the Validation interpretation insights tab, H2O Hydrogen Torch highlights with Integrated Gradients the words the model considered the most when generating a prediction for the text.
- Highlighted green text: The greener the highlight, the higher the positive contribution to the prediction the text had
- Highlighted red text: The redder the highlight, the higher the negative contribution to the prediction the text had
- For a regression and classification text experiment, on the Validation interpretation insights tab, H2O Hydrogen Torch highlights with Integrated Gradients the words the model considered the most when generating a prediction for the text.
- Audio
- For an audio regression and classification experiment, on the Validation Interpretation Insights tab, H2O Hydrogen Torch highlights with Gradient-weighted Class Activation Mapping (Grad-CAM) the areas of a spectrogram the model considered the most when generating a prediction for the image.
NoteH2O Hydrogen Torch only presents the first five seconds of an audio (spectrogram) if the audio is longer than five seconds.
Insights are divided as follows:
- Random validation samples
- In the Random validation samples tab, H2O Hydrogen Torch visualizes random samples.
- Best validation samples
- In the Best validation samples tab, H2O Hydrogen Torch visualizes the best validation samples. Samples in this tab are regarded as the model's smallest significant errors.
- Worst validation samples
- In the Worst validation samples tab, H2O Hydrogen Torch visualizes the worst validation samples. Samples in this tab are regarded as the model's most significant errors. Samples in this tab can help identify issues the model might have.
For image classification experiments, in the Random validation samples, Best validation samples, and Worst validation samples tab, H2O Hydrogen Torch for each class separately highlights with Gradient-weighted Class Activation Mapping (Grad-CAM) the areas of an image the model considered the most when generating a prediction for the image.
Logs
On the Logs tab, you can view the experiment's logs.
Config
On the Config tab, you can view the experiment's configurations (setting values) used during training.
Deployments
On the Deployments tab, you can deploy the built model (experiment) to H2O MLOps. In particular, in the Deployments tab the following cards are display:
Deploy model
In the Deployment model card, you can specify the H2O Hydrogen Torch model's H2O MLOps deployment settings.
- To learn how to deploy a built model to H2O MLOps, see Deploy a model (experiment) to H2O MLOps.
- To learn about the available deployment settings, see H2O MLOps: Deployment settings.
List of deployments
In the List of deployments card, H2O Hydrogen Torch tracks the created deployments for the model (experiment).
- H2O Hydrogen Torch does not automatically update the List of deployments table
- To update the List of Deployment table, click Refresh.
- You can view the details of a deployed model when its deployment status is HEALTHY (the deployment is alive and healthy). To learn about the different deployment states a model can be in, see States.
Deployment details
In the Deployment details card, you can view the following about the deployed model in H2O MLOps:
- Deployment ID
- ID of the deployment.
- Last modified
- The time the deployment was last modified.
- Endpoint URL
- The endpoint URL of the deployed model in H2O MLOps that you can utilize to score the deployed model.
- Sample request
- A Python script (code) demonstrating how to score the deployed model (that is, score with new data).
- Submit and view feedback for this page
- Send feedback about H2O Hydrogen Torch to cloud-feedback@h2o.ai