Compare model (experiment) summaries
You can compare model summaries (experiments) to understand the similarities and differences between models (model summaries).
Instructions
To compare model summaries, consider the following instructions:
- In the H2O Model Validation navigation menu, click Experiments.
- In the experiments table, select at least two model summaries to compare.
note
You cannot compare a model (experiment) summary if its state is not done or you have not generated a dataset summary for the dataset. To learn how to create a summary for a dataset, see Create a model (experiment) summary.
- Click Compare.
note
A comparison table and a feature importance chart appear when comparing the selected model summaries. To learn more, see Comparison table and Chart: Feature importance.
Comparison table
| Column name | Description |
|---|---|
Test Name | The name of the experiment. |
Scorer | The scorer of the experiment. |
Validation Score | Experiment validation score value. |
Test Score | Experiment test score value. |
Accuracy | Experiment accuracy value. |
Time | Experiment time value. |
Interpretability | Experiment interpretability value. |
Task | Experiment problem type (e.g., regression). |
Target | Experiment target column (target feature). |
Dropped Columns | Dropped columns that Driverless AI dropped during the experiment to not use as predictors. |
Train Data Name | Name of the experiment train dataset. |
Train Data Shape | The number of rows and columns in the experiment train dataset ((rows, columns)). |
Test Data Name | Name of the experiment test dataset. |
Test Data Shape | The number of rows and columns in the experiment test dataset ((rows, columns)). |
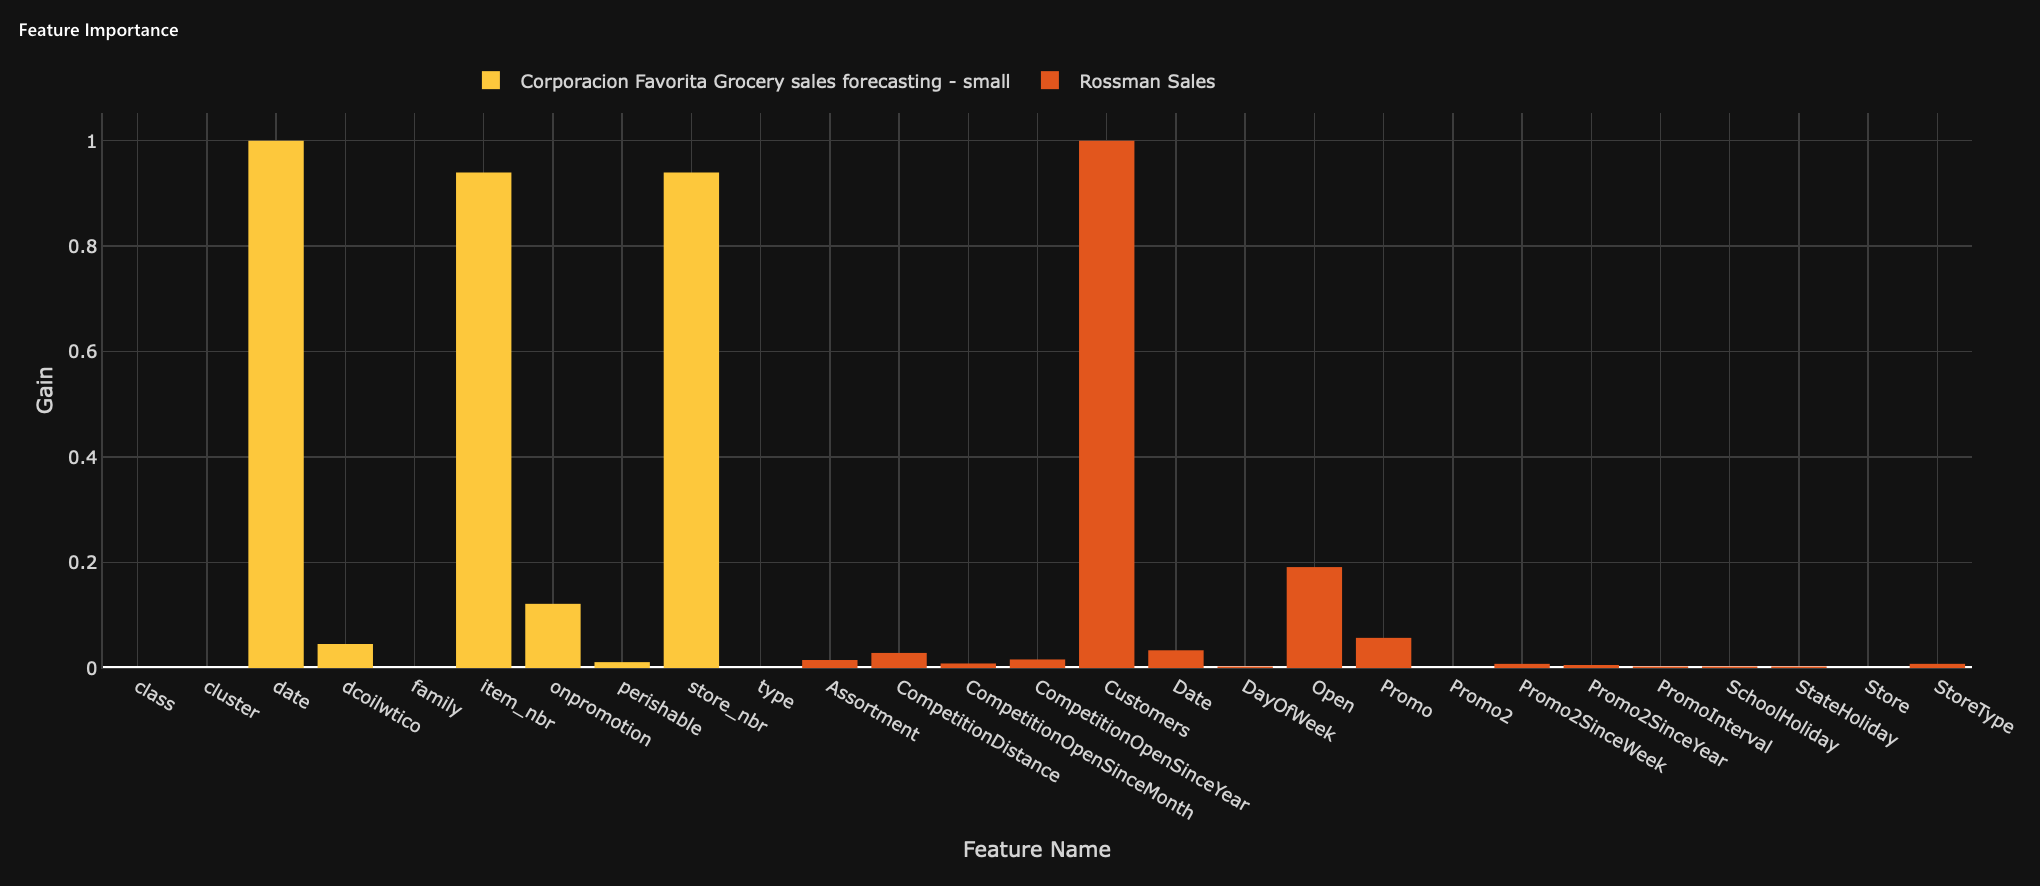
Chart: Feature importance�
The feature importance chart displays all the features of the compared models (model summaries).
- X-axis: Feature name
- Y-axis: Gain value (the importance of the feature in the model)
Feedback
- Submit and view feedback for this page
- Send feedback about H2O Model Validation to cloud-feedback@h2o.ai