Compare validation tests
H2O Model Validation enables you to compare validation tests of the same type to discover insights across a set of validation tests of the same type.
Instructions
To compare validation tests, consider the following instructions:
- In the H2O Model Validation navigation menu, click Test manager.
- In the test manager table, select at least two validation tests of the same type.
note
You can select multiple validation tests of different types, but you must select at least two of the same type. H2O Model Validation compares validation tests of the same type (e.g., Backtesting); therefore, validation tests of different types are not cross-compared. H2O Model Validation organizes comparisons into tabs, each containing validation tests of a certain type.
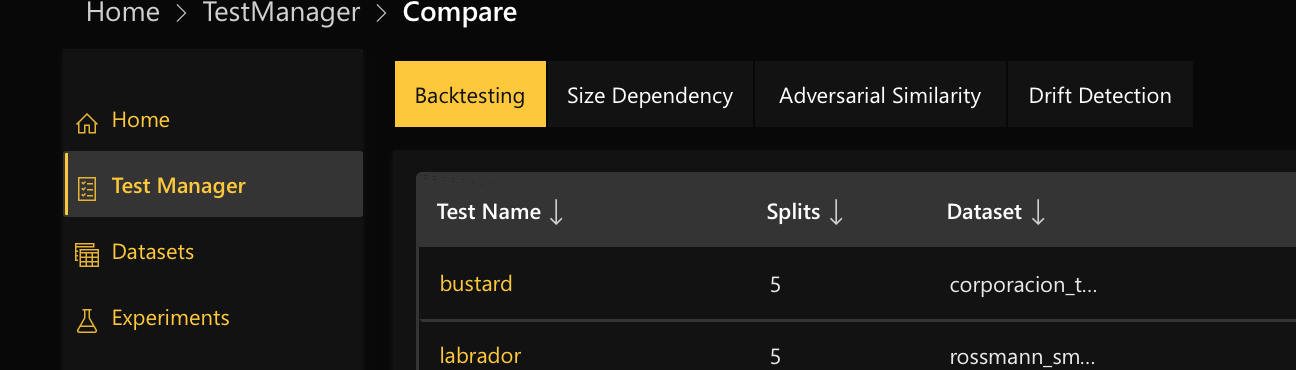
- Click Compare.
note
- H2O Model Validation displays specific metrics based on the validation test types. To learn more, see:
Validation test comparison metrics
H2O Model Validation displays specific metrics based on the validation test types. Based on the type of the selected validation tests to compare, specific metrics in graphs, histograms, charts, etc., appear.
Adversarial Similarity
H2O Model Validation offers several metrics in the form of graphs to understand the Adversarial Similarity tests you compared. Below, each metric is described in turn.
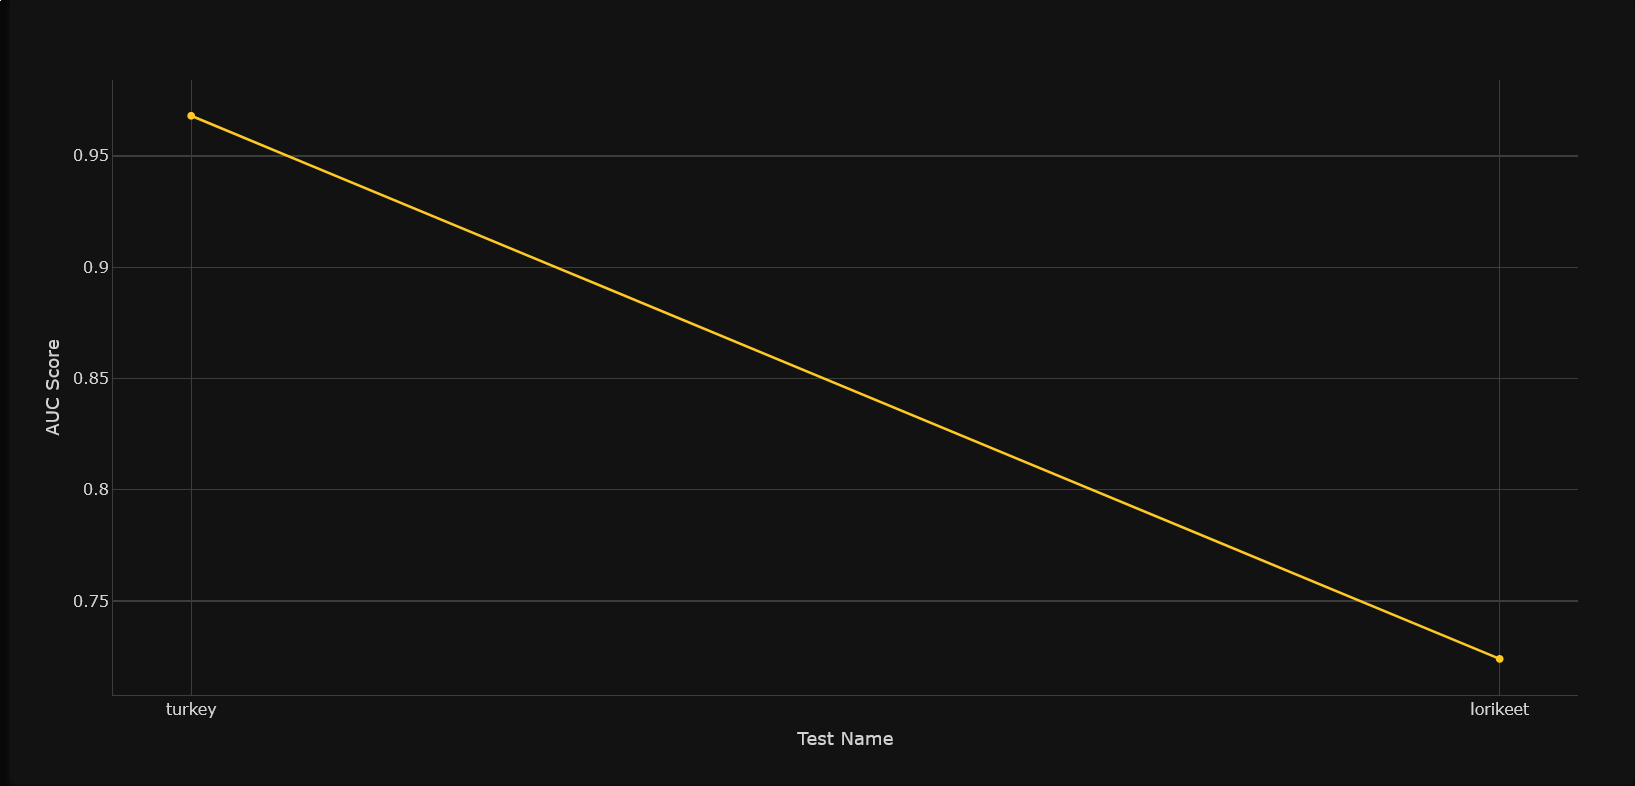
Graph: AUC score
The AUC Score graph displays the AUC score given to each Adversarial Similarity test.
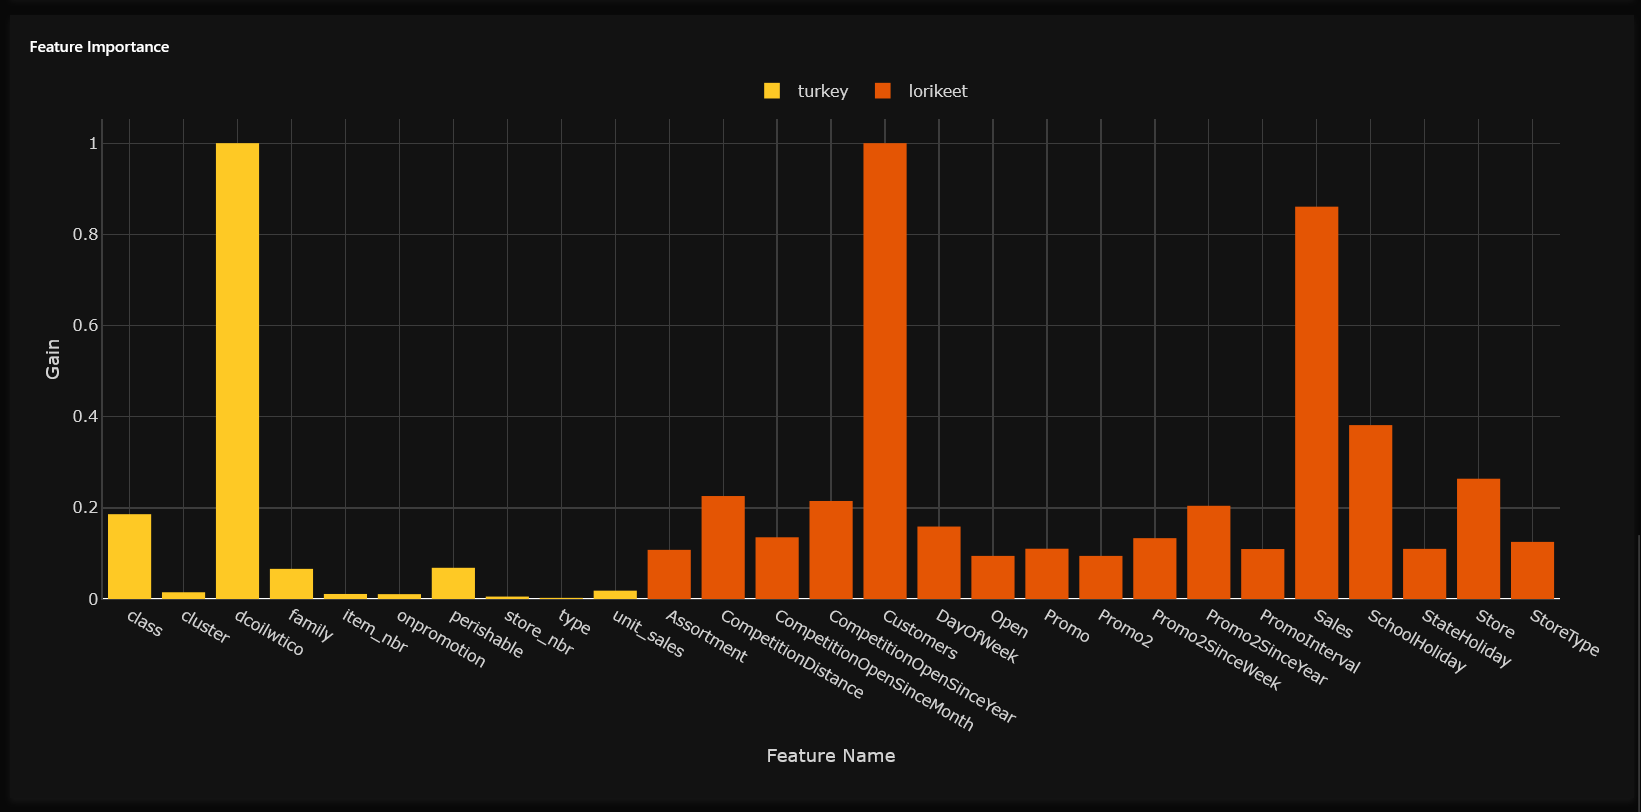
Bar graph: Feature importance
The Feature importance bar graph displays the gain of the features in both of the Adversarial Similarity tests. Gain refers to the relative contribution of a feature towards the predictive values. A higher gain value implies a higher impact on generating predictions.
Backtesting
H2O Model Validation offers several metrics in the form of graphs and a histogram to understand the Backtesting validation tests you compared. Below, each metric is described in turn.
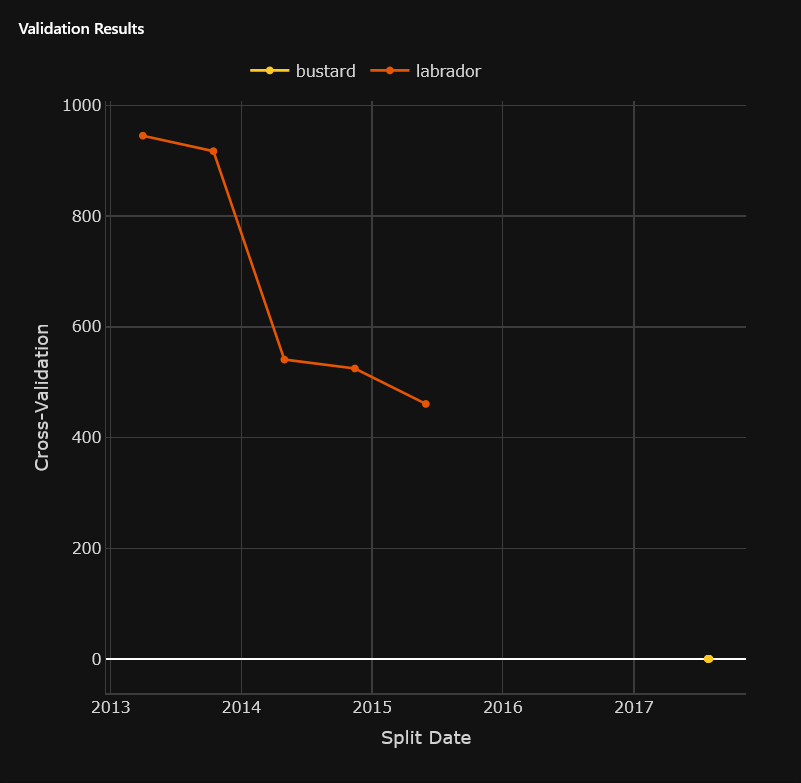
Graph: Validation results
The Validation results graph displays the Cross-Validation values for each split date for both Backtesting models. This graph can be helpful when estimating the level of fitness of a model to a dataset not used when training the model.
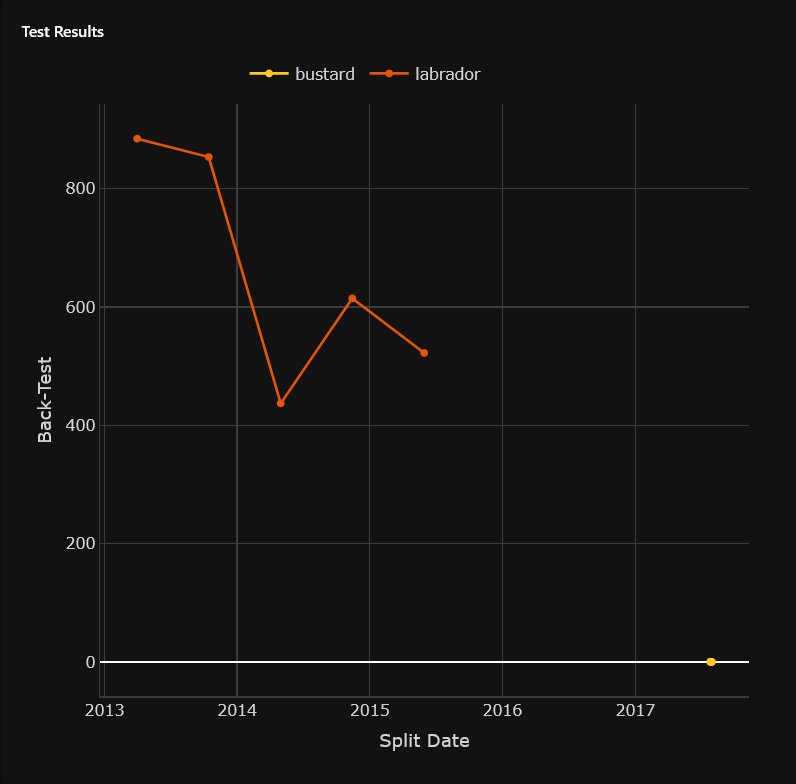
Graph: Test results
The Test results graph displays the Back-Test values for each split date for both Backtesting tests, where Back-Test refers to the target distribution values from the test dataset.
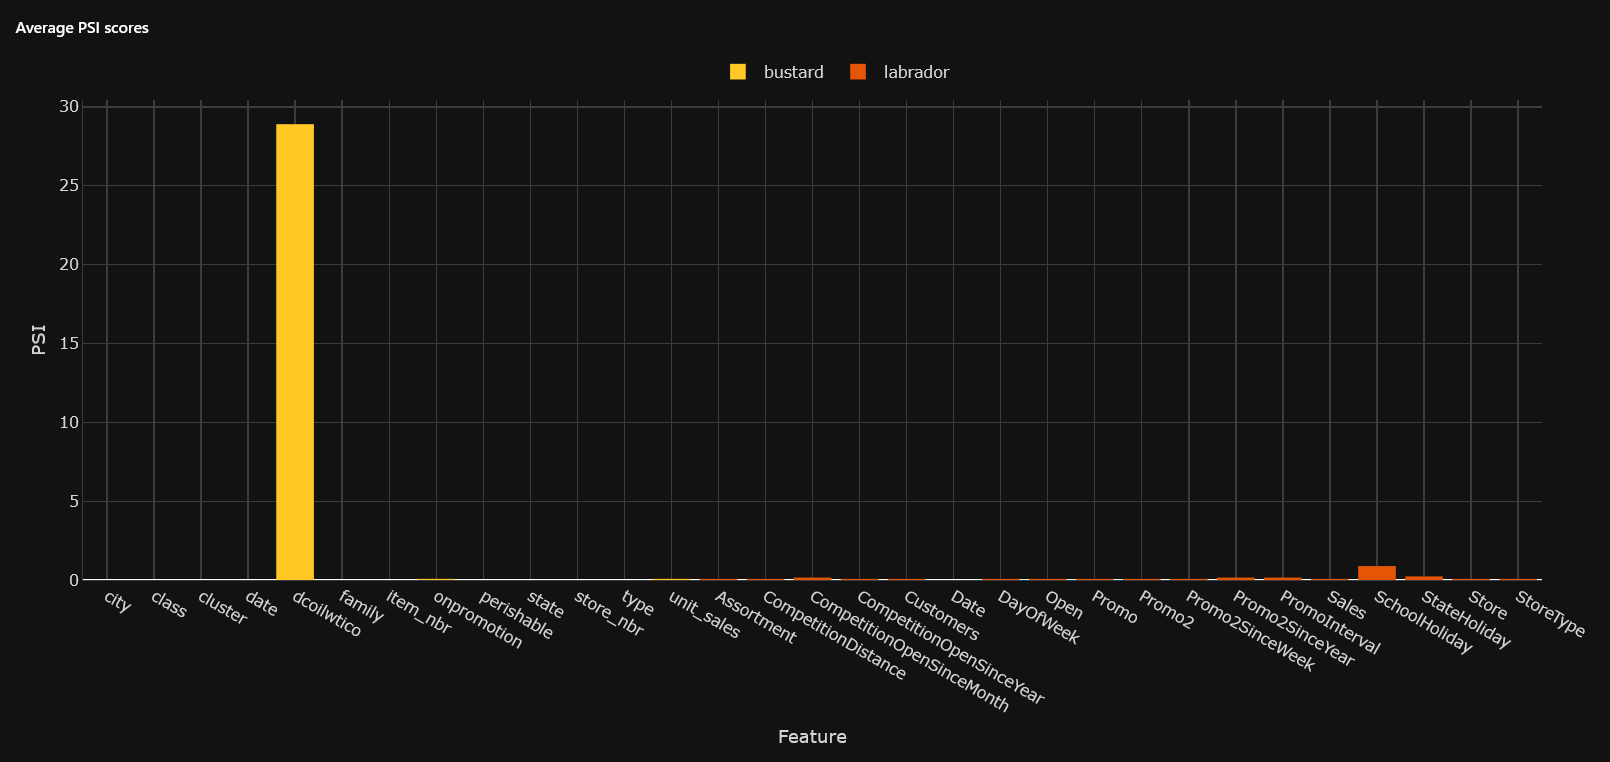
Average PSI scores
The Average PSI scores bar graph displays the average Population Stability Index (PSI) for the features in both Backtesting tests.
Drift Detection
H2O Model Validation offers several metrics in the form of a bar graph to understand the Drift Detection tests you compared.
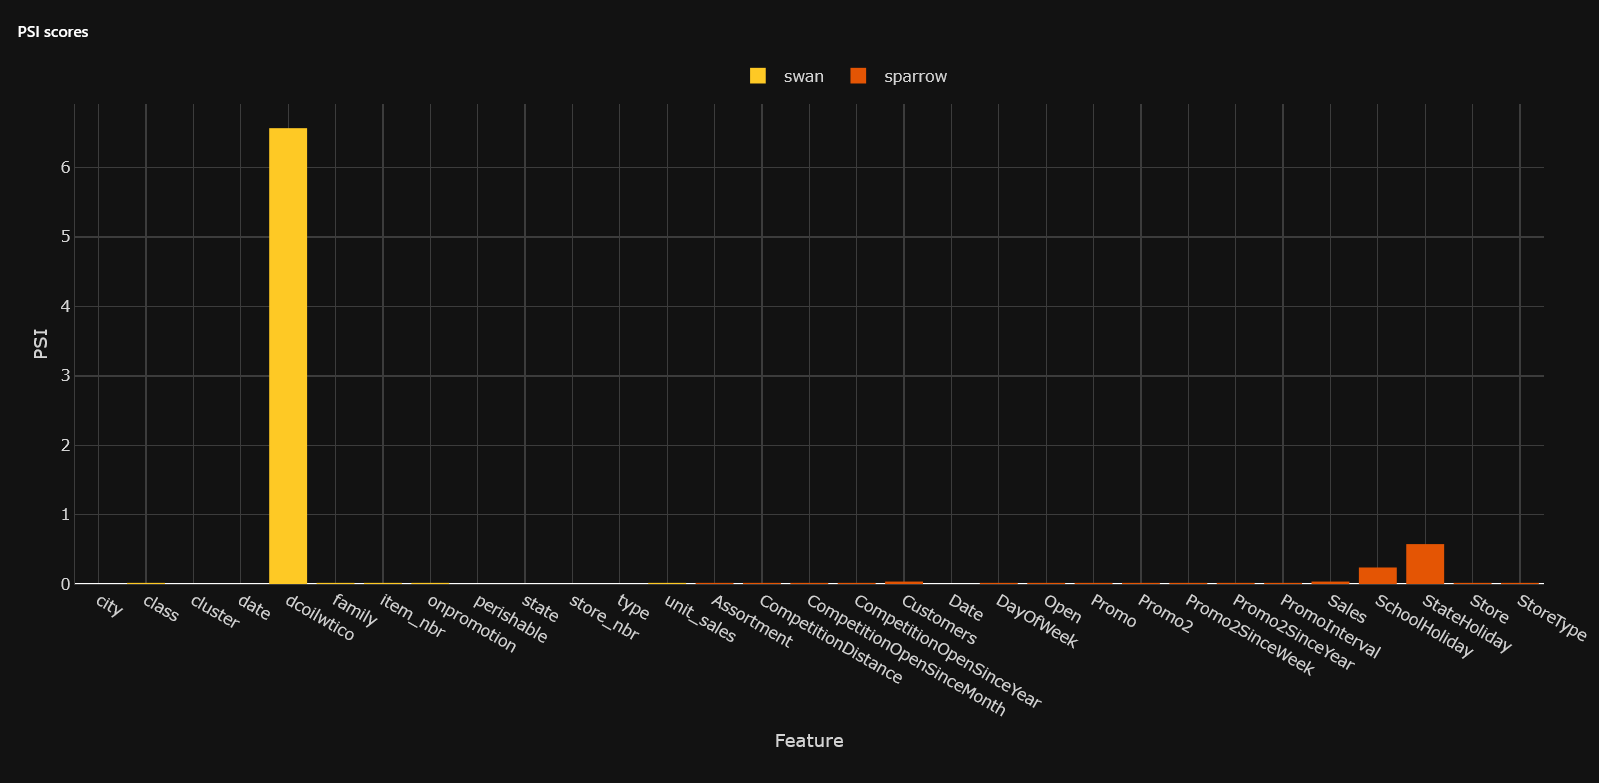
Bar graph: PSI scores
The PSI scores bar graph displays the Population Stability Index (PSI) for the features in both Drift Detection tests.
Size Dependency
H2O Model Validation offers several metrics in the form of graphs to understand the Size Dependency tests you compared. Below, each metric is described in turn.
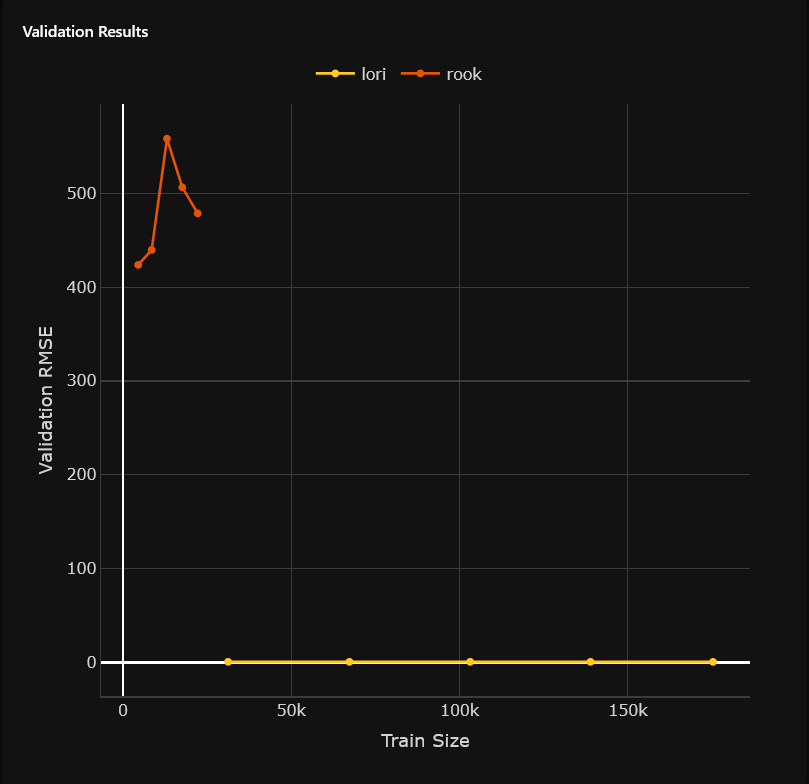
Graph: Validation results
The Validation results graph displays the validation {metric} values for both Size Dependency tests obtained with different training data sizes. {Metric}, in this case, refers to the scorer of the Driverless AI experiment selected to be analyzed with both validation tests (e.g., Root Mean Square Error (RMSE)).
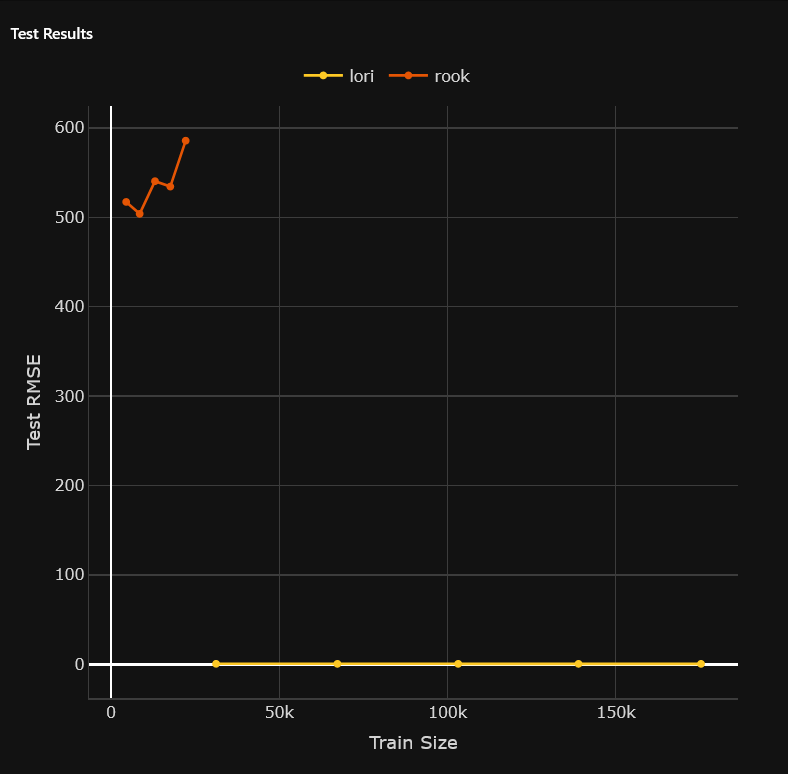
Graph: Test results
The Test results graph displays the test {metric} values for both Size Dependency tests obtained with different test data sizes. {Metric}, in this case, refers to the scorer of the Driverless AI experiment selected to be analyzed with both validation tests (e.g., Root Mean Square Error (RMSE)).
- Submit and view feedback for this page
- Send feedback about H2O Model Validation to cloud-feedback@h2o.ai