Metrics: Backtesting
H2O Model Validation offers an array of metrics in the form of graphs, a chart, a heatmap, and tables to understand a Backtesting test. Below, each metric is described in turn.
Graph: Backtesting {metric}
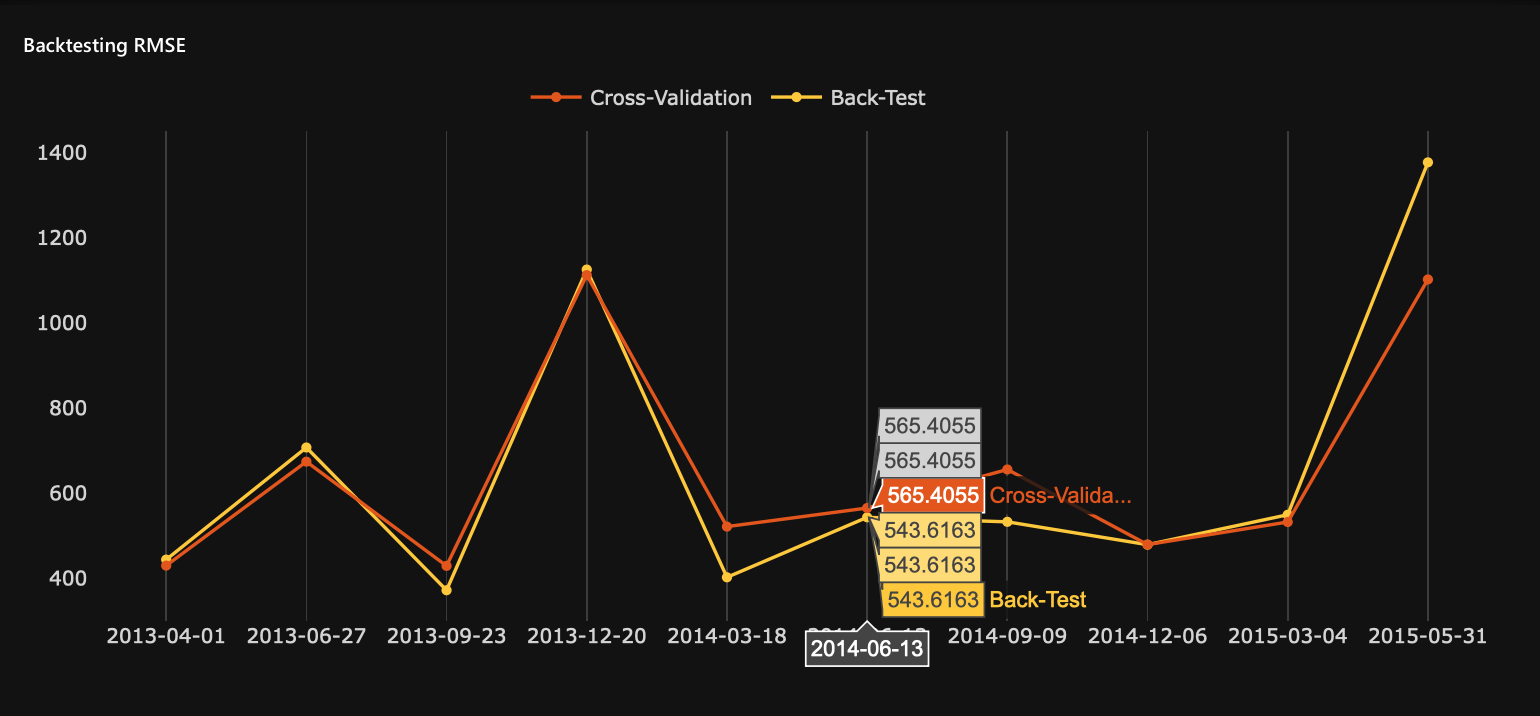
The Backtesting {metric} graph displays the dynamics of the backtested models' scorer value through time. In this case, {metric} refers to the model's scorer. In addition, you can use the graph to see the dynamics of the model (experiment) accuracy while discovering if accuracy depends on time. You can also use the graph to investigate past environmental changes during data collection that led to drops in model performance.
- Cross-Validation: Cross-Validation metric values calcualted on train datasets
- Back-Test: Backtesting metric values calculated on test datasets
- Y-Axis: Model's scorer (Backtesting
{metric}) - X-Axis: Date
Graph: Target distribution
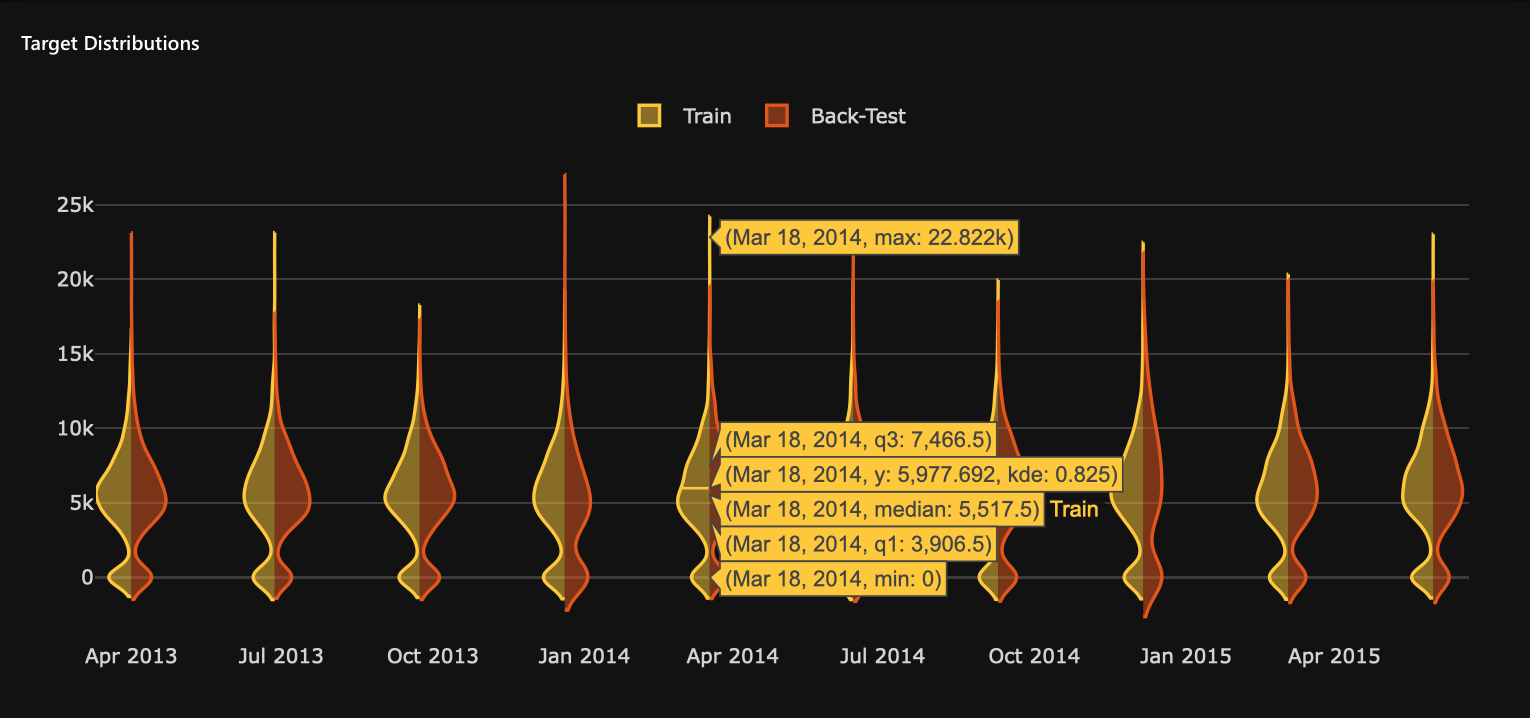
The Target distribution graph displays the target distribution of the train and test dataset. The train and test dataset refers to the datasets defined in the Backtesting validation test. You can use this graph to investigate model accuracy drops in the past due to a change in the target variable through time.
- Train: Target distribution values from the training dataset
- Back-Test: Target distribution values from the test dataset
Graph: Variable importance
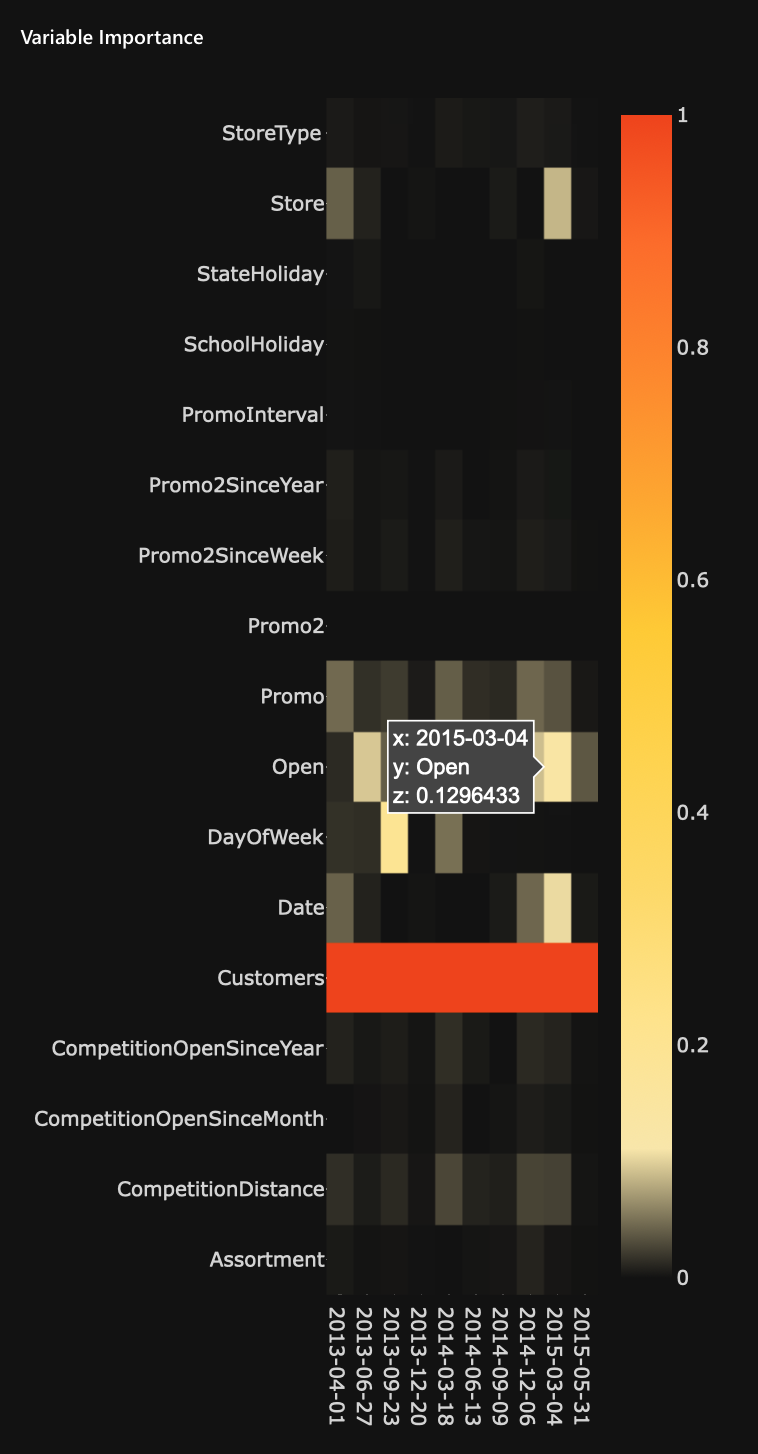
The Variable importance heatmap visualizes the most important features of the backtested models. The heatmap is helpful when investigating how variable importance evolves.
- Rows: Raw input variables
- Columns: Backtesting splits
- Heatmap values: Variable importance scorers
Graph: Feature drifts over time
The Feature drifts over time graph display the overtime Population Stability Index (PSI) score for all the variables. The PSI score for each feature (variable) is calculated by comparing feature distributions between training and test samples of the corresponding Backtesting split. The graph can help investigate the dynamics of the most important variable drifts over time and the resulting impact on the model performance.
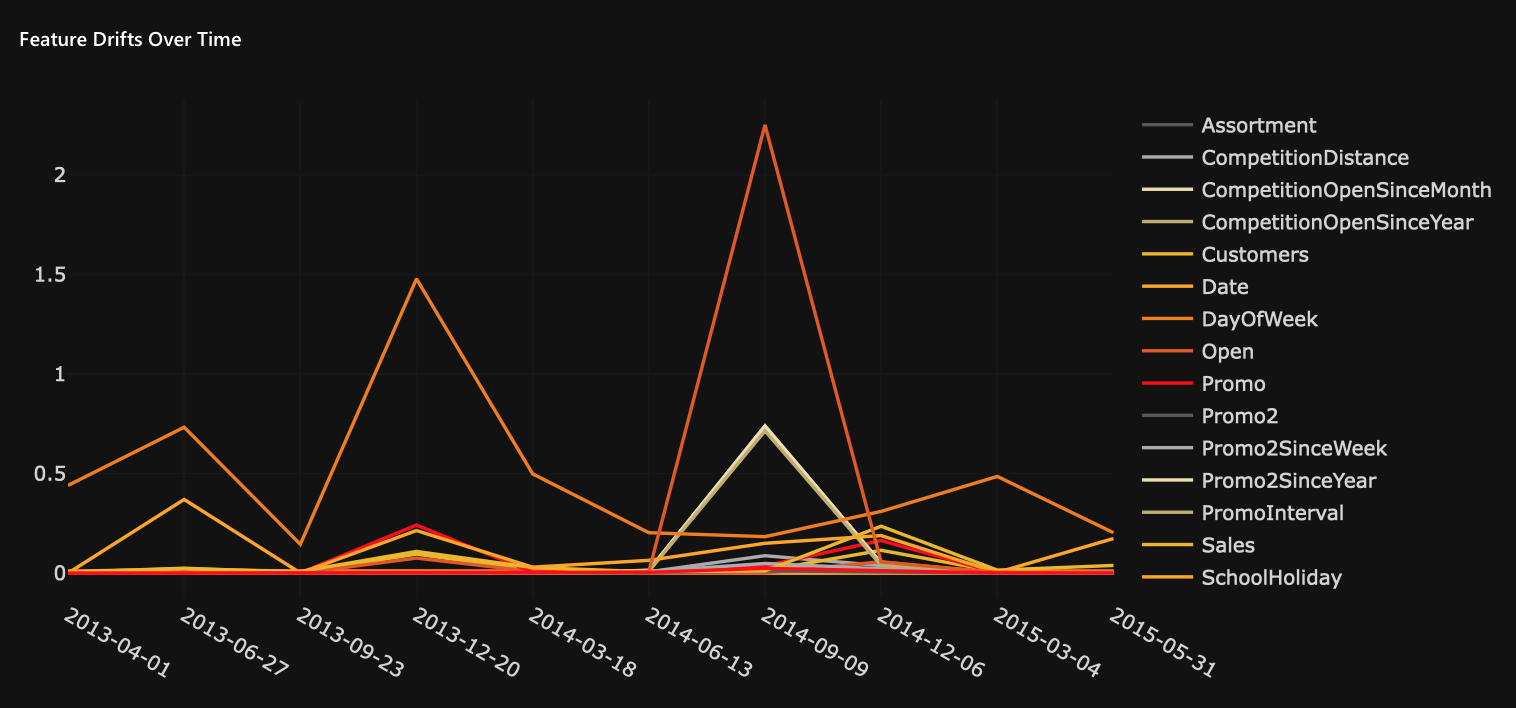
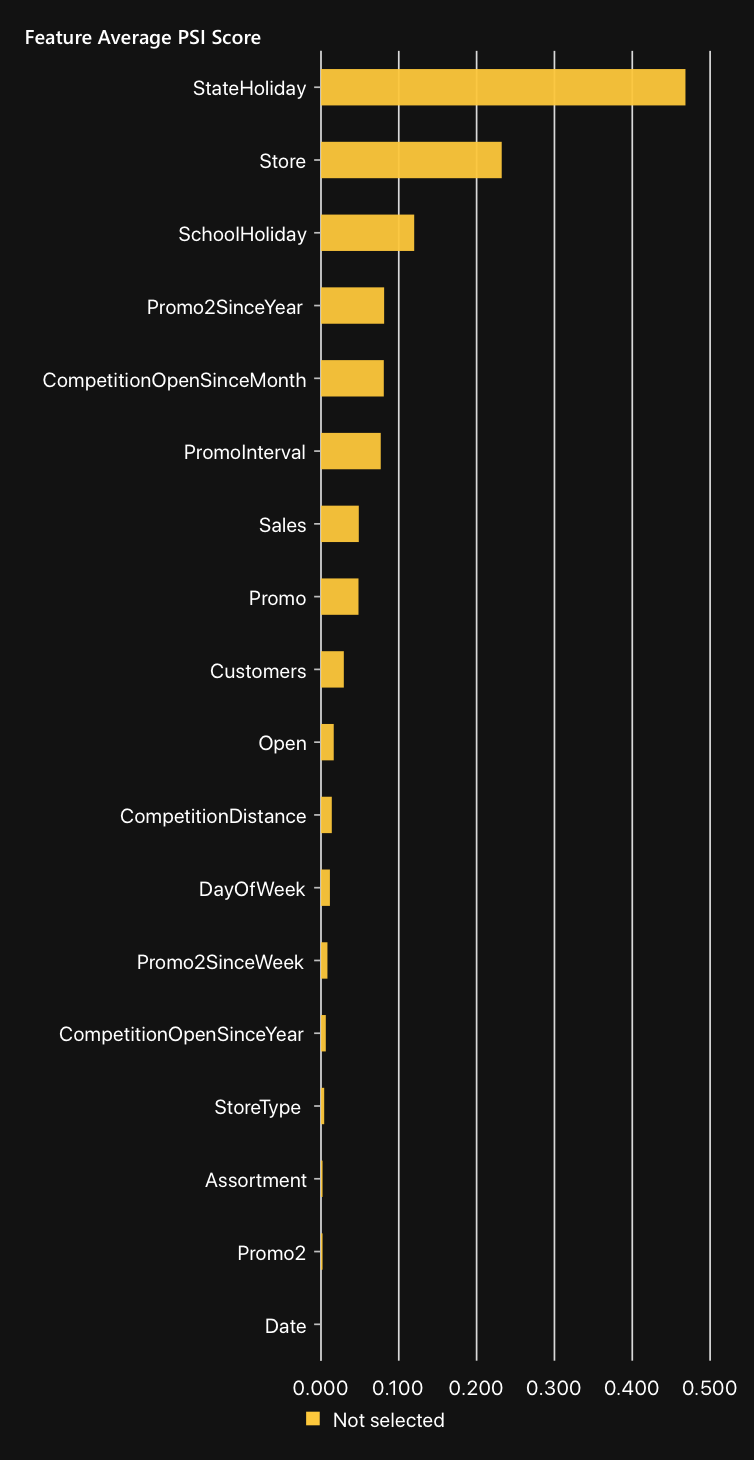
Chart: Feature average PSI score
The Feature average PSI score graph displays the top 25 features (variables) with the highest Population Stability Index (PSI) score during Backtesting. In other words, the chart displays features that drifted the most (on average) over time. Features are ordered from top to bottom, where H2O Model Validation orders features from highest to lowest PSI.
Clicking on the bar of a feature will trigger the display of a heatmap for the feature. To learn more, see Heatmap: Distribution of variable.
Heatmap: Distribution of variable
The Distribution of variable heatmap displays the distribution frequencies of the selected feature over the corresponding test samples during Backtesting. The selected feature refers to the selected feature on the Feature average PSI score chart.
- Rows: Variable values
- Column: Backtesting split dates
- Heatmap values: Distribution frequencies of the corresponding test sample
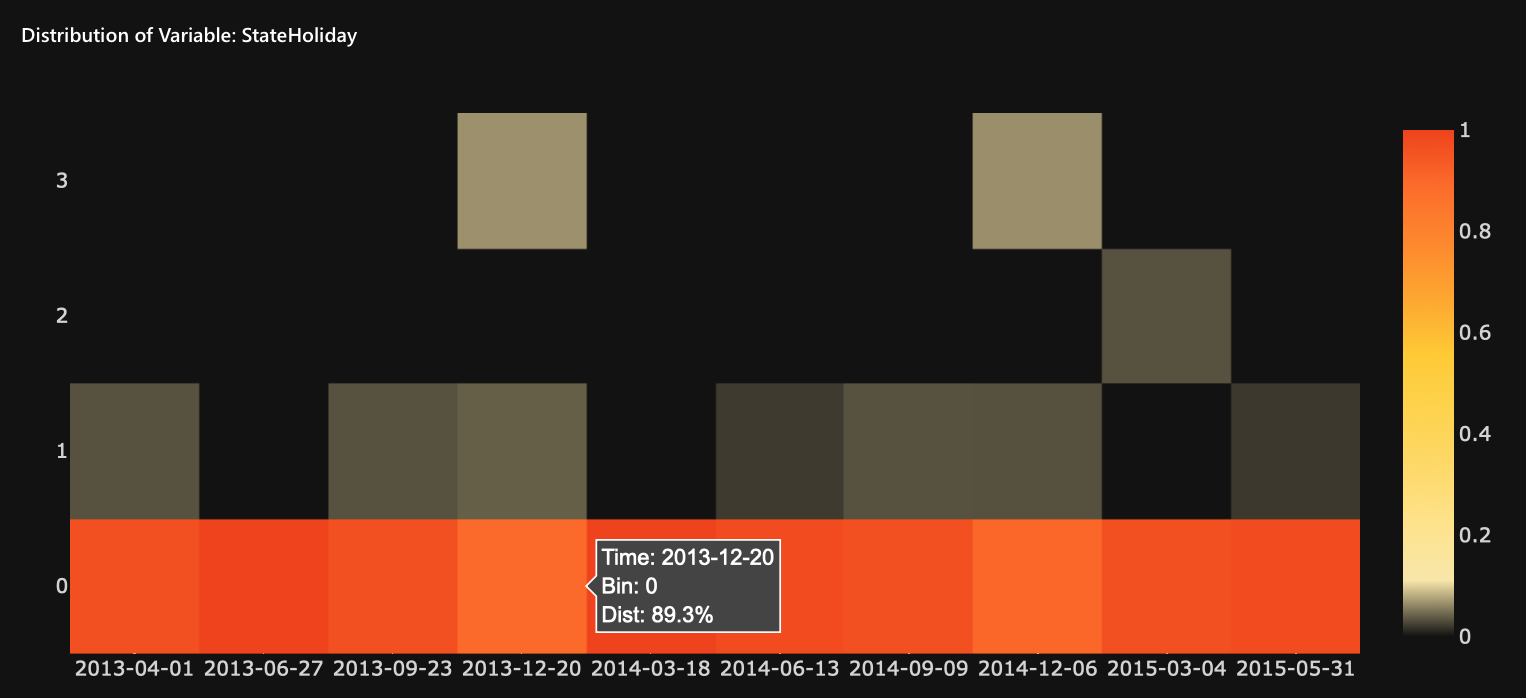
Table: Models summary
The Models summary table displays details about the models fitted during backtesting. H2O Model Validation displays the table to indicate the structure of the model over time and whether you can expect to see a change the next time you refit the model.
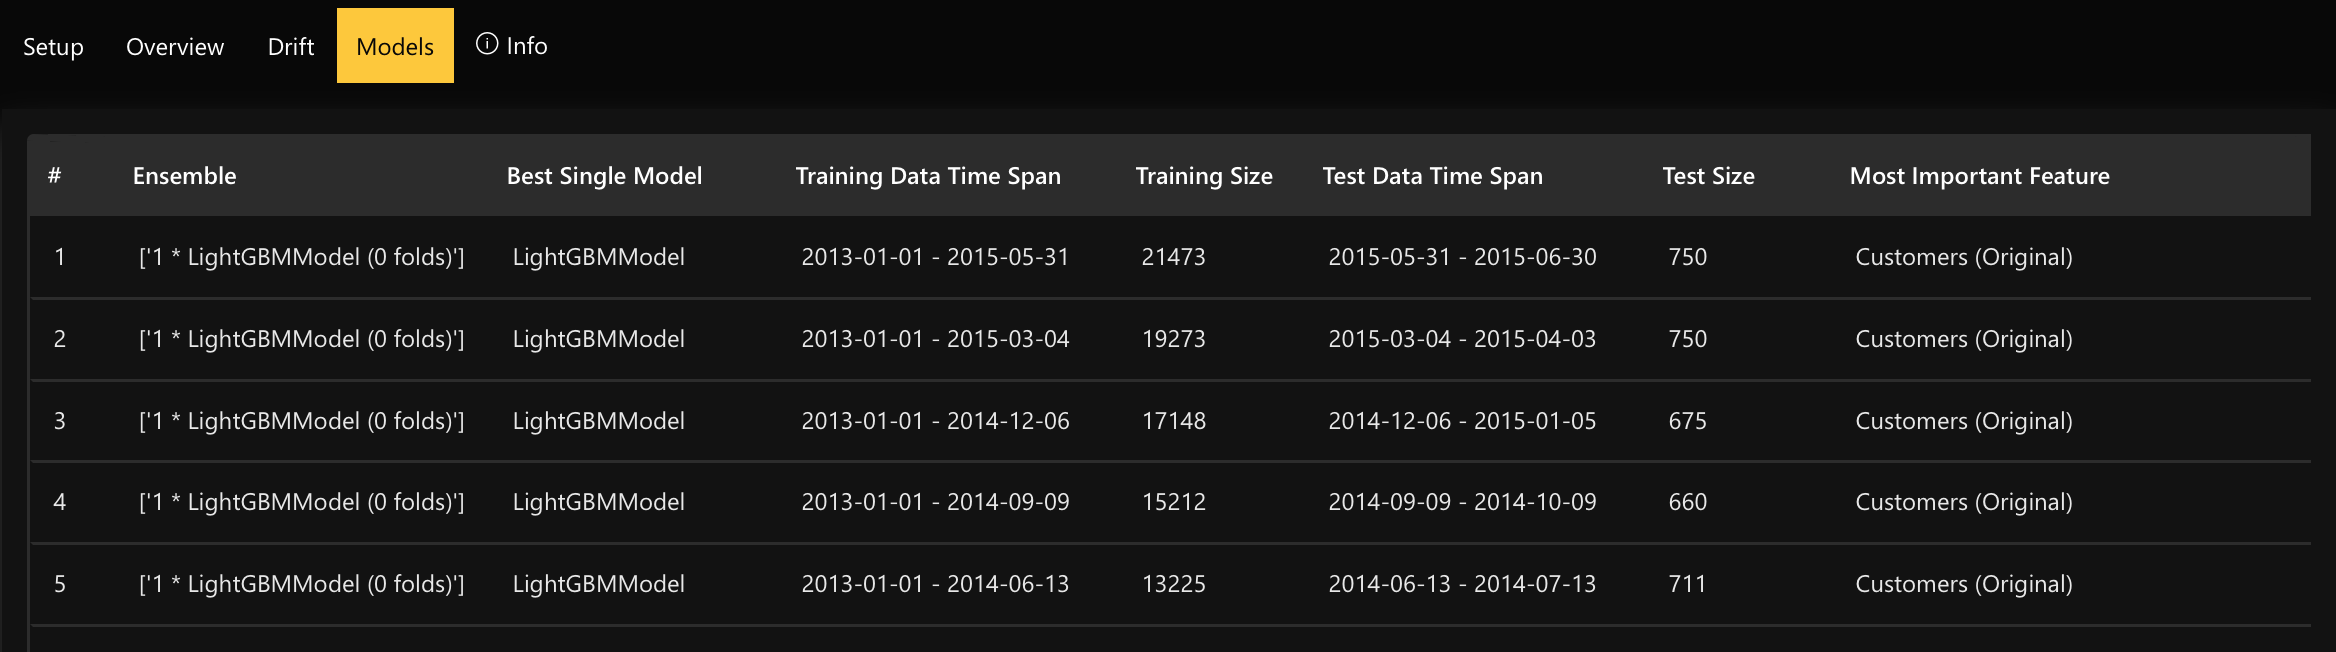
Table: Errors
The Errors table displays any errors when fitting the Backtesting models (e.g., insufficient data for the earliest Backtesting time spans).

- Submit and view feedback for this page
- Send feedback about H2O Model Validation to cloud-feedback@h2o.ai