Task 4: Explore Experiment results
Once the experiment is completed, the experiment summary page will appear. Let's explore the summary of the experiment results.
In the Experiments section select the experiment with the following name:
tutorial-4d:Let's review the experiment summary page, and determine the goodness and efficiency of the built model:
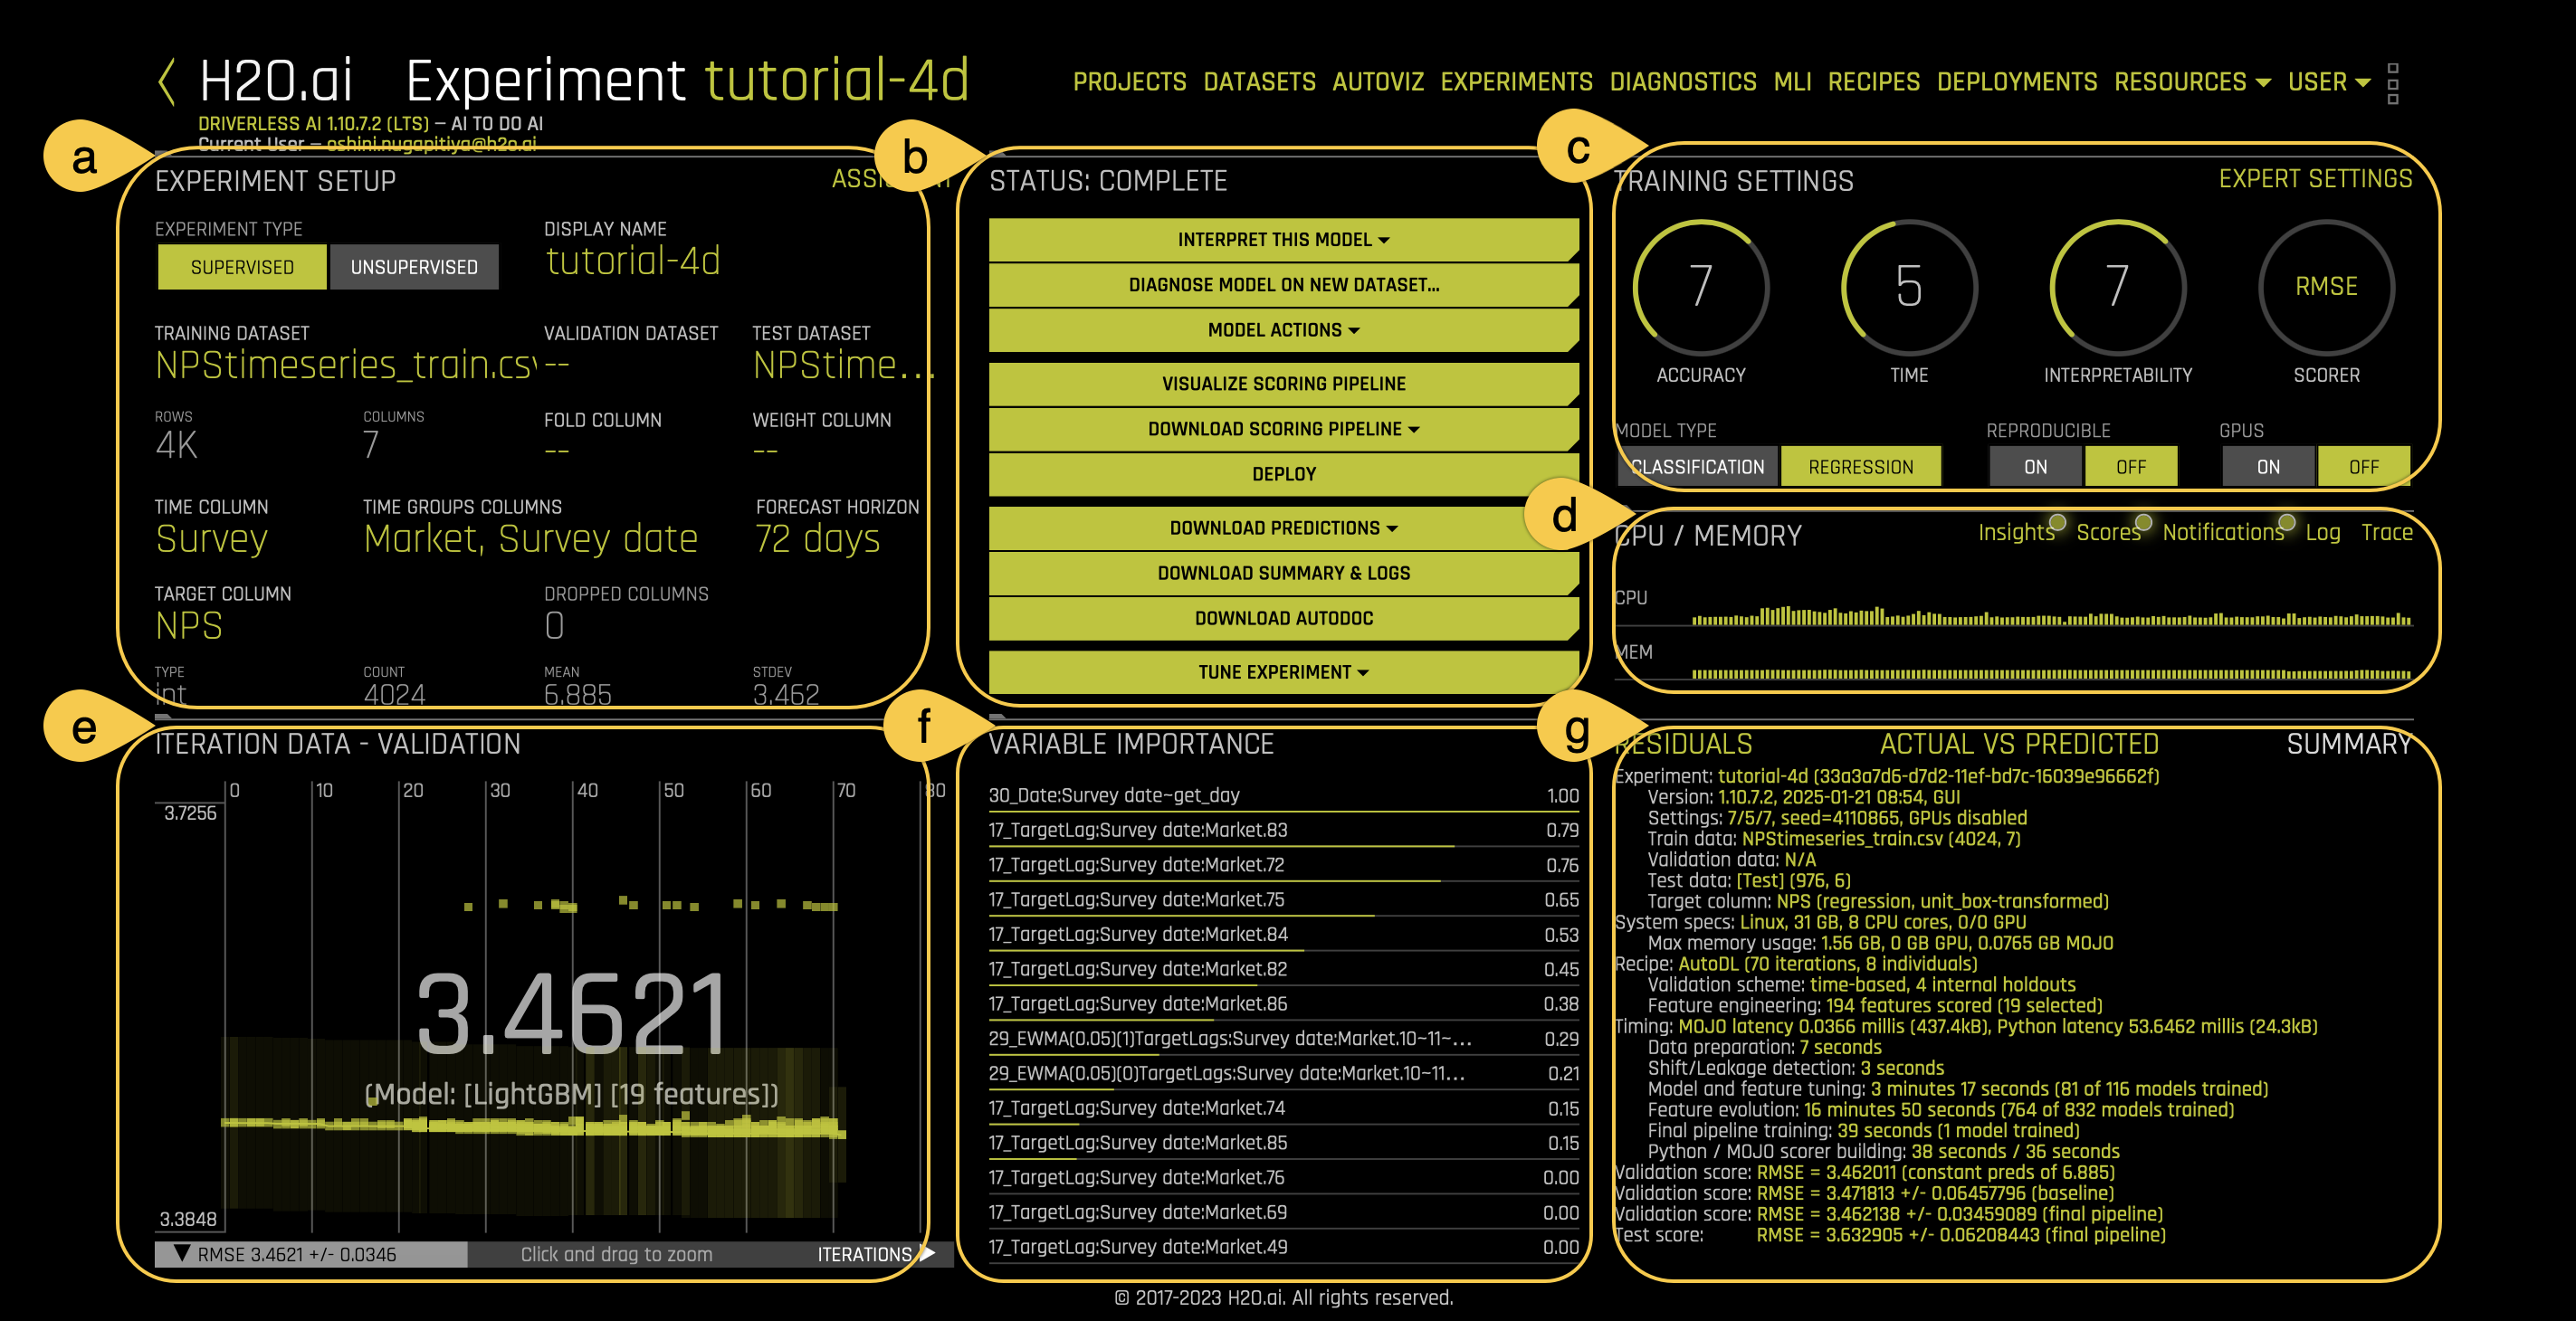
a. Experiment setup:
The Experiment Setup section displays a summary of the experiment setup and the information about which datasets are currently used for the running experiment.
b. Status:
The Status section provides a status on the training process of the model. Note that you can stop an experiment by clicking the Finish button. The following actions can be performed after the status of an experiment changes from Running to Complete:
- Interpret this model
- Diagnose model on new dataset
- Model actions
- Visualize scoring pipeline:
- Download scoring pipeline
- Deploy
- Download predictions
- Download summary & logs
- Download AutoDoc
- Tune Experiment
For more details on each of the actions mentioned above, see the b. Status in Tutorial 4A.
c. Training settings:
The Training Settings section offers a comprehensive overview of the configuration parameters used for the current experiment. For this tutorial, the settings configured during Task 3 are reflected in the Training settings section.
Training settings are fixed once the experiment begins and cannot be modified while it is running.
d. CPU/Memory:
The CPU/Memory section provides information around Insights (for time-series experiments), Scores, Notifications, Logs, and Trace.
For more information on CPU/Memory section, see d. CPU/Memory in Tutorial 4A.
e. Iteration data - Validation:
When you run an experiment in H2O Driverless AI, it uses an iterative process to build and improve your model. This process involves training multiple models across a series of iterations to identify the best-performing model. The Iteration data - Validation graph allows you to track and evaluate the performance of these models throughout the experiment.
For this experiment, the validation score is 0.0017.
For more information on iteration data, see e. Iteration data - Validation in Tutorial 4A.
f. Variable importance:
Variable importance provides a ranked visualization of how much each feature engineered variable contributes to the model's predictions. Each bar in the graph represents a feature, with longer bars indicating higher importance. Features are ranked from most to least impactful based on their influence on the target variable.
For more information on variable importance, see f. Variable importance in Tutorial 4A.
g. Summary:
This option provides a summary of the entire experiment. For more information about the details included in the summary, see the Summary section in tutorial 1A.
You have now explored the results of your experiment. In Task 5, you will learn how to create a new model diagnostic based on the successfully completed experiment.
- Submit and view feedback for this page
- Send feedback about H2O Driverless AI | Tutorials to cloud-feedback@h2o.ai