Task 4: Explore Experiment results
In this task, we will dig deeper and explore the results of the regression experiment you created in task 3.
Once the experiment is completed, the experiment summary page will appear. Let's explore the summary of the experiment results.
In the Experiments section, select the experiment with the following name:
tutorial-4aLet's review the experiment summary page, and determine the goodness and efficiency of the built model:
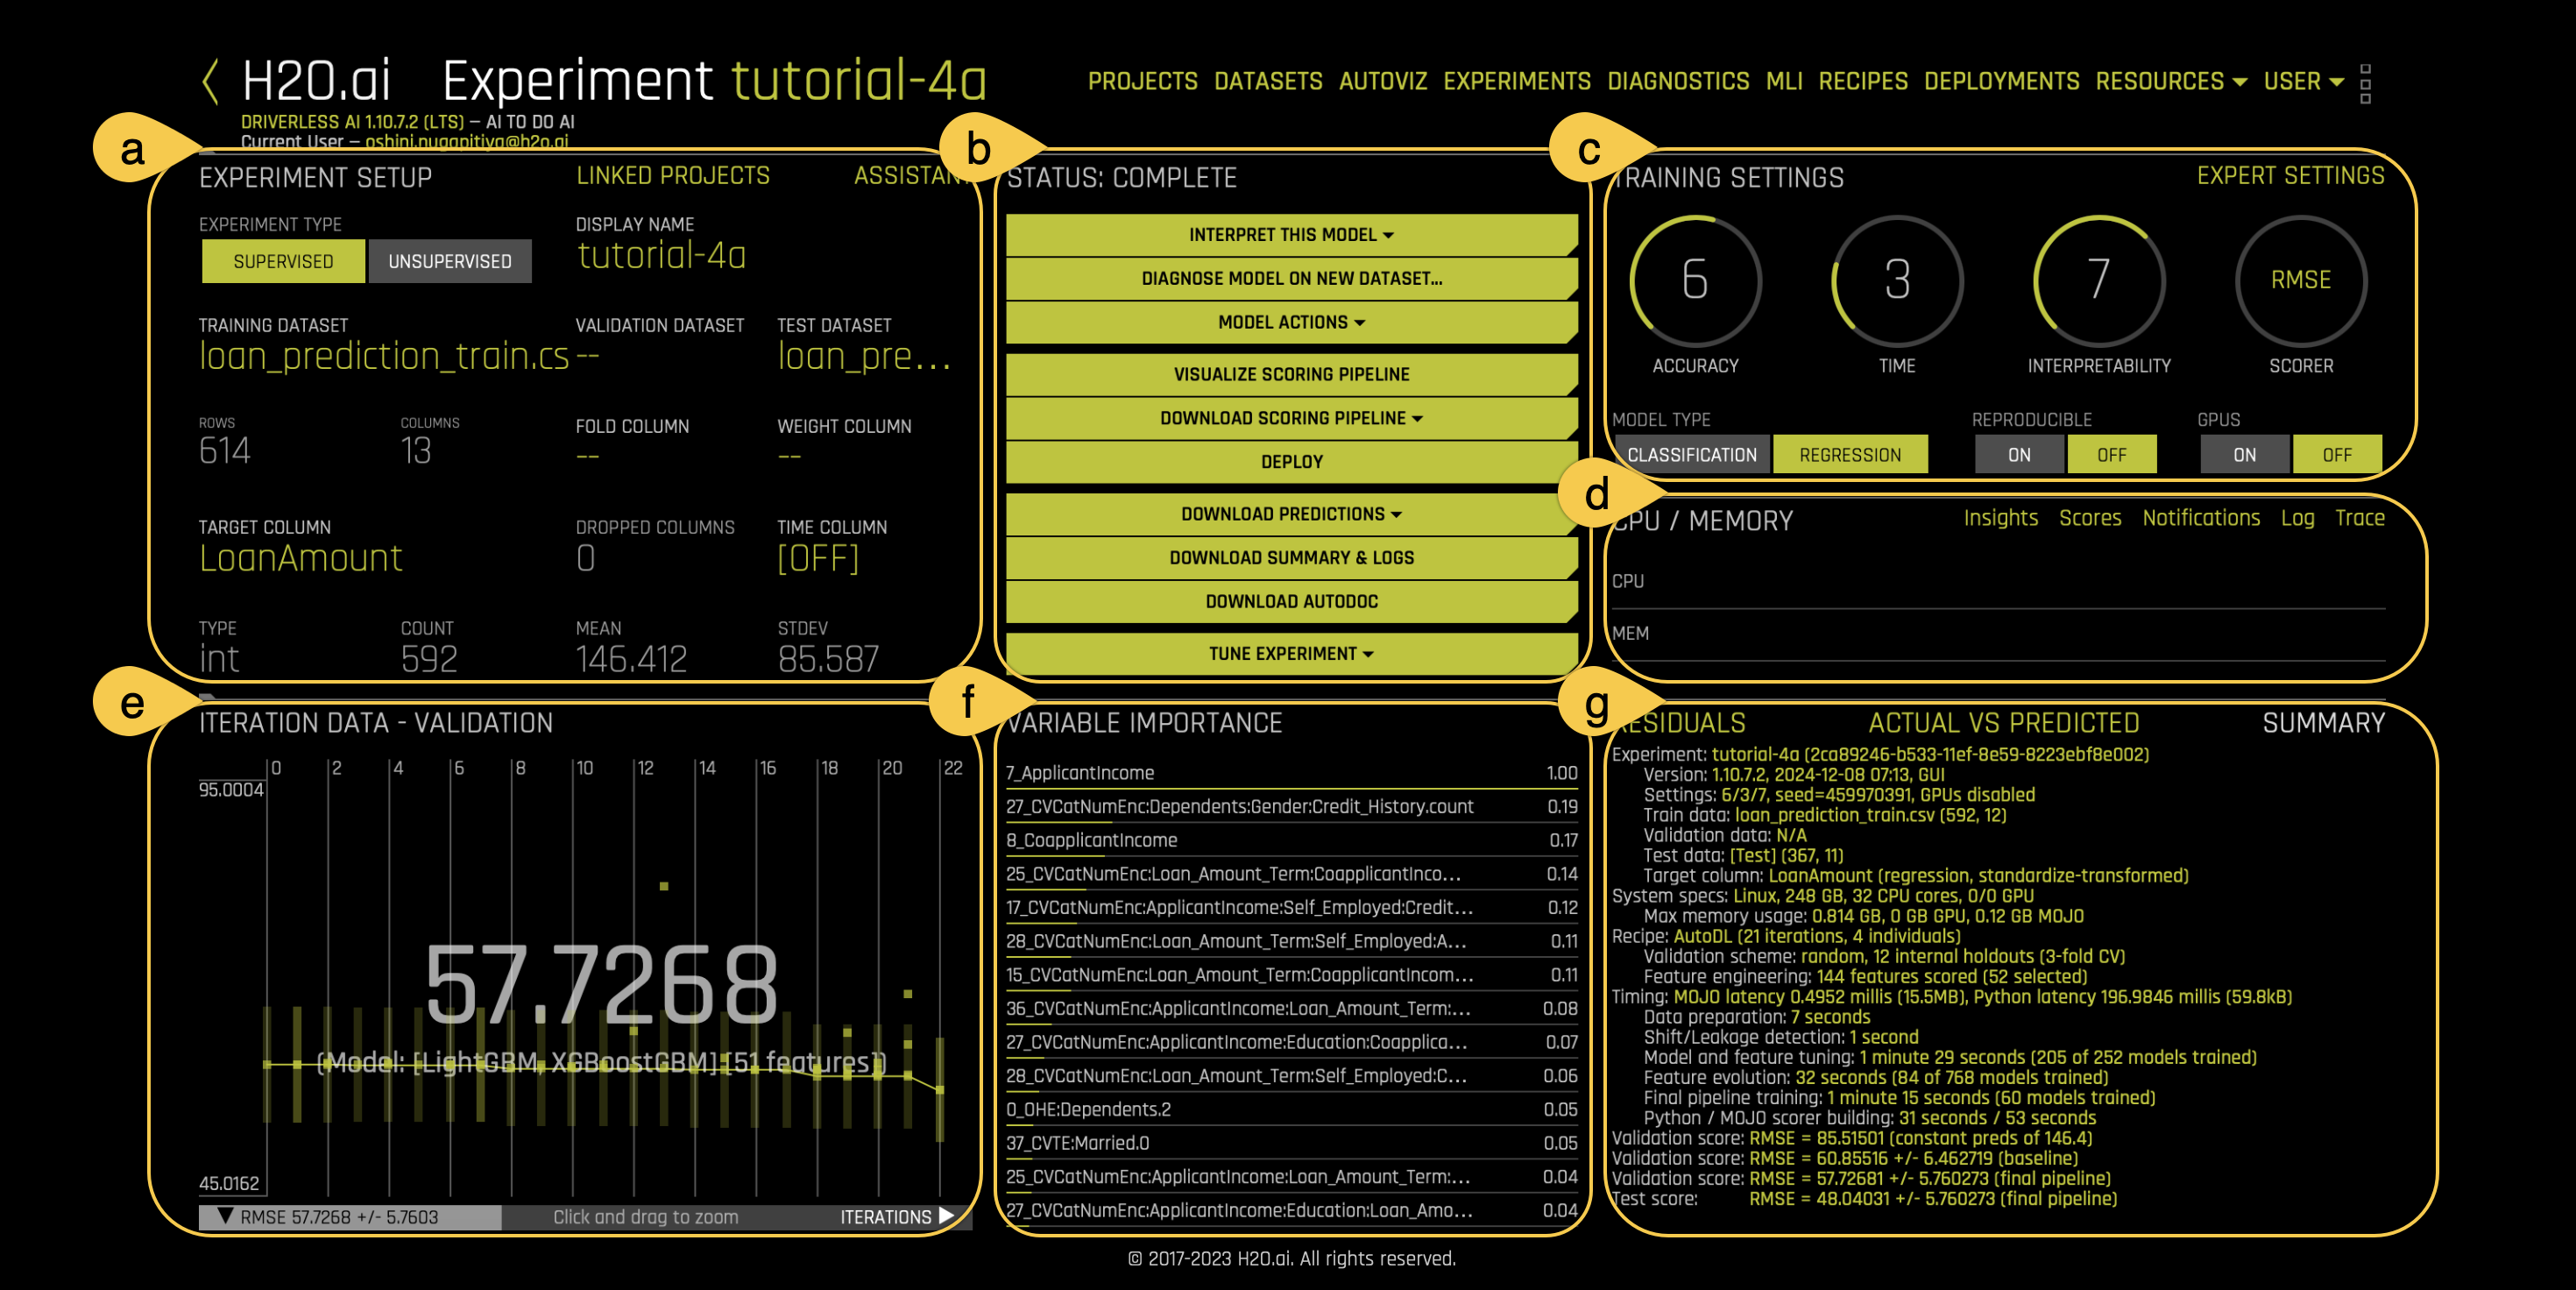
a. Experiment setup:
The Experiment Setup section displays a summary of the experiment setup and the information about which datasets are currently used for the running experiment.
b. Status:
The Status section provides a status on the training process of the model. Note that you can stop an experiment by clicking the Finish button. The following actions can be performed after the status of an experiment changes from Running to Complete:
Interpret this model (drop-down menu): can be used to create an interpretation of your model with the default settings, or with custom settings of your choosing. If an interpretation of the model already exists, you can view it by clicking Interpret this model > Show most recent interpretation.
Diagnose model on new dataset: lets you view model performance for multiple scorers based on existing model and dataset. Click the Diagnose model on new dataset button and select a dataset to use when diagnosing this experiment. Note that the dataset must include the target column that is in the original dataset. At this point, Driverless AI will begin calculating all available scores for the experiment. When the diagnosis is complete, it will be available on the Model diagnostics page.
noteYou can also diagnose a model by selecting Diagnostics from the top menu, then selecting an experiment and test dataset.
Model actions (drop-down menu):
- Analyze results: Opens experiment results wizard with the information such as the original feature importance and a Python client code to run the experiment.
- Predict: After you generate a model, you can use that model to make predictions on another dataset (test dataset). Click Predict and select the new dataset (test set) that you want to score on. This new dataset must include the same columns as the dataset used in selected experiment. Select the columns from the test set to include in the predictions frame and click Done to start the scoring process. Then click the Download predictions button after scoring is complete.
- Transform dataset: This option allows you to transform the dataset without fitting. For more information, see Transform dataset.
- Fit and transform dataset: This option allows you to transform a dataset which both fits and transforms the dataset. For more information, see Fit and transform dataset.
- Shapley values (drop-down menu): Shapley values are a way to explain how much each input feature contributes to the model's prediction. You can choose to download Shapley values for:
- Original features (Fast approximation): Shapley values for raw features using the fast approximation method.
- Original features: Shapley values for raw features using the standard method.
- Transformed features (Fast approximation): Shapley values for engineered features using the fast approximation method.
- Transformed features: Shapley values for engineered features using the standard method.
- Export: This option allows you to download the experiment to your device as a Driverless AI file. All exported H2O Driverless AI experiments have the
.daifile extension.
Visualize scoring pipeline: Provides a visualization of the experiment scoring pipeline. To view a visual representation of a specific model, click on the oval that corresponds with that model.
Download scoring pipeline (drop-down menu):
- Download Python scoring pipeline: Download a standalone Python scoring pipeline for H2O Driverless AI. For more information, refer to H2O Driverless AI Standalone Python Scoring Pipeline.
- Download MOJO scoring pipeline: Download a MOJO scoring pipeline. This standalone pipeline converts experiments to MOJOs that enable real-time scoring.
Deploy: This option allows you to deploy H2O Driverless AI model to H2O MLOps or Triton. For information on deploying DAI models, see Deploy Driverless AI models.
Download predictions: For regression experiments, output includes predictions with lower and upper bounds. For classification experiments, output includes probability for each class and labels created by using the threshold_scorer. For binary problems, F1 is the default threshold_scorer, so if a validation set is provided, then the threshold for max F1 on the validation set is used to create the labels. When performing cross validation, the mean of thresholds for max F1 on internal validation folds is used to create the labels. For multiclass problems, argmax is used to create the labels.
- Training (Holdout) predictions: In CSV format, available if a validation set was not provided. Note that for this option, the training predictions file contains predictions for the test (holdout) part of the dataset. This file is provided for evaluation purposes, and it corresponds to the data that was set aside for testing during the classic training/test split.
- Test set predictions: In CSV format, available if a validation set was provided. Test Set Predictions: In CSV format, available if a test dataset is used.
Download summary & logs: An experiment summary is available for each completed experiment. The files within the experiment summary
zipprovide textual explanations of the graphical representations that are shown on the H2O Driverless AI UI. For more information, see Experiment summary.Download AutoDoc: Download an auto-generated report for the experiment as a Word (DOCX) document. The AutoDoc feature is used to generate automated machine learning documentation for individual H2O Driverless AI experiments. This editable document contains an overview of the experiment and includes other significant details like feature engineering and final model performance.
Tune Experiment (drop-down menu): Tune the completed experiment by using the following options:
- New / Continue: Select one of the following options:
- With same settings: Create a new experiment that copies the setup of the original experiment. Selecting this option takes you to the Experiment Setup page, where you can change any parameter of the original experiment.
- From last checkpoint: Create a new experiment that copies the setup of the original experiment and continues from the last iteration’s checkpoint of models and features. Selecting this option takes you to the Experiment Setup page, where you can change any parameter of the original experiment.
- Retrain / Refit: Retrain the experiment’s final pipeline. For more information, see Retrain / Refit. Select one of the following options:
- From Final Checkpoint: This opens the Experiment Setup page with the same settings as the original experiment except that Time is set to 0. When retraining an experiment’s final pipeline, H2O Driverless AI also refits the experiment’s final model(s). This may include the addition of new features, the exclusion of previously used features, a change in the hyperparameter search space, or finding new parameters for the existing model architecture.
- From Best Models: Select this option to retrain the final pipeline without adding new features.
- Create Individual Recipe: Create the Individual Recipe for the experiment being viewed. After the Individual Recipe has been created, you can either download it to your device or upload it as a Custom Recipe.
- New / Continue: Select one of the following options:
c. Training settings:
The Training Settings section offers a comprehensive overview of the configuration parameters used for the current experiment. For this tutorial, the details entered during Task 3 are reflected in the Training settings section
Training settings are fixed once the experiment begins and cannot be modified while it is running.
d. CPU/Memory:
The CPU/Memory section provides information around Insights (for time-series experiments), Scores, Notifications, Logs, and Trace.
- Trace is used for development/debugging and to show what the system is doing at that moment.
- Scores or model scores allow you to view the detailed information about model scores after an experiment is complete.
- While the experiment is running, you can access the logs by clicking on the Log button on the experiment screen.
- Notifications inform you of different aspects of the experiment running(e.g., Shift in variable importance detected). Clicking on the Log button will present the experiment logs in real-time. You can download these logs by clicking on the Download Logs button in the upper right corner.
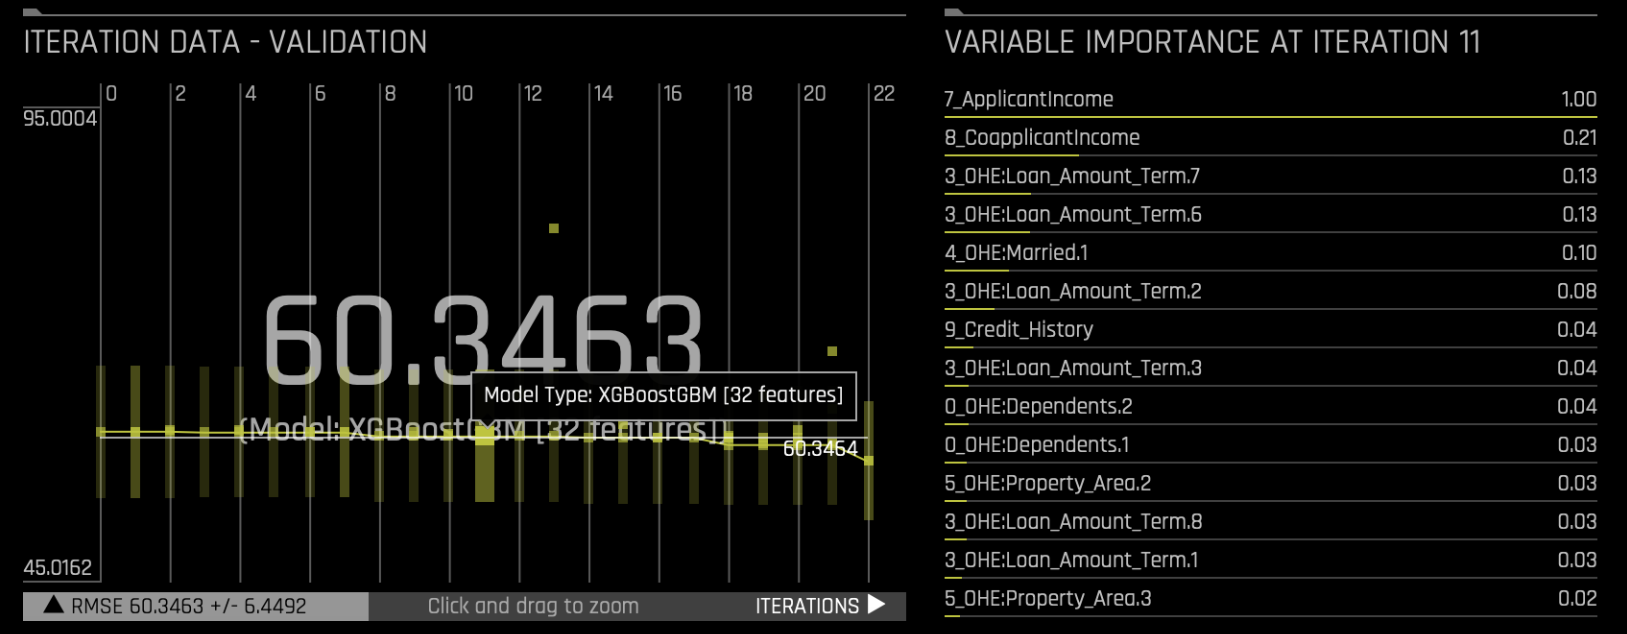
e. Iteration data - Validation:
When you run an experiment in H2O Driverless AI, it uses an iterative process to build and improve your model. This process involves training multiple models across a series of iterations to identify the best-performing model. The Iteration data - Validation graph allows you to track and evaluate the performance of these models throughout the experiment.
- Performance range: The left side of the graph displays the minimum and maximum scorer values. It provides an overview of the experiment’s performance range.
- Axes:
- The X-axis represents the iterations, determined by the maximum number specified by the Time setting in Task 3.
- The Y-axis indicates the range of the chosen metric.
During each iteration, machine learning models are trained using an evolutionary training process. These models are represented by green dots on the graph. Each dot corresponds to an individual model trained during a specific iteration. H2O Driverless AI learns from each iteration and gradually refines the models to identify the best performer.
You can hover over the green dots to see how Variable importance dynamically updates, providing a ranked visualization of each feature engineered variable's contribution to the model's predictions at each iteration.
f. Variable importance:
Variable importance provides a ranked visualization of how much each feature engineered variable contributes to the model's predictions. Each bar in the graph represents a feature, with longer bars indicating higher importance. Features are ranked from most to least impactful based on their influence on the target variable.
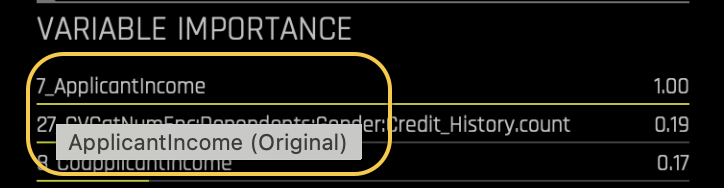
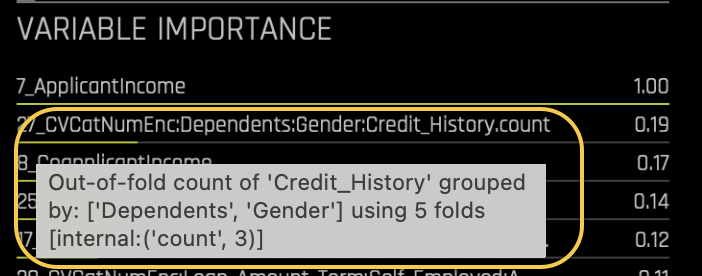
Hover over any feature in the graph to view additional information, such as details about the original and transformed features.
Original features are the raw, unaltered variables from your dataset. They do not have any prefixes or transformations applied. In the Variable importance graph these features appear with their original names as they were in the dataset.
Transformed features are those that have undergone feature engineering to enhance their predictive value. These features are encoded with a prefix that provides details about the transformation applied. In the below example,
CVCatNumEncis the transformation type.Dependents:Gender:Credit_Historyrepresent original features used.
g. Summary:
This option provides a summary of the entire experiment. For more information about the details included in the summary, see the Summary section in tutorial 1A.
You have now explored the results of your experiment. In Task 5, you will learn how to create a new model diagnostic based on the successfully completed experiment.
- Submit and view feedback for this page
- Send feedback about H2O Driverless AI | Tutorials to cloud-feedback@h2o.ai