Tutorial 1A: Default hyperparameter values
Overview
This tutorial builds an Image regression model capable of predicting the sum of coins in images. While building and training the model, this tutorial focuses on how you can generate fairly accurate machine learning models with default hyperparameter values derived from model training best practices used by top Kaggle grandmasters.
Also, this tutorial highlights available charts to understand the impact of selected hyperparameter values on the model's training.
Objectives
- Learn how to utilize default hyperparameter values: The tutorial highlights building a fairly accurate machine learning model using default hyperparameter values.
- Learn how to evaluate the impact of hyperparameter values on a model: In the tutorial, you'll learn about available charts to understand the impact of selected hyperparameter values on the model's training.
Prerequisites
- Access to H2O Hydrogen Torch v1.4.0
- Basic knowledge of image regression and neural network training
Step 1: Import and explore dataset
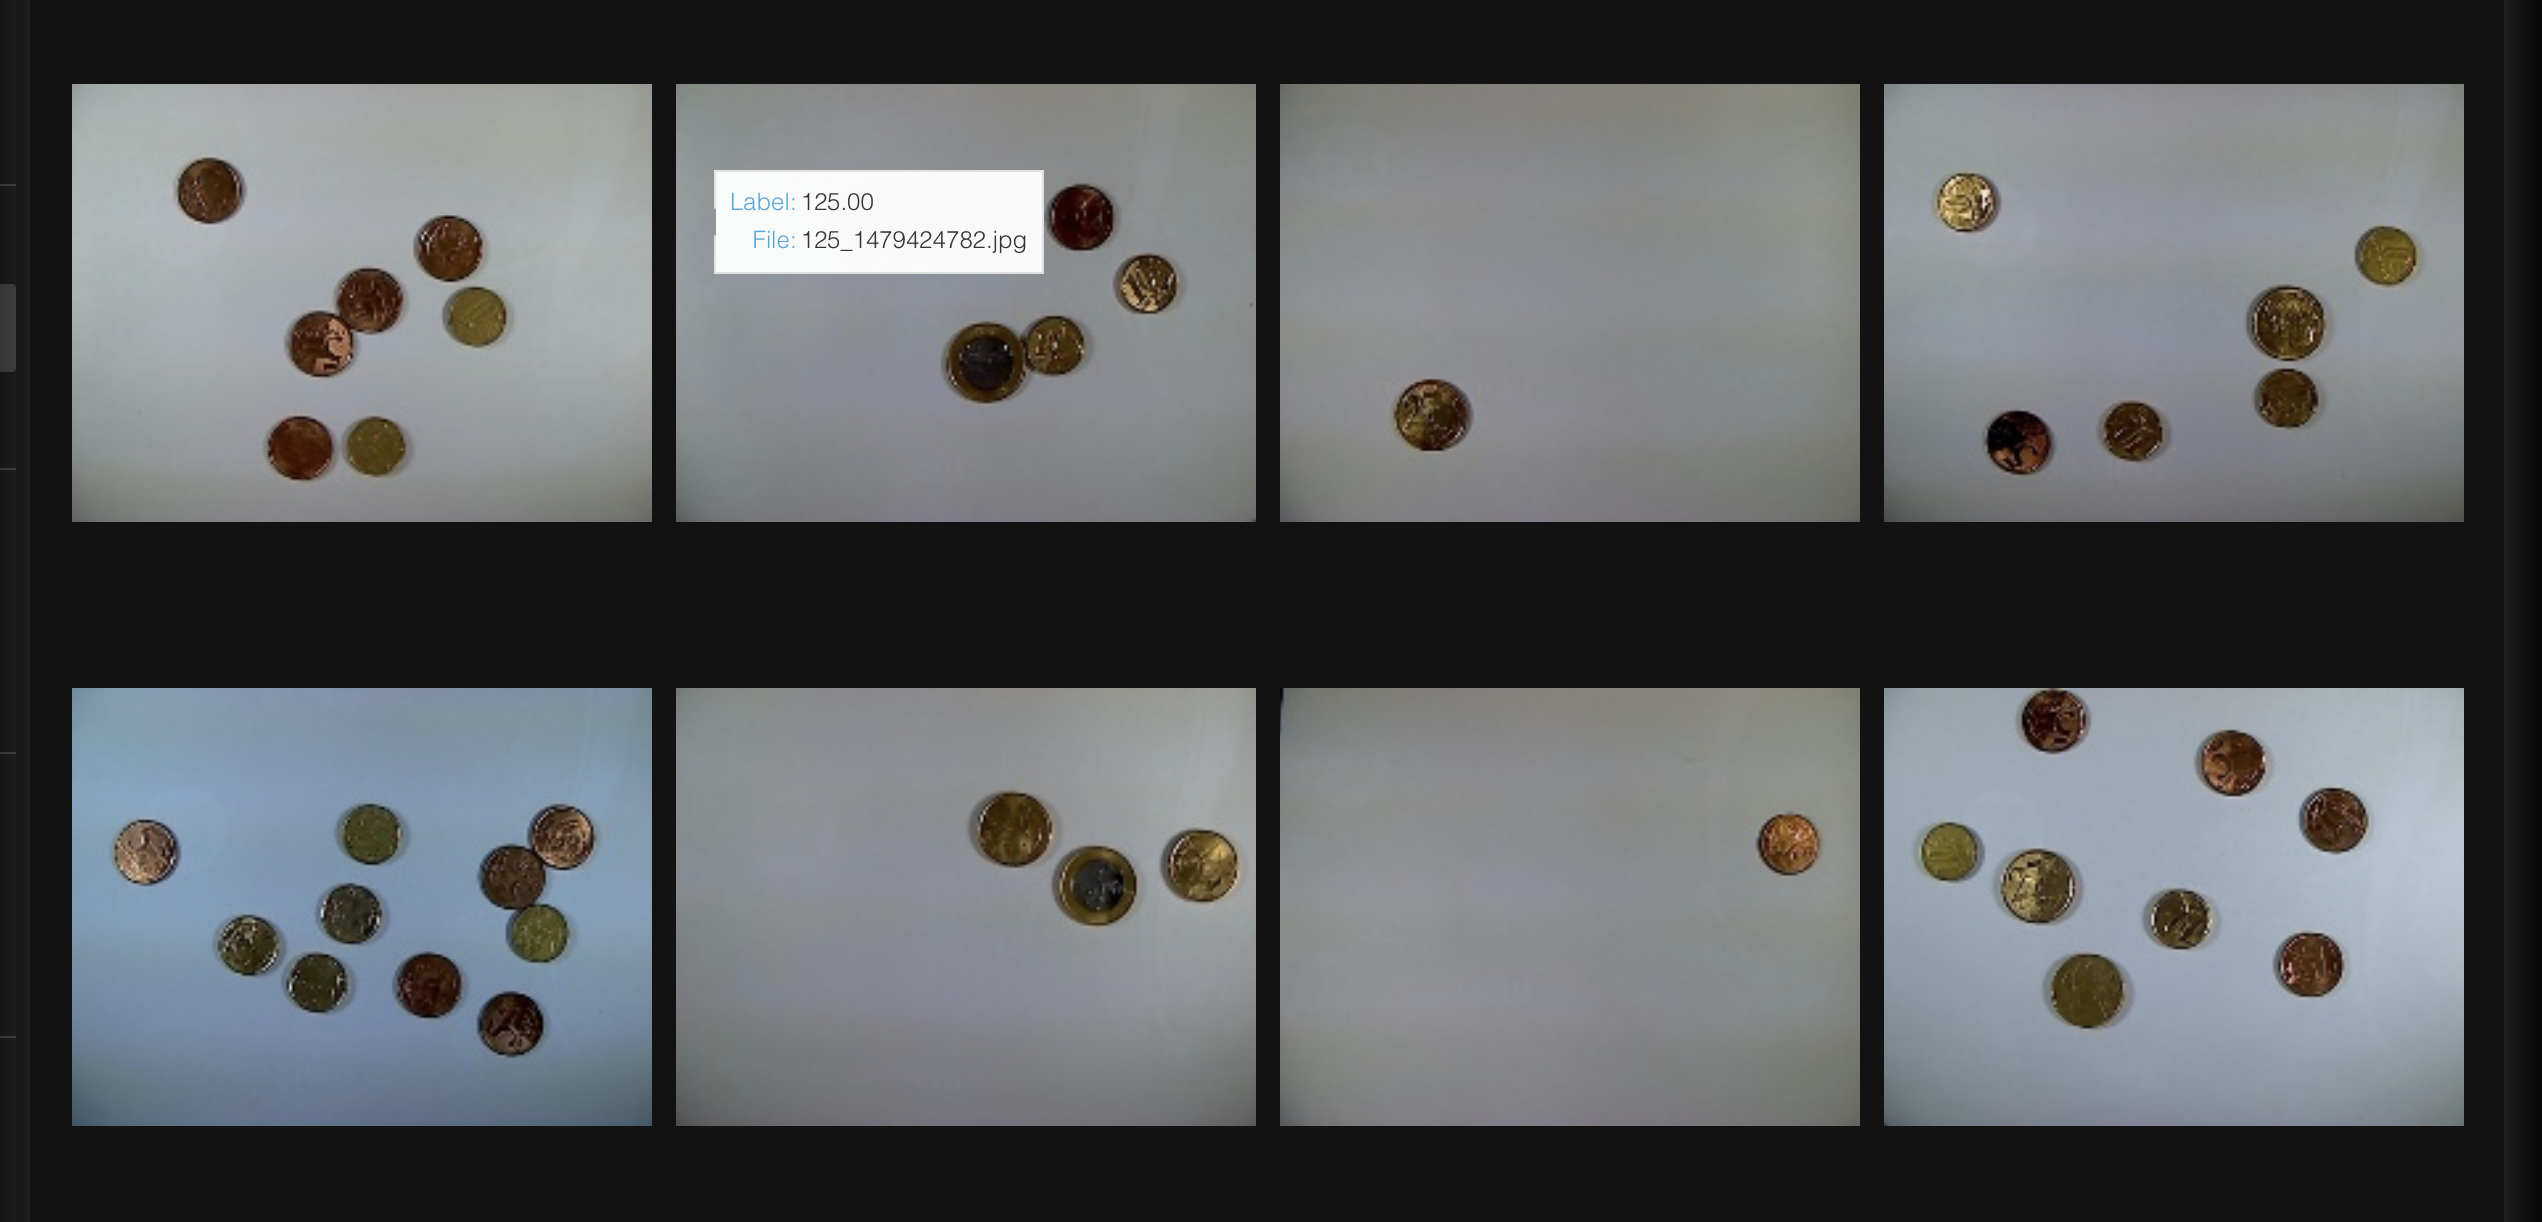
For this tutorial, let's utilize the demo out-of-the-box preprocessed coins_image_regression.zip dataset. The dataset contains a collection of 6,028 images with one or more coins. Each image has been labeled to indicate the sum of its coins. The currency of the coins is the Brazilian real. Let's import the dataset.
- In the H2O Hydrogen Torch navigation menu, click Import dataset.
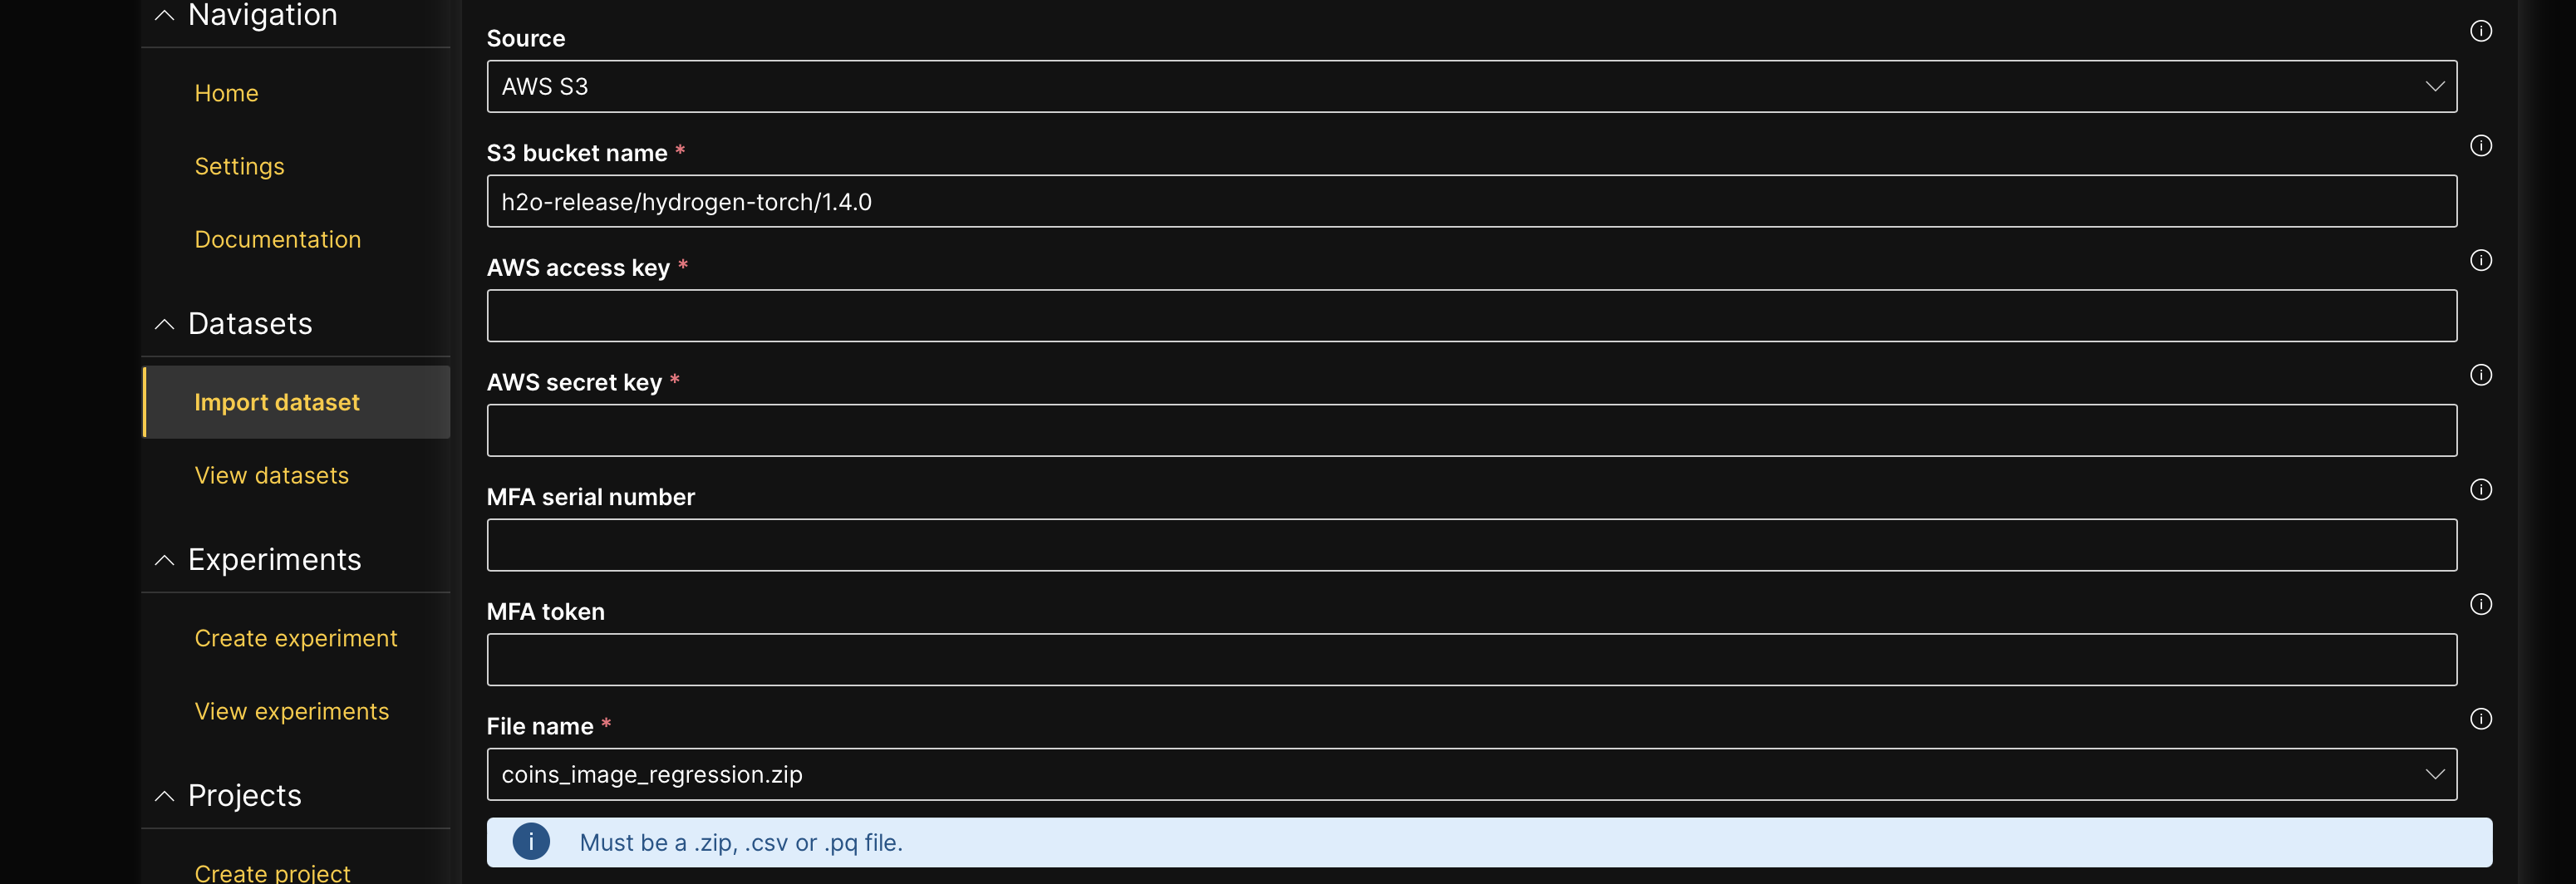
- In the File name list, select coins_image_regression.zip.
- Click Continue.
- Click Continue.
- Click Continue.
Now that the dataset has been imported, let's quickly explore the dataset.
- In the Datasets table, click coins_image_regression.
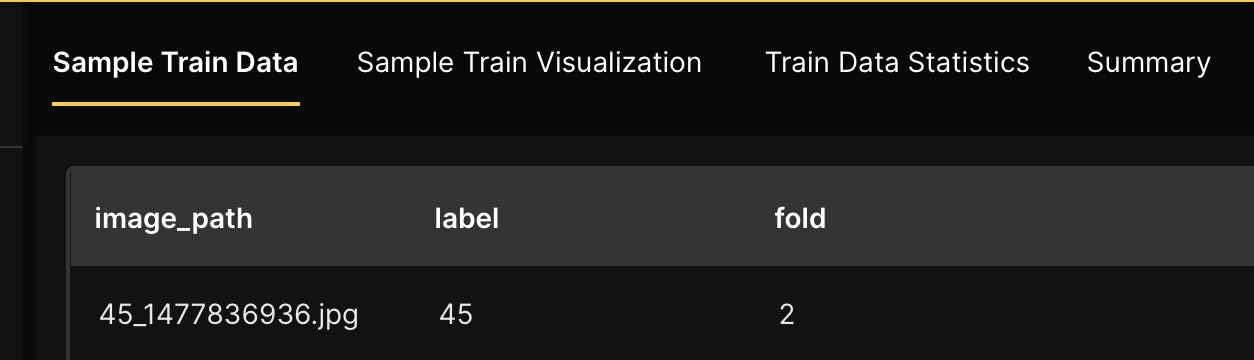
On the Sample train data tab, we can observe 3 columns and few of the 6,028 rows in the dataset. Each row in the dataset contains the name of an image (image_path column) depicting several coins that add up to a certain sum recorded in the label column.
As a requirement, H2O Hydrogen Torch requires the dataset for an experiment to be preprocessed to follow a certain dataset format for the problem type the experiment aims to solve. The coins_image_regression.zip dataset was preprocessed to follow a dataset format for an image regression model. To learn more, see Dataset formats.
Step 2: Build model
Using default hyperparameter values derived from model training best practices used by top Kaggle grandmasters, let's build an image regression model capable of predicting the sum of coins an image contains.
- Click Create experiment.

- After selecting a dataset for an experiment, H2O Hydrogen Torch autodetects the dataset type and displays appropriate settings for the experiment. For all the hyperparameters available for an image regression model, H2O Hydrogen Torch assigns each hyperparameter with a default value while considering model training best practices used by top Kaggle grandmasters. For purposes of this tutorial, let's utilize all default hyperparameter values.
note
To learn about the available settings for an image regression experiment, see Experiment settings: Image regression.
- In the Experiment name box, enter
tutorial-1a. - Click Run experiment.
Step 3: Evaluate model
In the Experiments card, you can view all running and completed experiments. H2O Hydrogen Torch marks an experiment as completed when its status changes to Finished.
After a few minutes, you can evaluate the trained model. To evaluate the impact of selected hyperparameter values on the model, you can access certain charts that highlighting a model's performance metrics. Let's view the charts.
The prediction metrics in the charts from your model might differ from those discussed from this point on as a result of how training data is utilized at the start and during the model's training process.
-
In the Experiments table, click tutorial-1a
noteIf you access the experiment before it is completed, you might not be able to view the charts, as charts are rendered after the model can provide the relevant metrics to observe. Therefore, you should refresh the charts. To refresh the charts, Click Refresh.
- Learning rate: This chart shows how the learning rate changes during training, updated after each training batch. To learn more, see Learning rate.
- Train batch loss: This chart illustrates the training loss over the course of training, updated after each training batch. To learn more, see Train batch loss.
- Validation batch loss: This chart displays the current validation loss throughout the training process. Loss is calculated as the average of all validation batches. By default, it is calculated and visualized after each training epoch, but this frequency can be adjusted via the Evaluation epochs setting when creating an experiment. To learn more, see Validation batch loss.
- Validation
{metric}: This chart displays the current validation metric throughout the training process. In this case, the{metric}refers to the selected metric for the problem type (for example, mean absolute error (MAE) for the built image regression model).{Metric}is calculated on full validation set predictions. By default, it is calculated and visualized after each training epoch, but this frequency can be adjusted via the Evaluation epochs setting when creating an experiment. To learn more, see Validation{metric}.
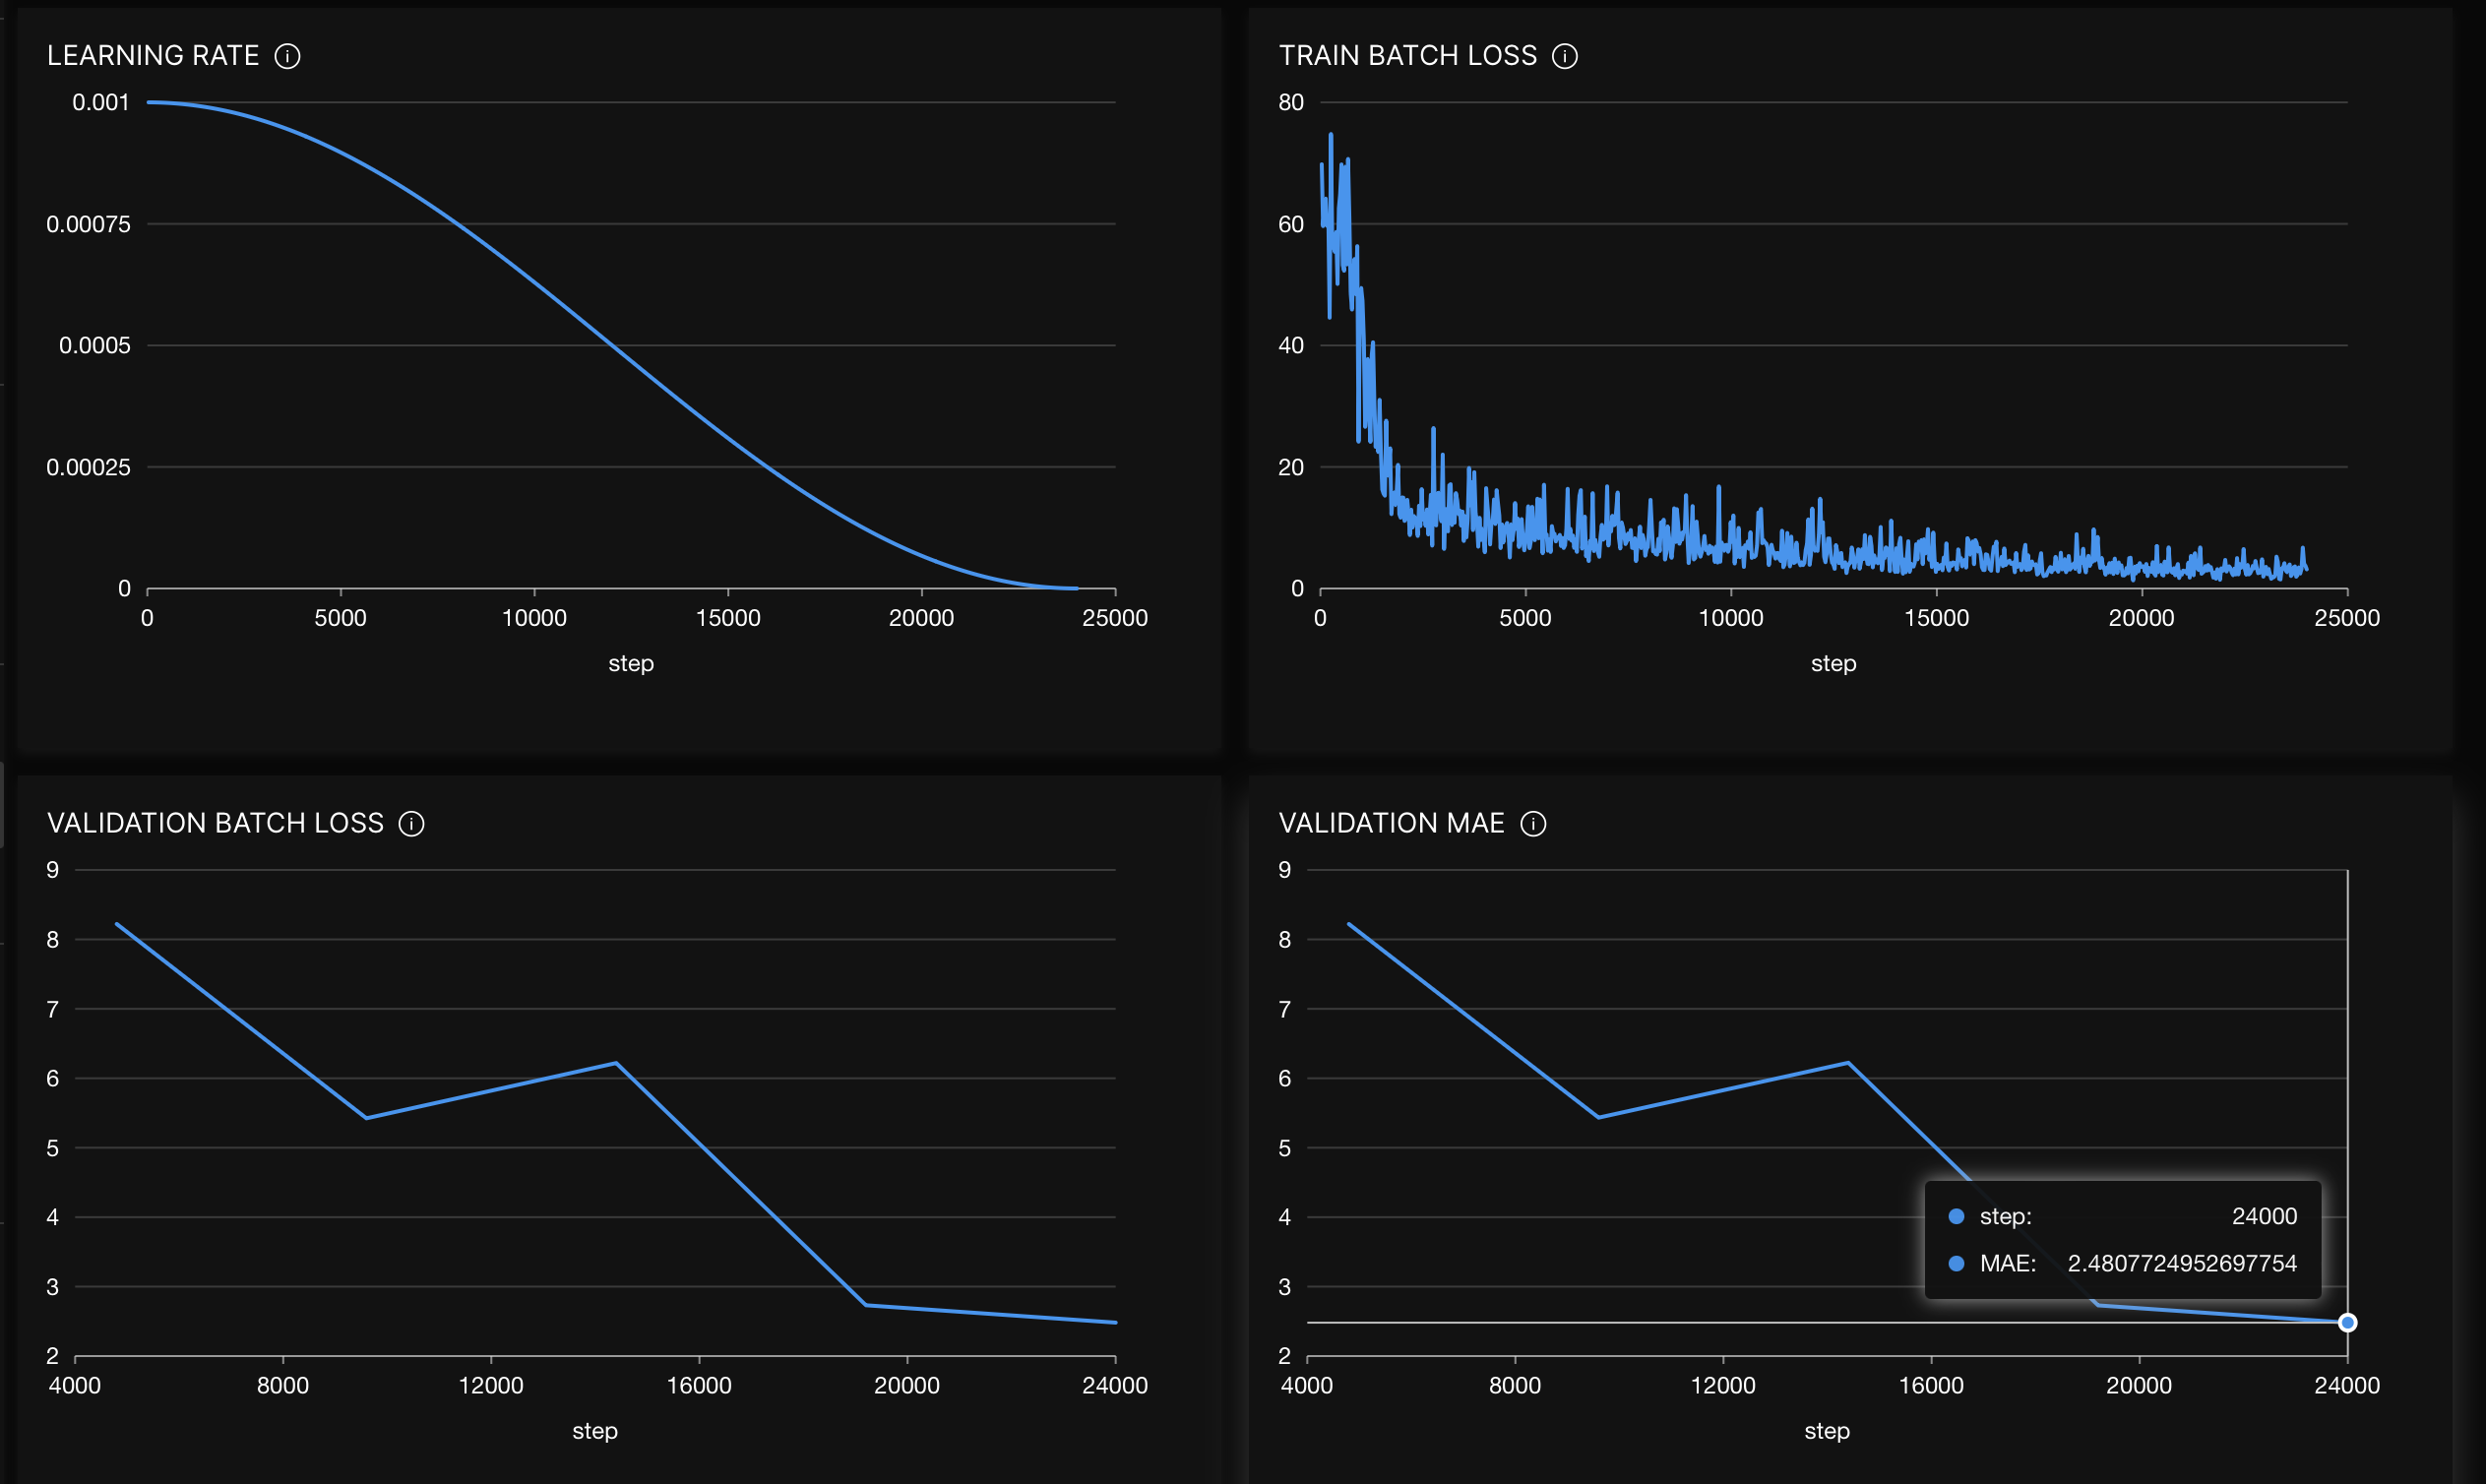
Hovering over the validation MAE chart, we see that the MAE decreased to 2.48 after the last epoch (not bad at all, a fairly accurate model). The closer the MAE value approximates to 0, the better.
Summary
This tutorial created a fairly accurate machine learning model for image regression using well-defined hyperparameter values. We also explored charts to assess hyperparameter effects on model training.
Next
You can improve the built image regression model; in particular, you can use grid search to improve the model (or any other model built in H2O Hydrogen Torch). To learn more, consider the following tutorial:
Once you have trained or improved your model, you can deploy the model into production. H2O Hydrogen Torch supports multiple ways to deploy a built model. Consider the following tutorials to learn more:
- Tutorial 1B: Model deployment in the H2O Hydrogen Torch UI
- Tutorial 2B: Model deployment with a model's H2O MLOps pipeline
- Tutorial 3B: Model deployment with a model's Python scoring pipeline
- Tutorial 4B: Model deployment to H2O MLOps through the H2O Hydrogen Torch UI
- Submit and view feedback for this page
- Send feedback about H2O Hydrogen Torch to cloud-feedback@h2o.ai