Analyze a dataset
Overview
H2O AutoInsights provides several analysis types that enable you to generate various distinct insights for a dataset.
- To learn more about the available supported analysis types, see Supported analysis types
- To learn how to import a dataset to H2O AutoInsights, see Import a dataset
H2O AutoInsights supports tabular data. Image, video, and audio data are not currently supported.
Instructions
To analyze a dataset, consider the following instructions:
- In H2O AutoInsights, click Home.
- Click Datasets.
- In the Datasets table, click the name of the dataset you want to analyze (after importing your dataset, you can locate it in the Datasets table).
note
To learn how to import a dataset to H2O AutoInsights, see Import a dataset.
- Click Analyze.
- In the Enter a name for your analysis box, enter a name for the analysis.
- Click Save.
- (Optional) Transform column(s).
note
- H2O AutoInsights lets you control the treatment of numerical (measure) and categorical (dimension) type columns. If you skip this step, the auto transformation engine (H2O AuotInsights) handles the numeric to categorical conversion
- To learn more about column transformations, see Data (column) transformations
- Click Skip/next.
- Select column(s) to analyze.
notecaution
At least one column needs to be selected.
- (Optional) In the Measures tab, select the checkbox of a column to analyze.
- (Optional) In the Dimensions tab, select the checkbox of a column to analyze.
- (Optional) In the Temporal tab, select the checkbox of a column to analyze.
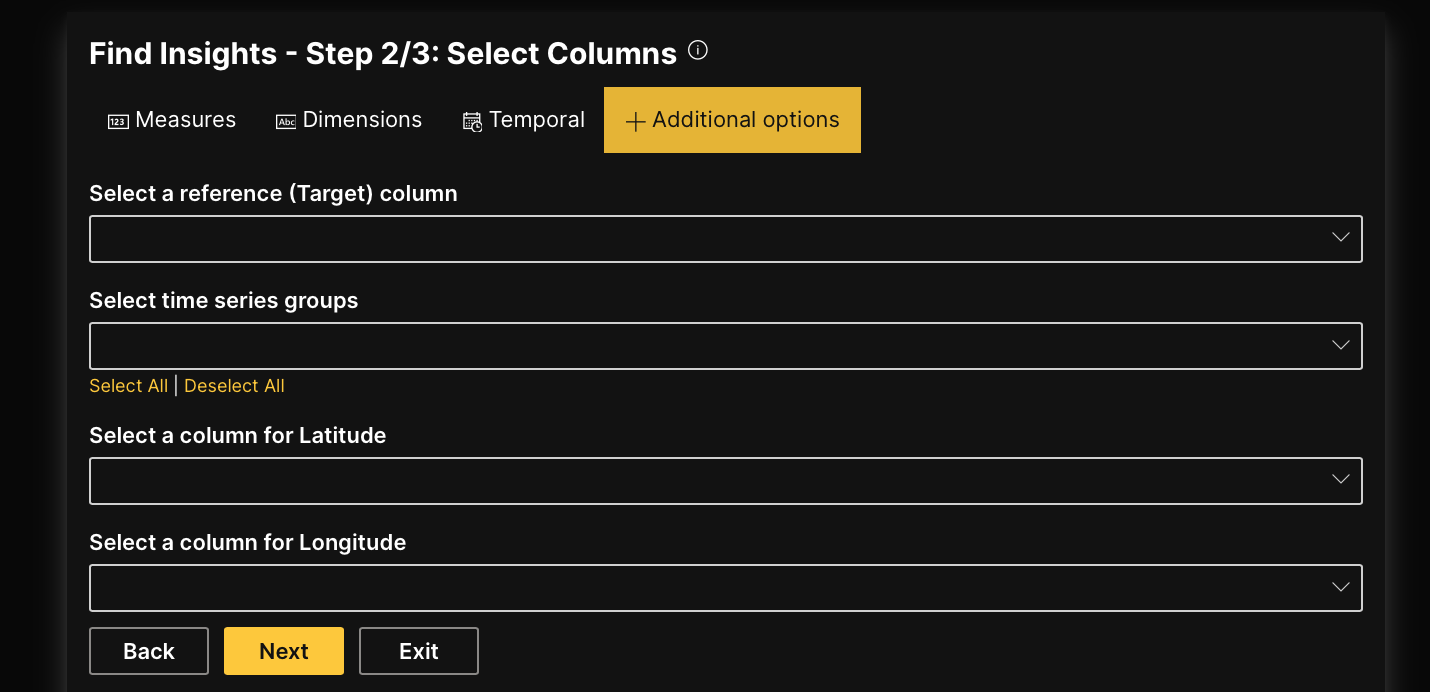
- (Optional) Click the + Additional options tab.
note
- In the + Additional options column, you can:
- Specify a reference target column to generate insights highlighting interactions between the selected reference column and other columns
- Customize columns for the following two analysis types:
- To learn more about the + Additional options tab, see + Additional options
- In the + Additional options column, you can:
- Click Next.
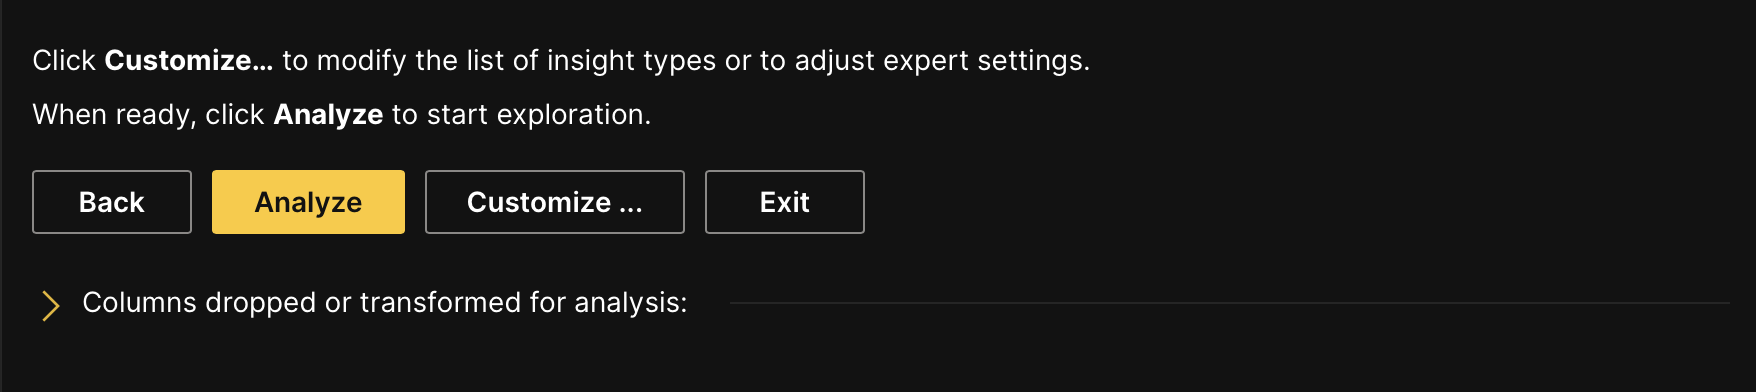
- (Optional) Click Customize....
 note
note- After selecting the column(s) in the dataset to analyze, for the most part, H2O AutoInsights offers you the ability to customize the settings of the analysis type selected for the overall analysis of the dataset
- To learn about the available analysis types, see Supported analysis types
- To learn about the available settings for a particular analysis type, see Analyses settings
- After selecting the column(s) in the dataset to analyze, for the most part, H2O AutoInsights offers you the ability to customize the settings of the analysis type selected for the overall analysis of the dataset
- Click Analyze.
Data (column) transformations
+ Additional options
Overview
When preparing the settings of a dataset analysis, H2O AutoInsights provides certain additional column settings referred to as + Additional options that enable you to:
- Specify a reference target column to generate insights that highlight interactions between the selected reference column and other columns
- Among these + Additional options, users can customize columns for the following analysis types:
To learn about each additional option, see Options.
Options
Select a reference (Target) column
Defines a reference target column to use for an overall H2O AutoInsights analysis. Selecting a reference target column generates insights highlighting interactions between the reference target column and other columns.
Select time series groups
Defines additional categories to use for a time series analysis. Selecting additional categories auto aggregates data to uncover hidden patterns across different groups.
Select a column for Latitude
Defines the latitude column to use for a geographic analysis. Selecting the latitude column allows the analysis to generate geographic insights that are rendered in interactive and visual maps.
Select a column for Longitude
Defines the longitude column to use for a geographic analysis. Selecting the longitude column allows the analysis to generate geographic insights that are rendered in interactive and visual maps.
Analyses settings
Overview
H2O AutoInsights selects certain analysis types for the overall analysis of a dataset. H2O AutoInsights will use, for the most part, default settings for a particular analysis type, and when necessary, it will customize them to extract as many possible insights. The customization comes as a result of the column data types of the selected dataset. However, users can always customize all settings of a particular analysis type right before starting a dataset analysis. H2O AutoInsights enables you to customize the default setting values for each chosen analysis type (except for sentiment analysis).
Frequency analysis
Below are all the available settings for a frequency analysis.
- Number of insights: The number of insights H2O AutoInsights generates from a frequency analysis, H2O AutoInsights sorts these insights locally by variance.
Top and bottom analysis
Below are all the available settings for a top and bottom analysis.
- Number of insights: The number of insights H2O AutoInsights generates from a top and bottom analysis. H2O AutoInsights sorts these insights locally by the coefficient of variation of the category counts.
- Maximum cardinality
Measure by measure analysis
Below are all the available settings for a measure by measure analysis.
- Number of insights: The number of insights H2O AutoInsights generates from a measure by measure analysis.
info
A pair of variables (X, Y) can contain multiple sub-insights based on the additional insights selection. The maximum number of insights set here does not account for sub-insights and only relates to unique variable pairs used in the X and Y-axis.
- Minimum cardinality for the measures
- Fit regression line
- Additional insight choices
Options
- Default
- Add dimension: Adding a dimension lets the points in the scatter plot be colored by the categories of a categorical column.
- Add measure: Adding a measure lets the points in the scatter plot be sized by another numeric variable.
- Add dimension and size by additional measure
- Remove outliers: Removing outliers helps visualize the relationship better.
- Contamination % of outliers: Specify the possible percentage of anomalies (outliers) in the dataset.
Correlation analysis
Below are all the available settings for a correlation analysis.
- Include plots
Options
- Heatmap
- Network graph
- Maximum number of columns: Select the number of columns to include in the correlation plot. When the original number of columns in the data is higher than the set value, a sub-sampling technique is applied to select the columns that best capture the data's maximum variance.
Dimension by dimension analysis
Below are all the available settings for a dimension by dimension analysis.
- Number of insights: Insights are sorted locally by matrix cardinality.
- Maximum cardinality: The maximun cardinality is the number of possible values a feature can assume. If the cardinality of a variable is higher than the maximum set, the heatmaps will be replaced with a barplot.
- Color heat map cells by
Options
- Aggregation of a numeric variable
- Count across categories
- Aggregation method: The metric selected here is used to aggregate numeric data; this is represented by the intensity of a cell in the heatmap.
Options
- Average
- Sum
- Minimum
- Maximum
- Additional insights using calendar heatmaps: Calendar heatmaps visualize data across time components like the day of the week, month, hour, etc.
- Plot type
Options
- Heatmap
- Stacked bars
- 100% stacked bars
- Grouped bars
Measure by dimension analysis
Below are all the available settings for a measure by dimension analysis.
- Number of insights
- Maximum cardinality
- Aggregation method: The metric selected for this method aggregates the numeric data within each category and is visualized only in the bar plot.
Options
- Average
- Sum
- Minimum
- Maximum
Clustering analysis
Below are all the available settings for a clustering analysis.
- Auto cluster
- Maximum number of clusters
- Explanation fidelity: Controls explanation, faithfulness, and complexity. Ideally, one would like 100% faithfulness, but sometimes this affects the readability of the explanation in the current setting.
Anomaly detection multivariable analysis
Below are all the available settings for a anomaly detection multivariable analysis.
- Imputation method for missing values
Options
- Default: The default method uses mean to replace missing values for numerical and to transformed categorical columns.
- Model-based imputation: Model-based imputation uses iterative predictive models to replace missing values.
- Estimated percentage of outliers (contamination): The estimated percentage influences the maximum number of points classified as anomalies (outliers).
- Explanation fidelity: Explanation fidelity controls explanation, faithfulness, and complexity. Ideally, one would like 100% faithfulness, but sometimes this affects the readability of the explanation in the current setting.
Time series analysis
Below are all the available settings for a time series analysis.
- Number of insights
- Maximum cardinality: The maximun cardinality is the number of possible values a feature can assume. The time Series analysis skips a column if the cardinality is higher than the selected value.
- Include categoricals: Categoricals that are not marked as time series identifiers are included in the time series analysis.
- Include counts as measure: H2O AutoInsights treats counts of the categories of a categorical variable at every date unit as a measure.
- Aggregation method: The selected method aggregates the numeric columns at a date unit level.
Options
- Average
- Sum
- Minimum
- Maximum
- Date aggregation level: H2O AutoInsights utilizes the selected data unit-level to aggregate the data.
Options
- Auto
- Daily
- Weekly
- Monthly
- Quarterly
- Yearly
Keywords or phrases analysis
Below are all the available settings for a keywords or phrases analysis.
- Number of top N-grams
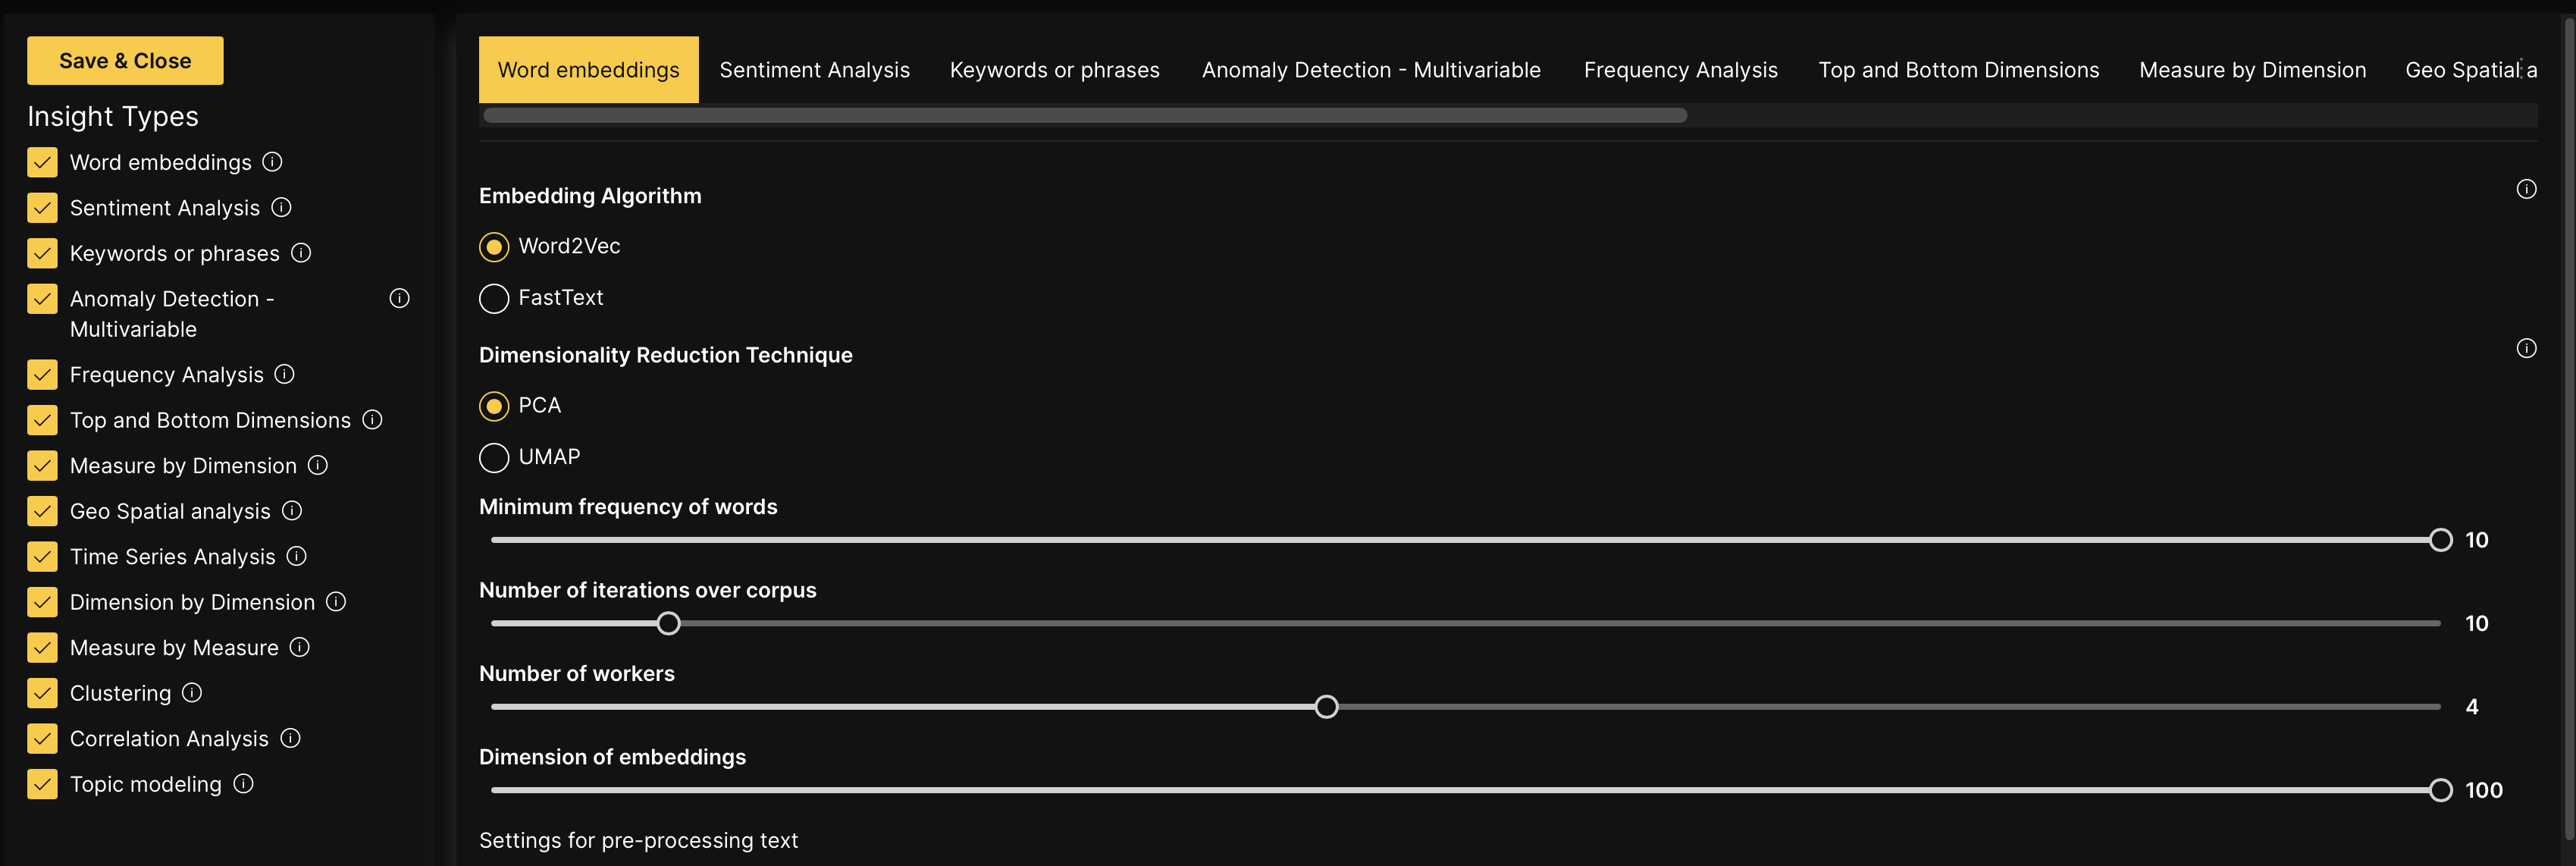
Word embeddings analysis
Below are all the available settings for a word embeddings analysis.
- Embedding algorithm: Either Word2Vec or FastText (an extension of word2vec) can be selected to learn word representation. While Word2Vec treats words as the smallest entity during training, FastText considers each word composed of character N-grams. So, the word vector is composed of the sum of the character N-grams.
options
- Word2Vec
- FastText
- Dimensionality reduction technique: Dimensionality reduction techniques are applied to the word embeddings for visualization.
Options
- PCA (Principal Component Analysis)
- UMAP (Uniform Manifold Approximation and Projection)
- Minimum frequency of words
- Number of iterations over corpus
- Number of workers
- Dimension of embeddings
- Fix unicode
- Remove URL
- Remove email
- Remove phone numbers
- Remove numerals
- Remove currency
- Remove punctuation
- Remove accents
Sentiment analysis
There are no customizable settings for a sentiment analysis.
Topic modeling analysis
Below are all the available settings for a topic modeling analysis.
- Number of topics
- Alpha: The higher the alpha value, the more equal the number of documents are across the topics. Setting a lower value indicates very few topics dominate the dataset.
- Eta: The lower the Eta, the fewer words the topics contain.
- Tokens occurred in at least N documents: The selected value keeps words that are contained in at least N documents.
- Tokens occurred in more than N percentage of documents: The selected value (N) keeps words that are contained in no more than N documents (fraction of total corpus size, not an absolute number).
- First N most frequent tokens: The selected value (N) keeps only the first N most frequent tokens.
Geographic analysis (that is, geo spacial analysis)
Below are all the available settings for a geographic analysis.
- Number of insights: Insights are sorted locally by statistical metric - coefficient of variation.
- Aggregation method: Data is aggregated at geographic levels; the selected method aggregates the numeric columns.
Options
- Average
- Sum
- Minimum
- Maximum
- For a geographic analysis to be activated, your dataset needs to have two columns named latitude and longitude. If your dataset specifies the latitude and longitude columns with different names, you can specify the appropriate columns on the + Additional options tab (when preparing the settings for a dataset analysis).
- The following geographic dimensions are supported:
- City (only for New York City)
- U.S. States (at the state level)
- Countries (at the country level)
- Submit and view feedback for this page
- Send feedback about H2O AutoInsights to cloud-feedback@h2o.ai