Access a preloaded dataset
Overview
H2O AutoInsights comes with preloaded datasets. Users can use the preloaded datasets to understand different types of supported analysis types. The capabilities of a particular analysis type are best highlighted when the appropriate dataset is used (for example, a geographic analysis is best highlighted with the data found in the following dataset: nyc_taxi_duration_demo).
Instructions
To access one of the preloaded datasets in H2O AutoInsights:
- In H2O AutoInsights, click Menu.
- In the H2O AutoInsights navigation menu, click Datasets.
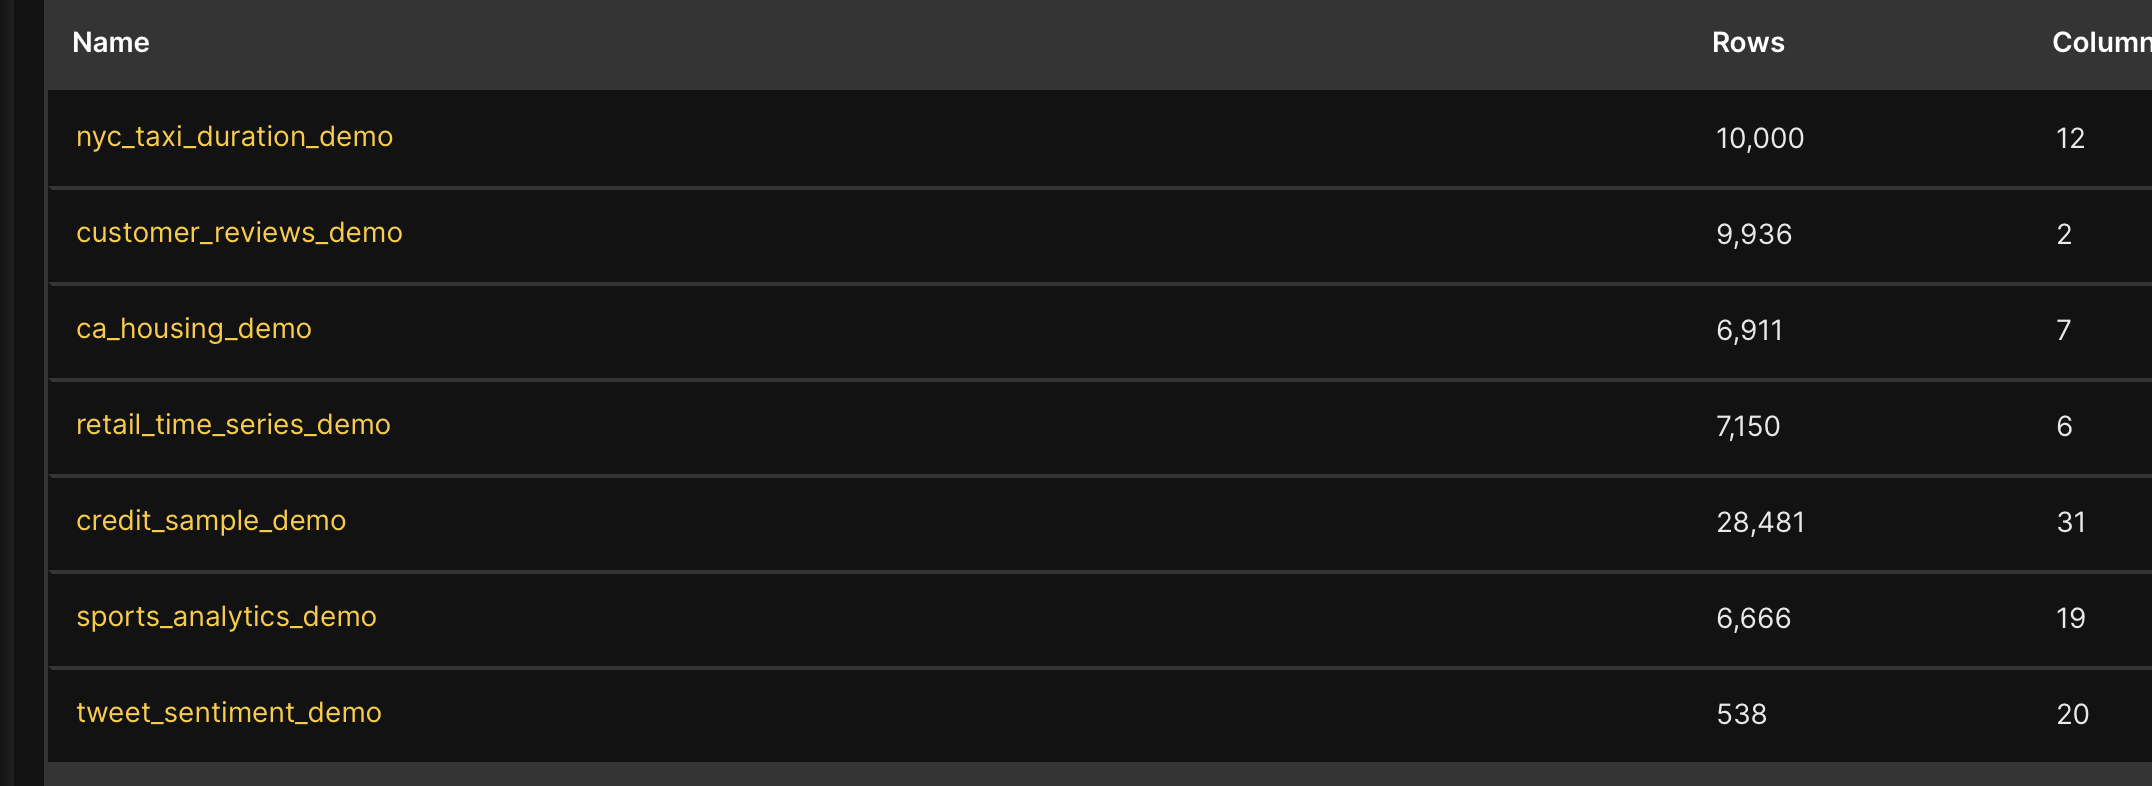
- In the Datasets table, click the name of one of the preloaded datasets.
 note
noteTo learn about the available preloaded dataset, see Preloaded datasets.
Preloaded datasets
CA housing demo
- Name: ca_housing_demo
- Description: The dataset contains a few summary stats about houses in a California district based on the 1990 census data. To learn more about the dataset, refer to the following Kaggle page: California Housing Prices
- Dataset columns:
longitude,latitude,age,total_rooms,bedrooms,value,ocean_proximity - Best for:
- Correlation analysis
- Measure by measure analysis
- Measure by dimension analysis
- Clustering analysis
- Dimension by dimension analysis
- Anomaly detection - multivariable analysis
- Top and bottom analysis
- Dimensions analysis
- Frequency analysis
Credit sample demo
- Name: Credit Sample Demo
- Description: The dataset contains information about transactions made by credit cards in September 2013 by European cardholders. Note, the dataset includes 284,807 transactions where 492 are labeled as fraud. To learn more about the dataset, refer to the following Kaggle page: Credit Card Fraud Detection
- Dataset columns:
Time,V1...V28,Amount,Fraud - Best for:
- Correlation nalysis
- Measure by measure nalysis
- Measure by dimension nalysis
- Clustering analysis
- Anomaly detection - multivariable analysis
- Top and bottom dimensions analysis
- Frequency analysis
Customer reviews demo
- Name: customer_reviews_demo
- Description: The dataset contains Amazon reviews and numeric ratings for the latest headphones (as of mid-2019). To learn more about the dataset, refer to the following Kaggle page: Amazon Earphones Reviews
- Dataset columns:
review,rating - Best for:
- Topic modeling analysis
- Word embeddings analysis
- Keywords or phrases analysis
- Clustering analysis
- Sentiment analysis
- Top and bottom dimensions analysis
NYC taxi duration demo
- Name: nyc_taxi_duration_demo
- Description: The dataset contains individual taxi trip attributes such as pickup and dropoff time. In general, the dataset includes information on individual trips made in New York City. To learn more about the dataset, refer to the following Kaggle page: New York City Taxi Trip Duration
- Dataset columns:
id,vendor_id,pickup_datetime,dropoff_datetime,passenger_count,pickup_longitude,pickup_latitude,dropoff_longitude,dropoff_latitude,store_and_fwd_flag,trip_duration,distance_euclidean - Best for:
- Correlation analysis
- Measure by measure analysis
- Anomaly detection - multivariable analysis
- Measure by dimension analysis
- Clustering analysis
- Dimension by dimension analysis
- Geographic analysis
- Time series analysis
- Top and bottom dimensions analysis
- Frequency analysis
Retail time series demo
- Name: retail_time_series_demo
- Description: The dataset contains information about daily sales made by a retail store; in particular, the dataset includes the local gas price and day temperature the retail store made a sale
- Dataset columns:
TSI_ST,TSI_DPT,Date,Sales,Temperature,GasPrice - Best for:
- Correlation analysis
- Measure by measure analysis
- Measure by dimension analysis
- Clustering analysis
- Dimension by dimension analysis
- Time series analysis
- Anomaly detection - multivariable analysis
- Top and bottom dimensions analysis
- Frequency analysis
Sports analytics demo
- Name: sports_analytics_demo
- Description: The dataset contains several detailed attributes about punt plays made in American football games. To learn more about the dataset, refer to the following Kaggle page: Detailed NFL Play-by-Play Data 2009-2018
- Dataset columns:
game_id,play_id,quarter,game_clock,team_kicking,team_receiving,score_kicking,score_receiving,yard_number,dist_togoal,gunner_count,olineman_count,protector_count,punter_count,dlineman_count,linebacker_count,dback_count,jammer_count,returner_count - Best for:
- Correlation analysis
- Measure by measure analysis
- Measure by dimension analysis
- Clustering analysis
- Dimension by dimension analysis
- Anomaly detection - multivariable analysis
- Top and bottom analysis
- Dimensions analysis
- Frequency analysis
Tweet sentiment demo
- Name: tweet_sentiment_demo
- Description: The dataset contains attributes about tweets referring to US airlines along with ground truth on tweet sentiment. For example, it contains whether the sentiment of the tweets in this dataset was positive, neutral, or negative. To learn more about the dataset, refer to the following Kaggle page: Twitter US Airline Sentiment
- Dataset columns:
_unit_id,_golden,_unit_state,_trusted_judgments,_last_judgment_at,airline_sentiment,airline_sentiment:confidence,negativereason,negativereason:confidence,airline,airline_sentiment_gold,name,negativereason_gold,retweet_count,text,tweet_coord,tweet_created,tweet_id,tweet_location,user_timezone - Best for:
- Correlation analysis
- Measure by measure analysis
- Topic modeling analysis
- Word embeddings analysis
- Measure by dimension analysis
- Keywords or phrases analysis
- Clustering analysis
- Dimension by dimension analysis
- Sentiment analysis
- Anomaly detection - multivariable analysis
- Top and bottom dimensions analysis
- Frequency analysis
Feedback
- Submit and view feedback for this page
- Send feedback about H2O AutoInsights to cloud-feedback@h2o.ai