Supported analysis types
Overview
H2O AutoInsights provides several analysis types that generate various distinct insights. This page describes each of the available analysis types.
To learn how one of the supported analysis types can be utilized to analyze a dataset, see Analysis flow or Tutorial 1: Introduction to H2O AutoInsights.
Analyses
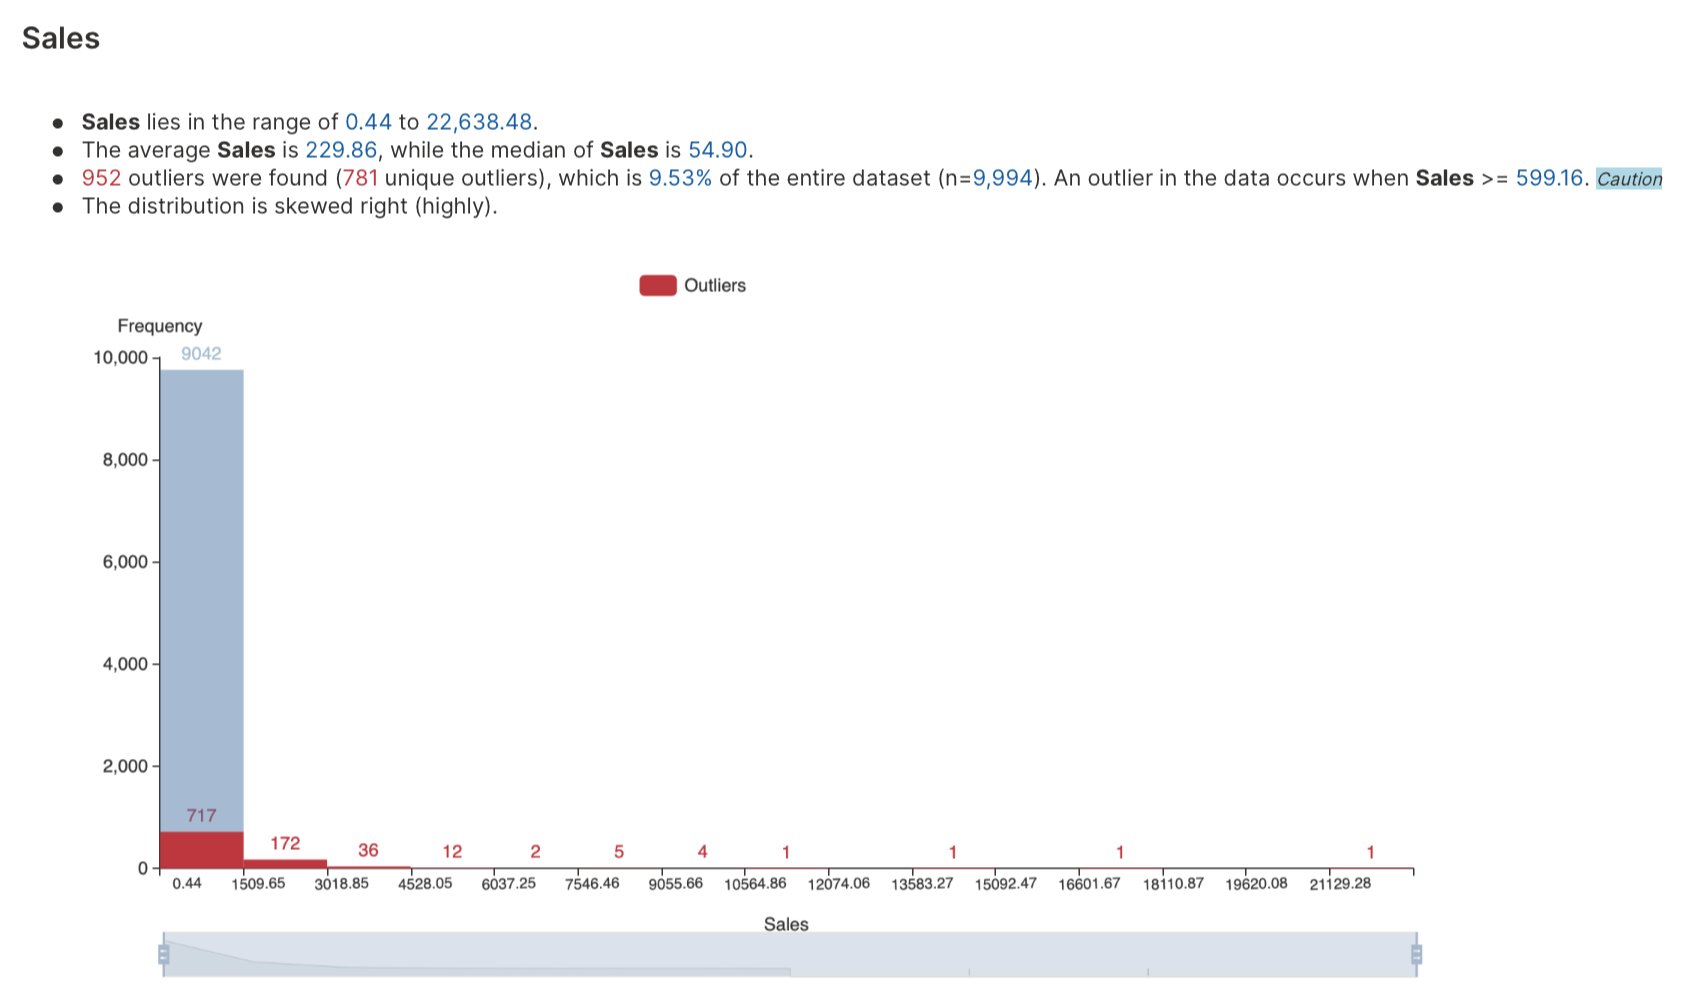
Frequency analysis
Frequency analysis is a statistical technique used to identify the frequency of occurrence of different items in a dataset. By analyzing the frequency distribution, you can determine which categories or numerical variables occur most frequently and which occur least frequently. (Categories or numerical variables that occur the least frequently are referred to as outliers.) You can then use this information to make informed decisions, identify opportunities for improvement, or develop strategies for addressing problems.
To learn about the available settings for this analysis type, see Analyses settings: Frequency analysis.
Common use cases
The following is a list of common use cases for frequency analysis.
- Marketing: Analyze customer data, such as purchase histories, to identify the products that are most frequently purchased and develop marketing strategies to promote those products.
- Healthcare: Analyze patient data, such as medical histories, to identify the most common health conditions and develop treatment plans.
- Finance: Analyze financial data, such as sales revenues or expenses, to identify trends and patterns and develop strategies for improving financial performance.
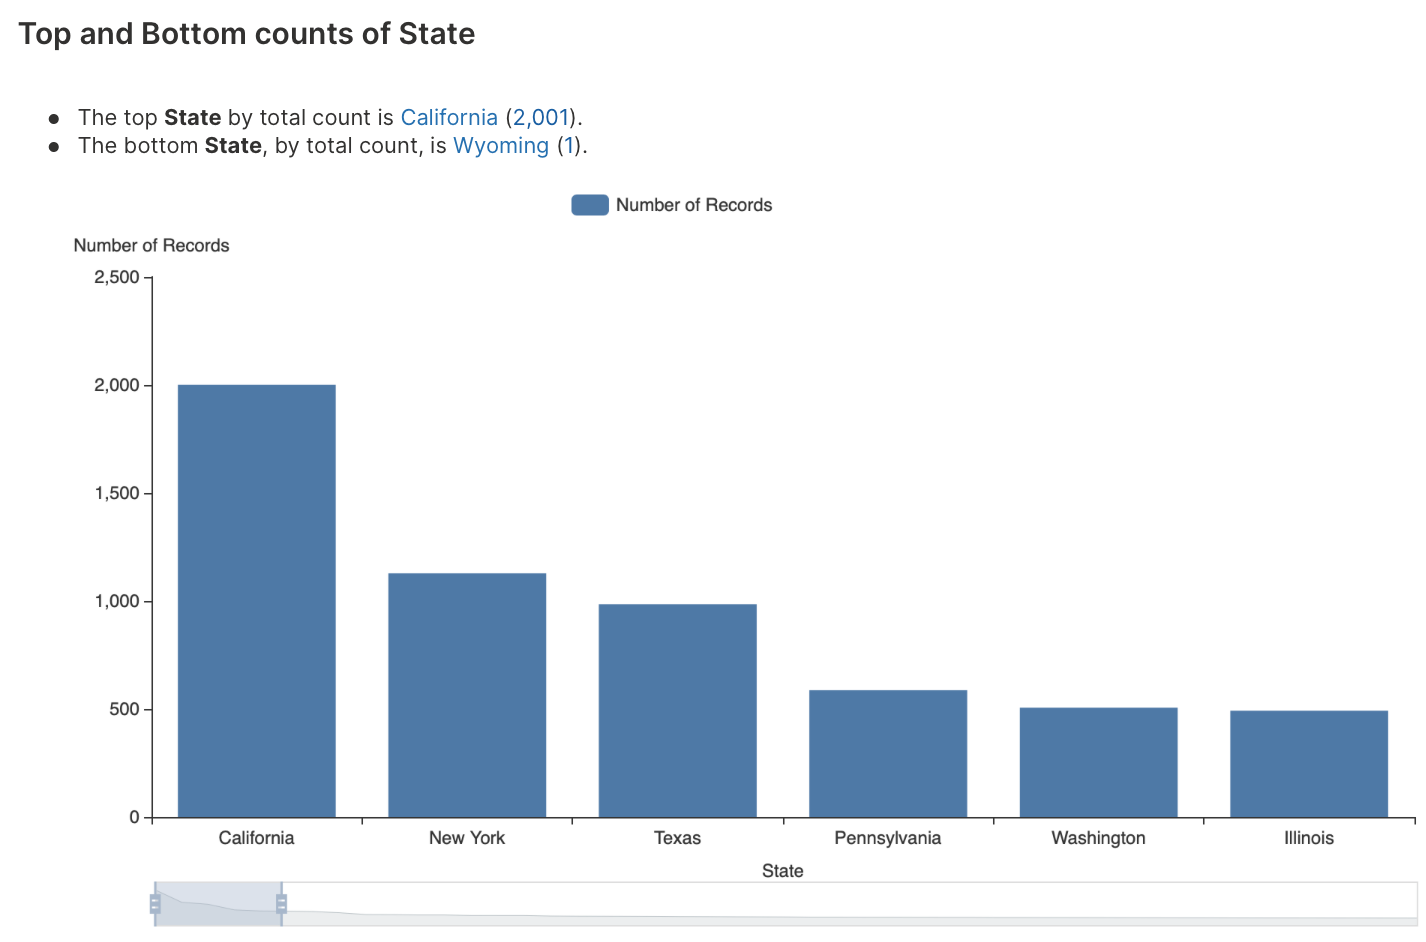
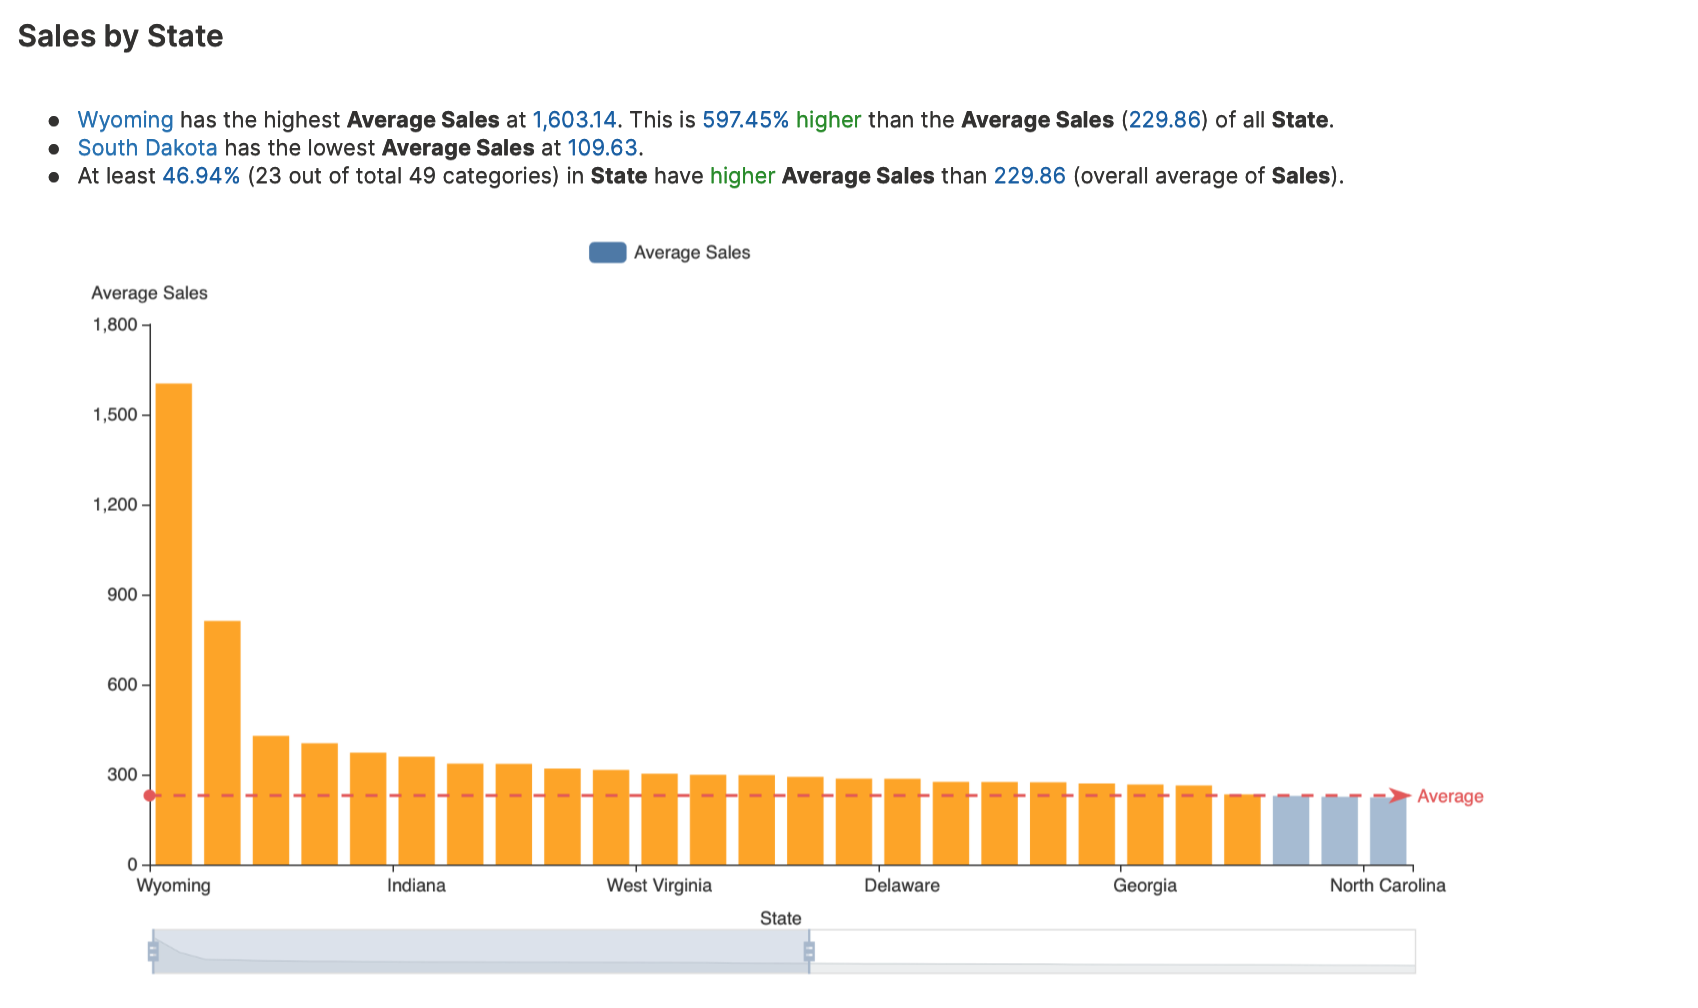
Top and bottom analysis
Top and bottom analysis uncovers patterns by analyzing the overall dataset.
To learn about the available settings for this analysis type, see Analyses settings: Top and bottom analysis.
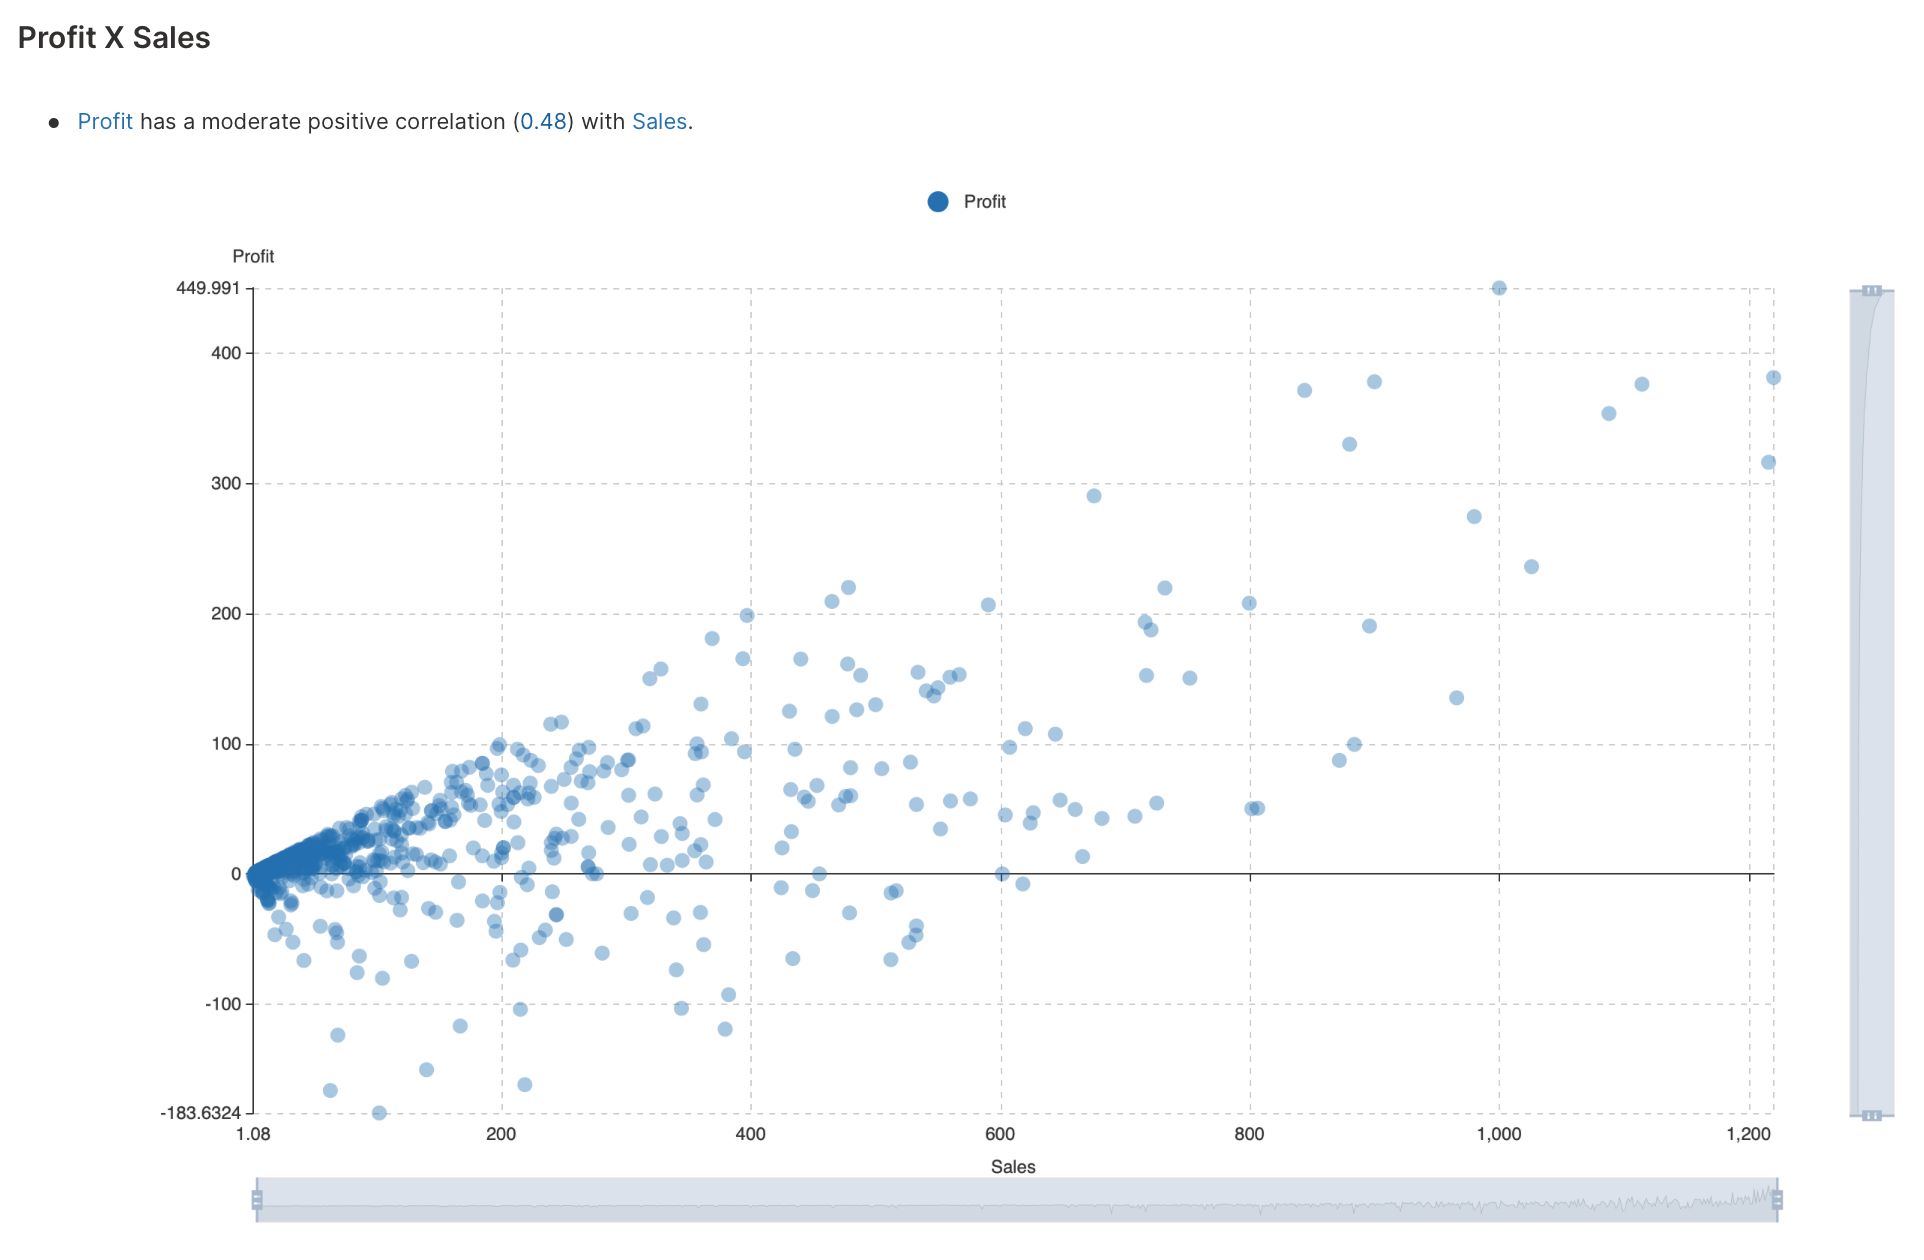
Measure by measure analysis
Measure by measure analysis explores the relationship between continuous variables.
To learn about the available settings for this analysis type, see Analyses settings: Measure by measure analysis.
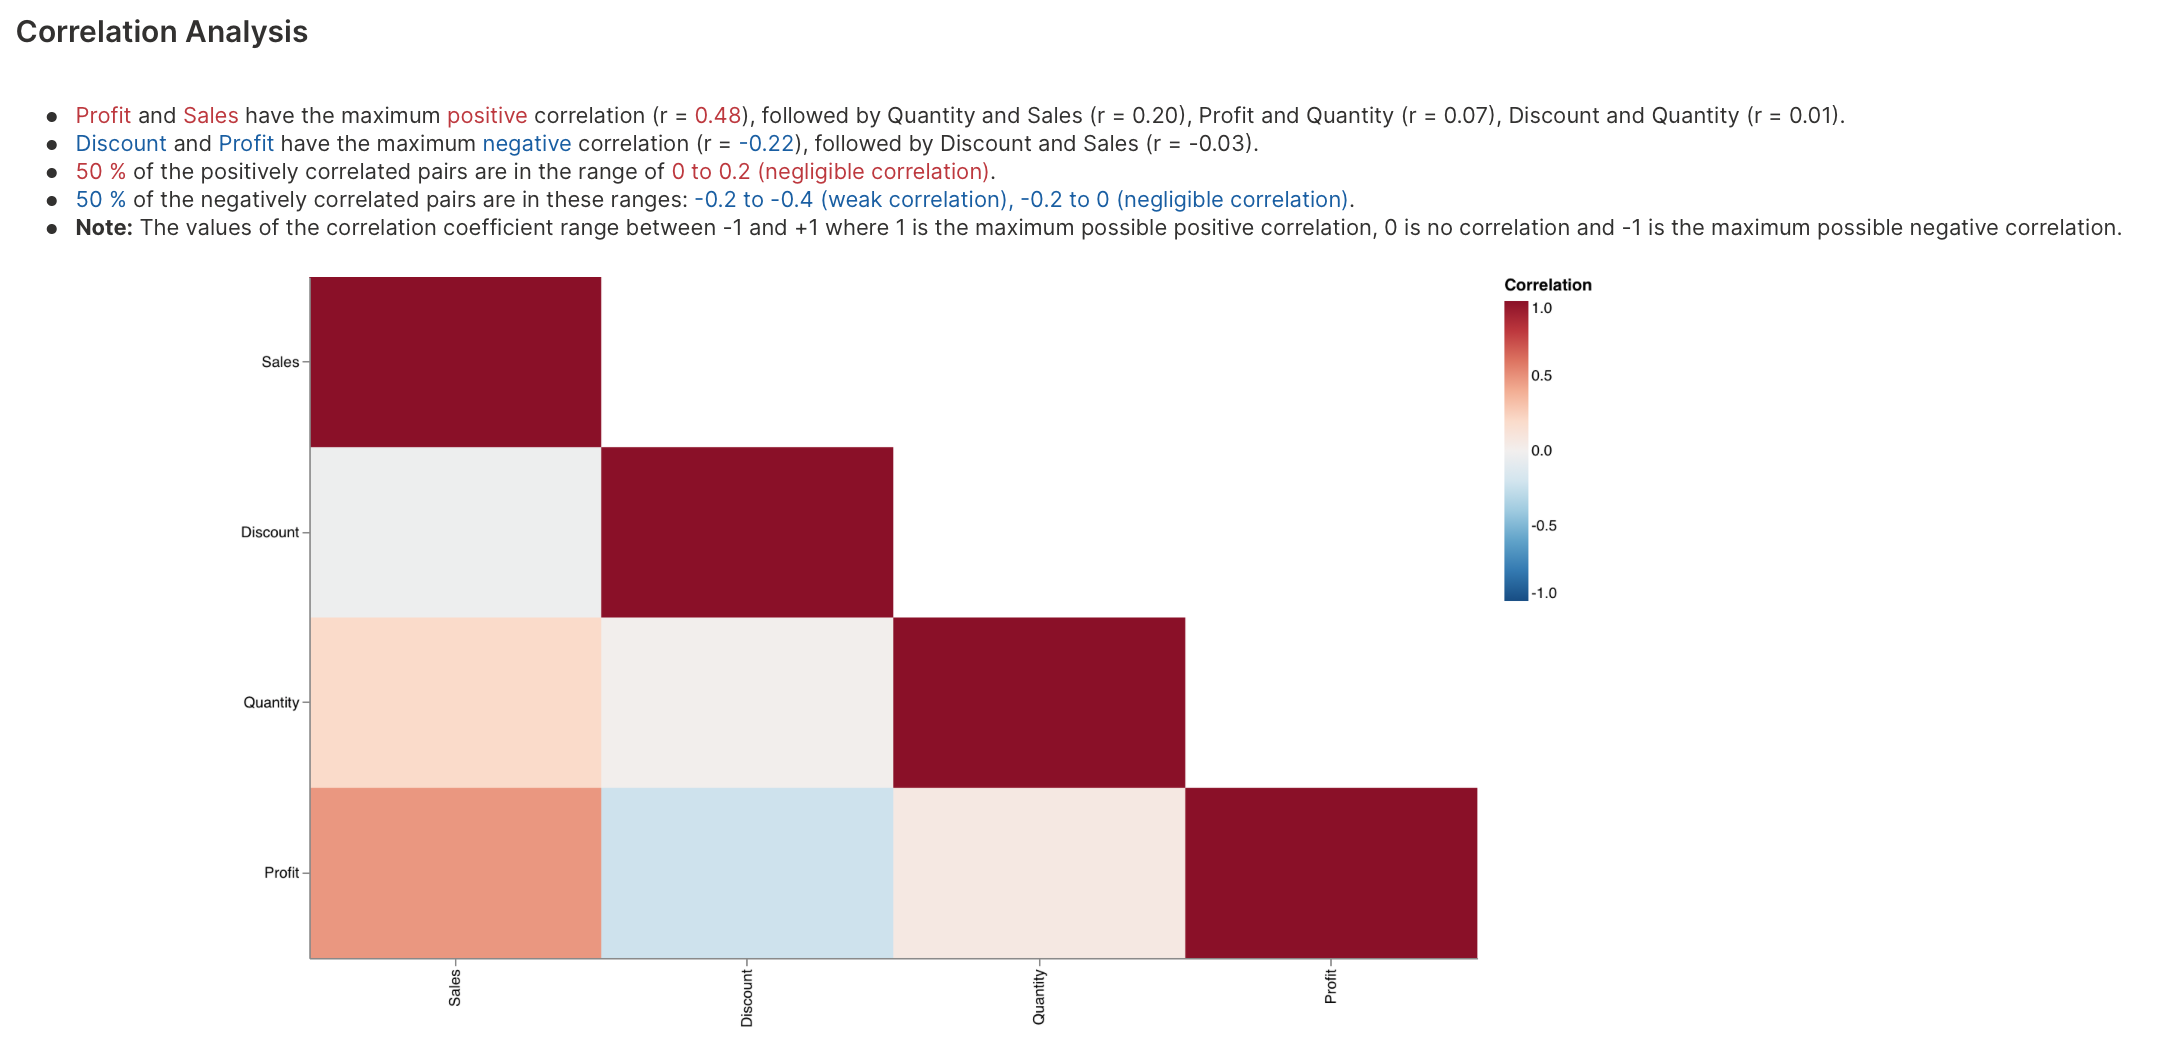
Correlation analysis
Correlation analysis explores the strength of the linear relationship between pairs of variables.
To learn about the available settings for this analysis type, see Analyses settings: Correlation analysis.
Dimension by dimension analysis
Dimension by dimension analysis explores the relationship between categorical variables.
H2O Autoinsights offers a TreeMap analysis of categorical variables in relation to a numerical aggregated variable, where the user can drill-down over all categorical variables on the dataset.
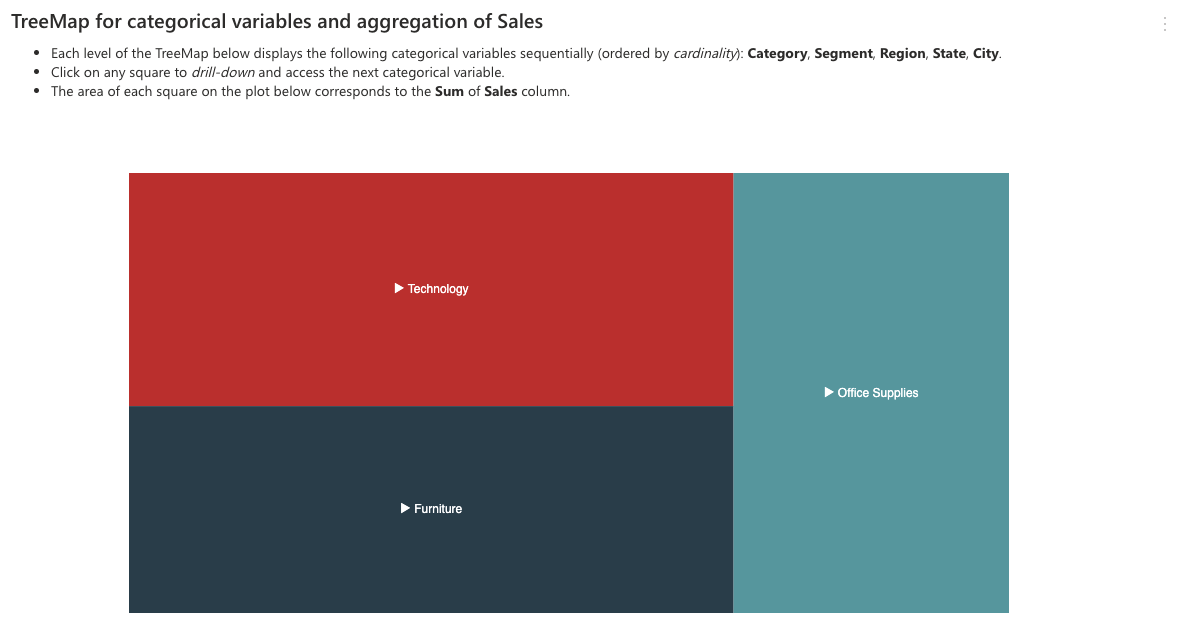
To learn about the available settings for this analysis type, see Analyses settings: Dimension by dimension analysis.
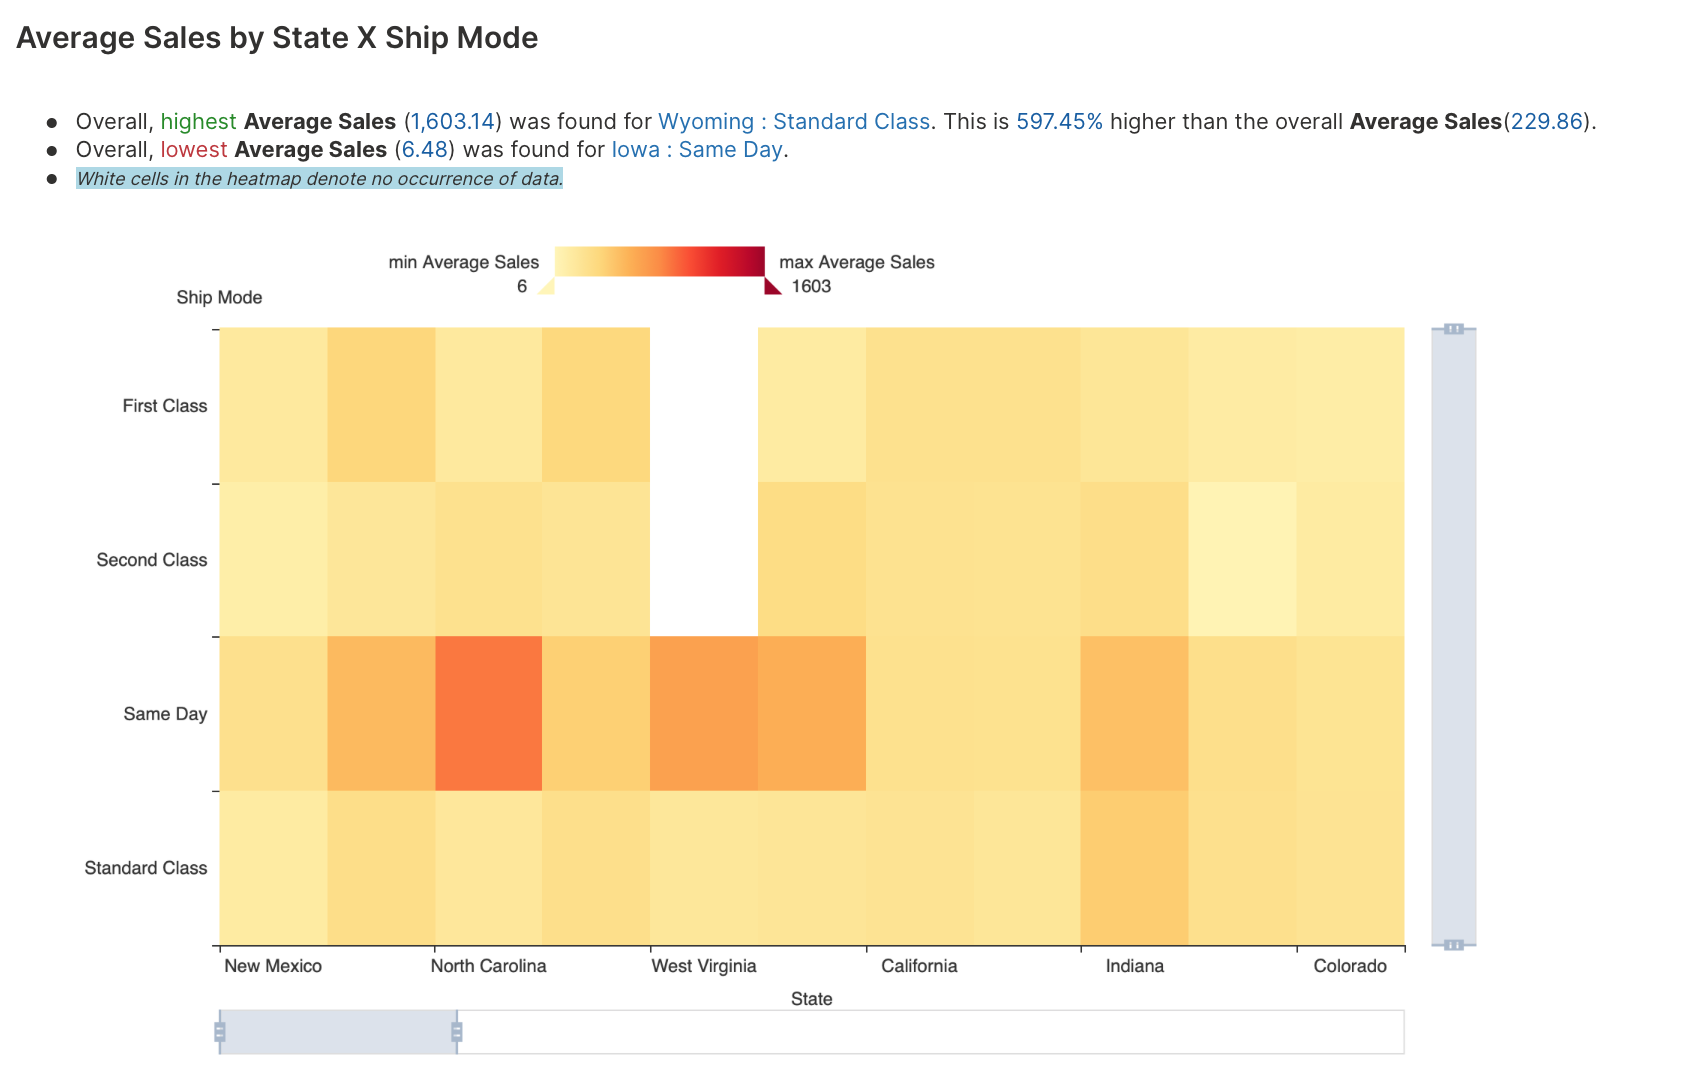
Measure by dimension analysis
Measure by dimension analysis explores the relationship between continuous and categorical variables.
To learn about the available settings for this analysis type, see Analyses settings: Measure by dimension analysis.
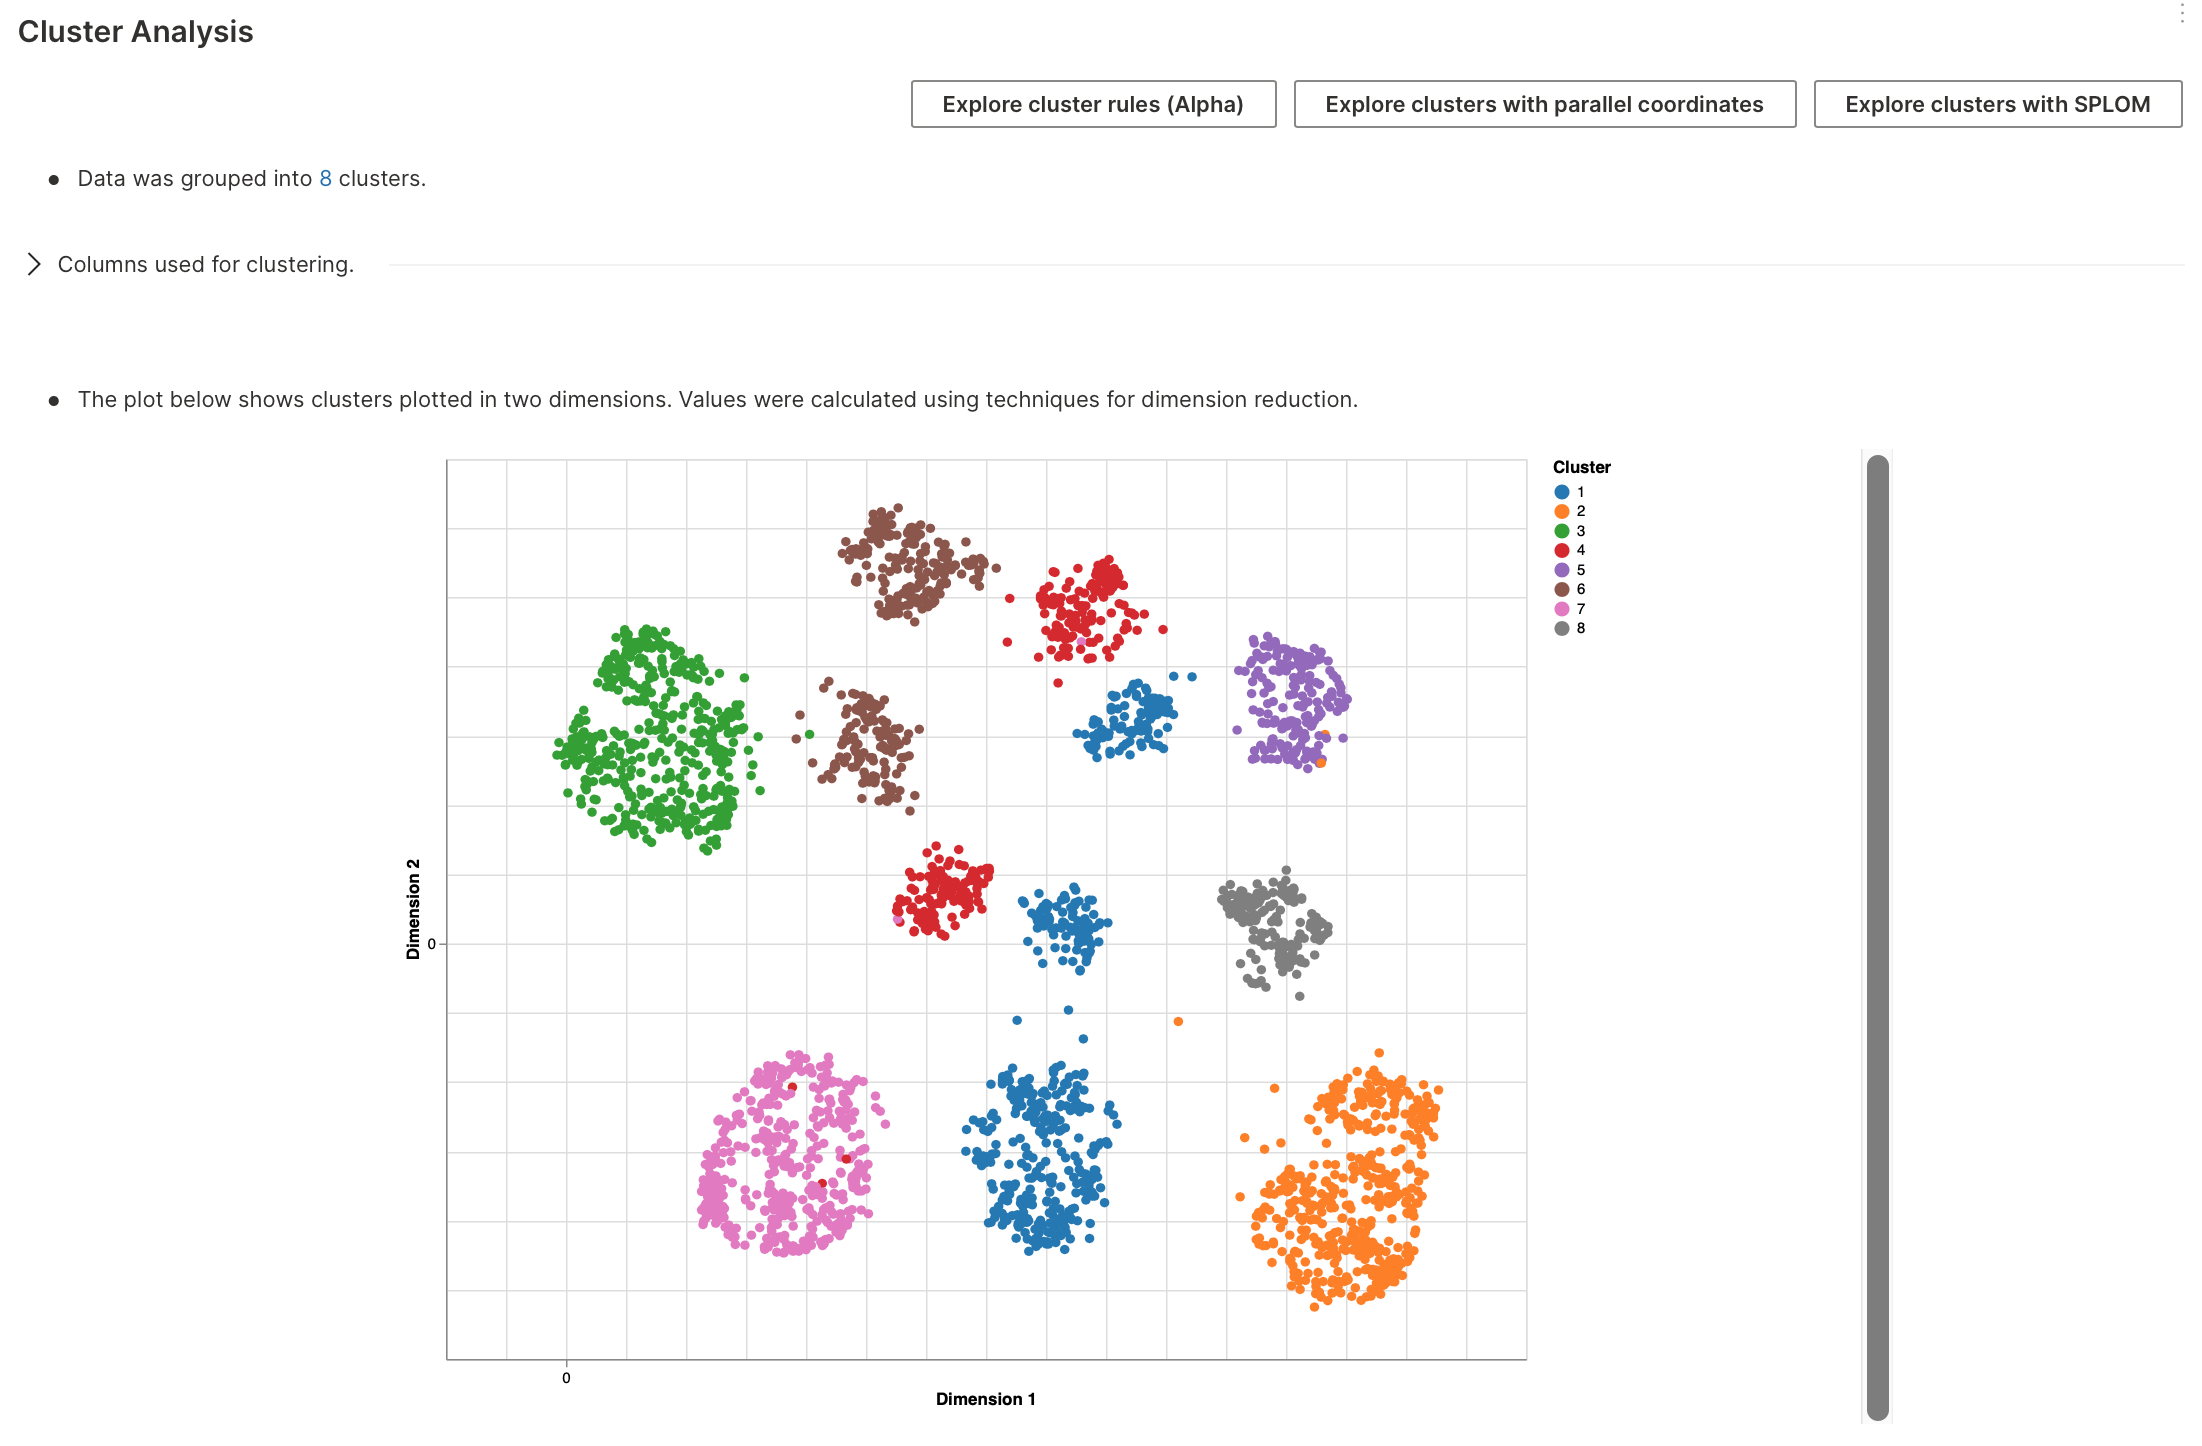
Clustering analysis
Cluster analysis refers to the process of separating data into distinct clusters (groups).
To learn about the available settings for this analysis type, see Analyses settings: Clustering analysis.
Data preprocessing
Before a cluster analysis, H2O AutoInsights enforces the following preprocessing data actions:
- Target column: If the user has specified a target column, this target column is not passed to the clustering algorithm
- Categorical columns
- A categorical column is skipped from clustering if it has more than 200 distinct categories or if it has only one distinct category
- Categorical columns are encoded using Hash Encoding or One-Hot Encoding depending on the number of columns in the dataset. H2O AutoInsights uses a one-hot encoding if there are fewer than 50 columns
- Numerical columns: A numerical column is skipped from clustering if it has more than 40% of its values missing
- Date column: If there is a date column in the dataset, H2O AutoInsights engineers features like Year, Month, and Day from the date column
- Over 3 million records: If the dataset contains more than 3 million records, H2O AutoInsights conducts row sampling using a datable row aggregator model to take a representative sample of 2 million records
- Special characters: Special characters are removed from the dataset (
$!"#&%'()*+,-./:;<=>?[\]^_~{|}) - Missing data: Missing data are imputed using the imputation technique you specify; by default, the categorical columns are imputed with a missing string
__UNK__and numerical columns with the mean - Dataset dimensionality: H2O AutoInsights checks the dimensionality of a dataset after encoding and dimension reduction techniques are applied to the dataset if there are more than 20 columns. H2O AutoInsights utilizes the Uniform Manifold Approximation and Projection (UMAP) dimension reduction technique if the dataset does not contain over 1 million records. If the dataset is over 1 million records, H2O AutoInsights will use an incremental principal component analysis (IPCA). H2O AutoInsights uses UMAP and IPCA to remove co-related redundant variables and keep variables with high variance for clustering
- Min-max scaling: Data is normalized using min-max scaling
Clustering algorithm
- k-means clustering: H2O AutoInsights uses a k-means clustering algorithm to perform clustering on the dataset during a clustering analysis
- Number of clusters
- You can specify the number of clusters to form. H2O AutoInsights automatically selects an ideal number if a number is not specified
- Suppose the number of clusters to form is not specified. In that case, H2O AutoInsights will run a grid search procedure on several k-mean algorithms with a specific cluster number ranging from 2 to 10 that will be applied to a sample of ten thousand rows of data. H2O AutoInsights evaluates the grid search algorithms (models) using Calinski Harabaz score to select the ideal number of clusters. Right after, a K-means algorithm with the selected number of clusters is fitted on the entire data to produce the cluster labels
Clustering results
- Cluster distribution: A frequency in the distribution of the clusters provides an intuition of the different clusters' sizes in the data
- Surrogate model: To understand the clusters in detail as to what makes certain records in a dataset be clustered together, H2O AutoInsights creates a surrogate model, extracts the decision paths of the surrogate model, and then visualizes it using a decision tree. This decision tree holds the features in its nodes and feature values in its vertices, leading to clusters in its leaves. Thus, following the tree from root to leaf via different paths lets you understand how the data are getting grouped
- Parallel coordinates plot: H2O AutoInsights generates a parallel coordinates plot to illustrate how clusters span across different categories and values of the features
- Scatterplot matrix: You can explore clusters concerning the features via a scatterplot matrix, known acronymically as SPLOM - which shows the pair-wise relationships of features among the clusters
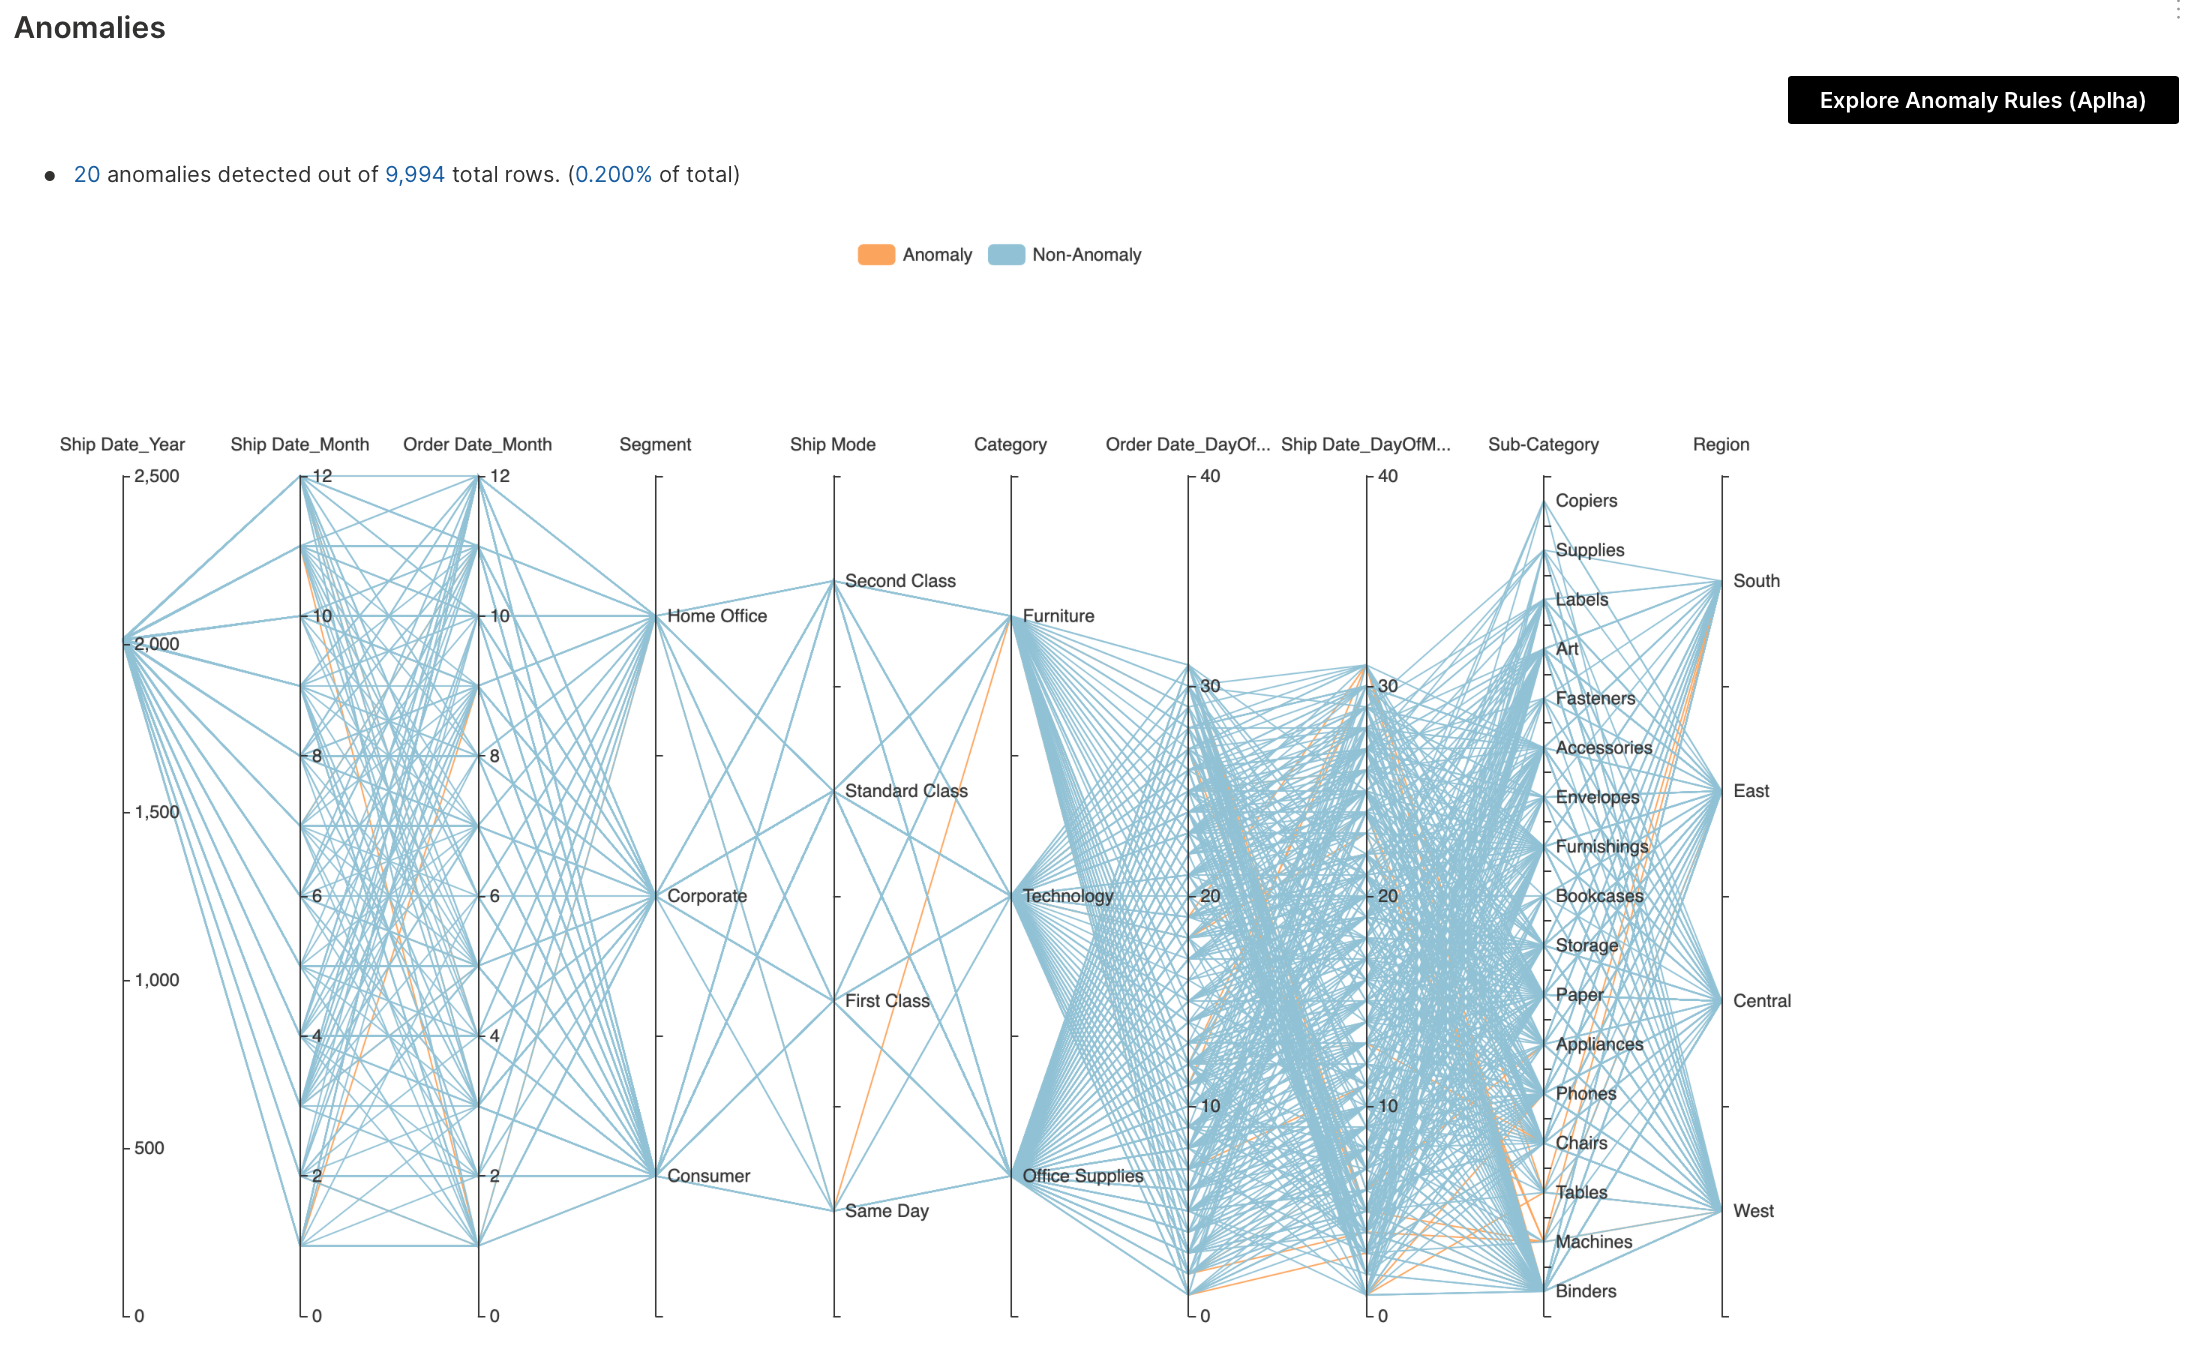
Anomaly detection multivariable analysis
Anomaly detection multivariable analysis identifies unexpected items or events in datasets, which differ from the norm. In multivariable anomaly detection, an anomaly (outlier) is a combined unusual score on at least two variables.
To learn about the available settings for this analysis type, see Analyses settings: Anomaly detection multivariable analysis.
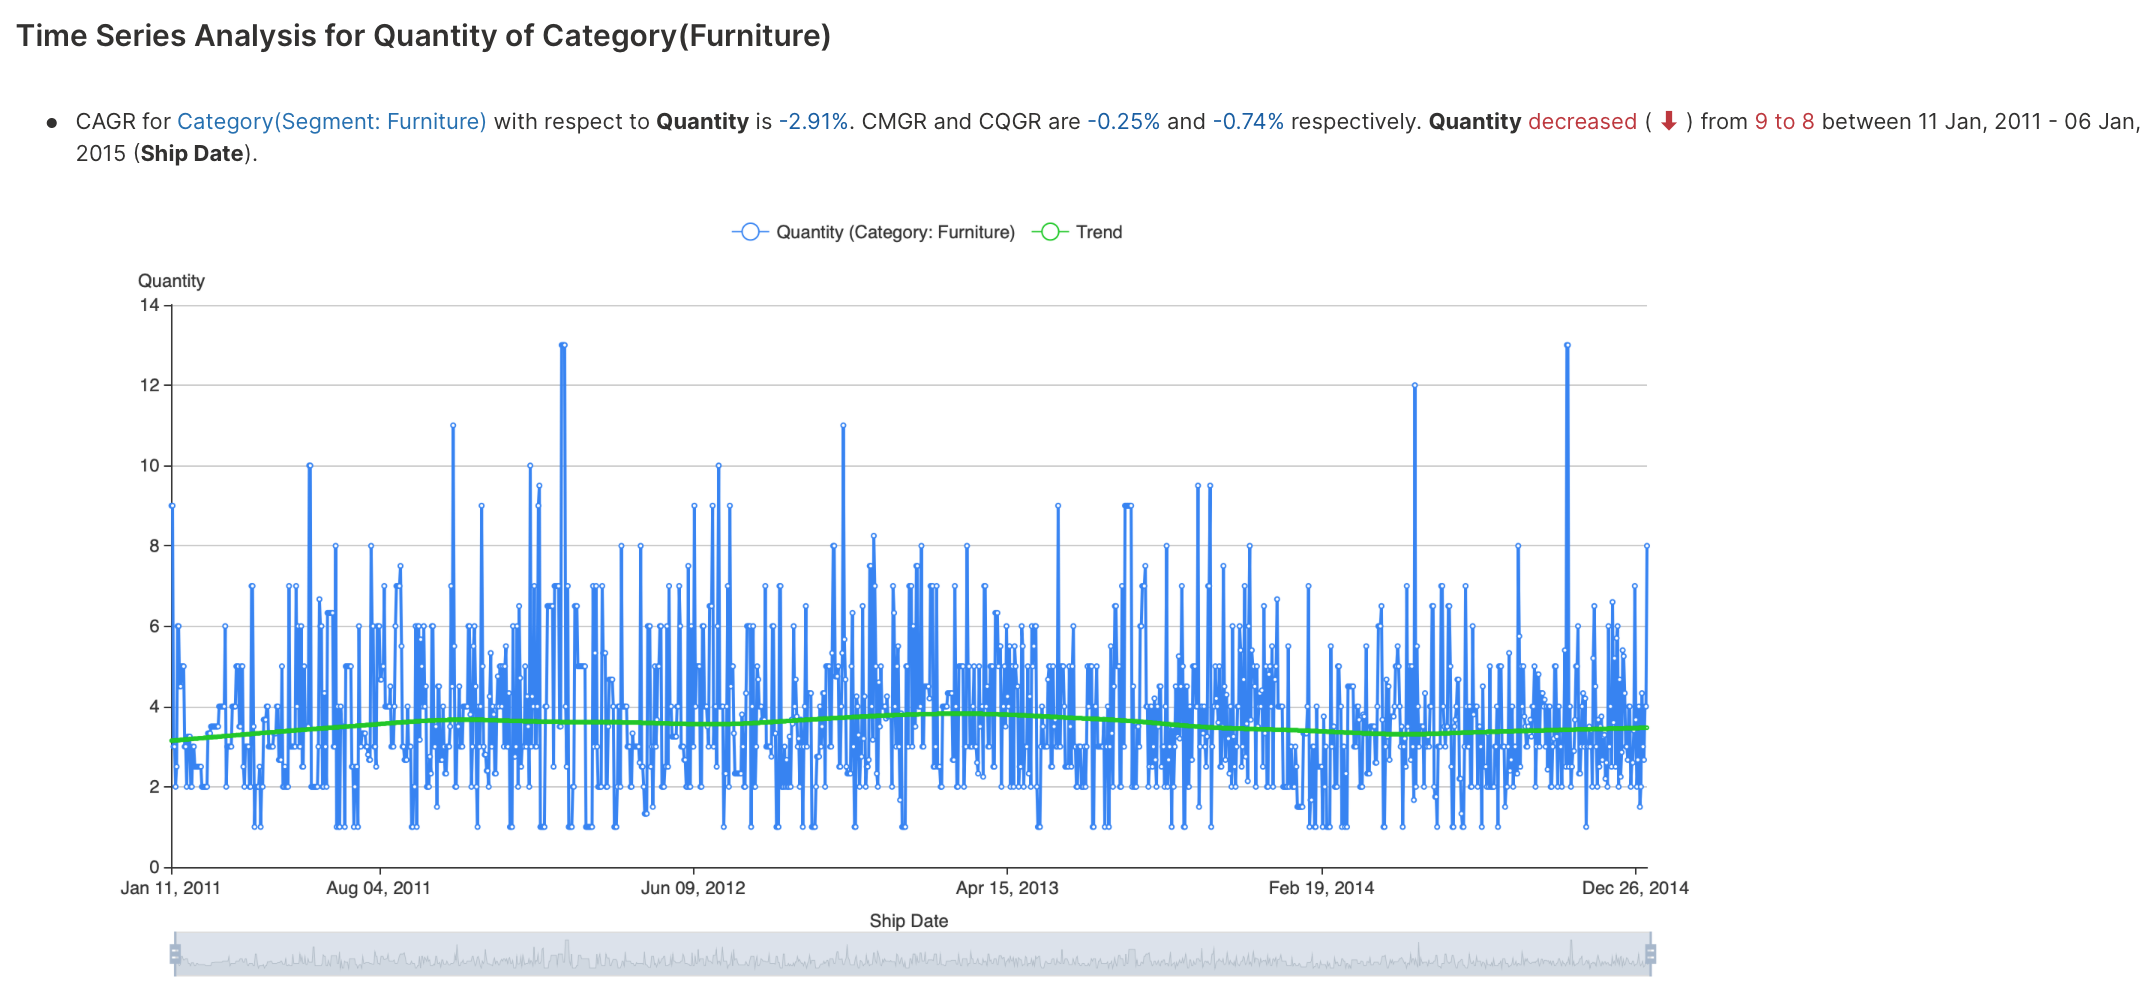
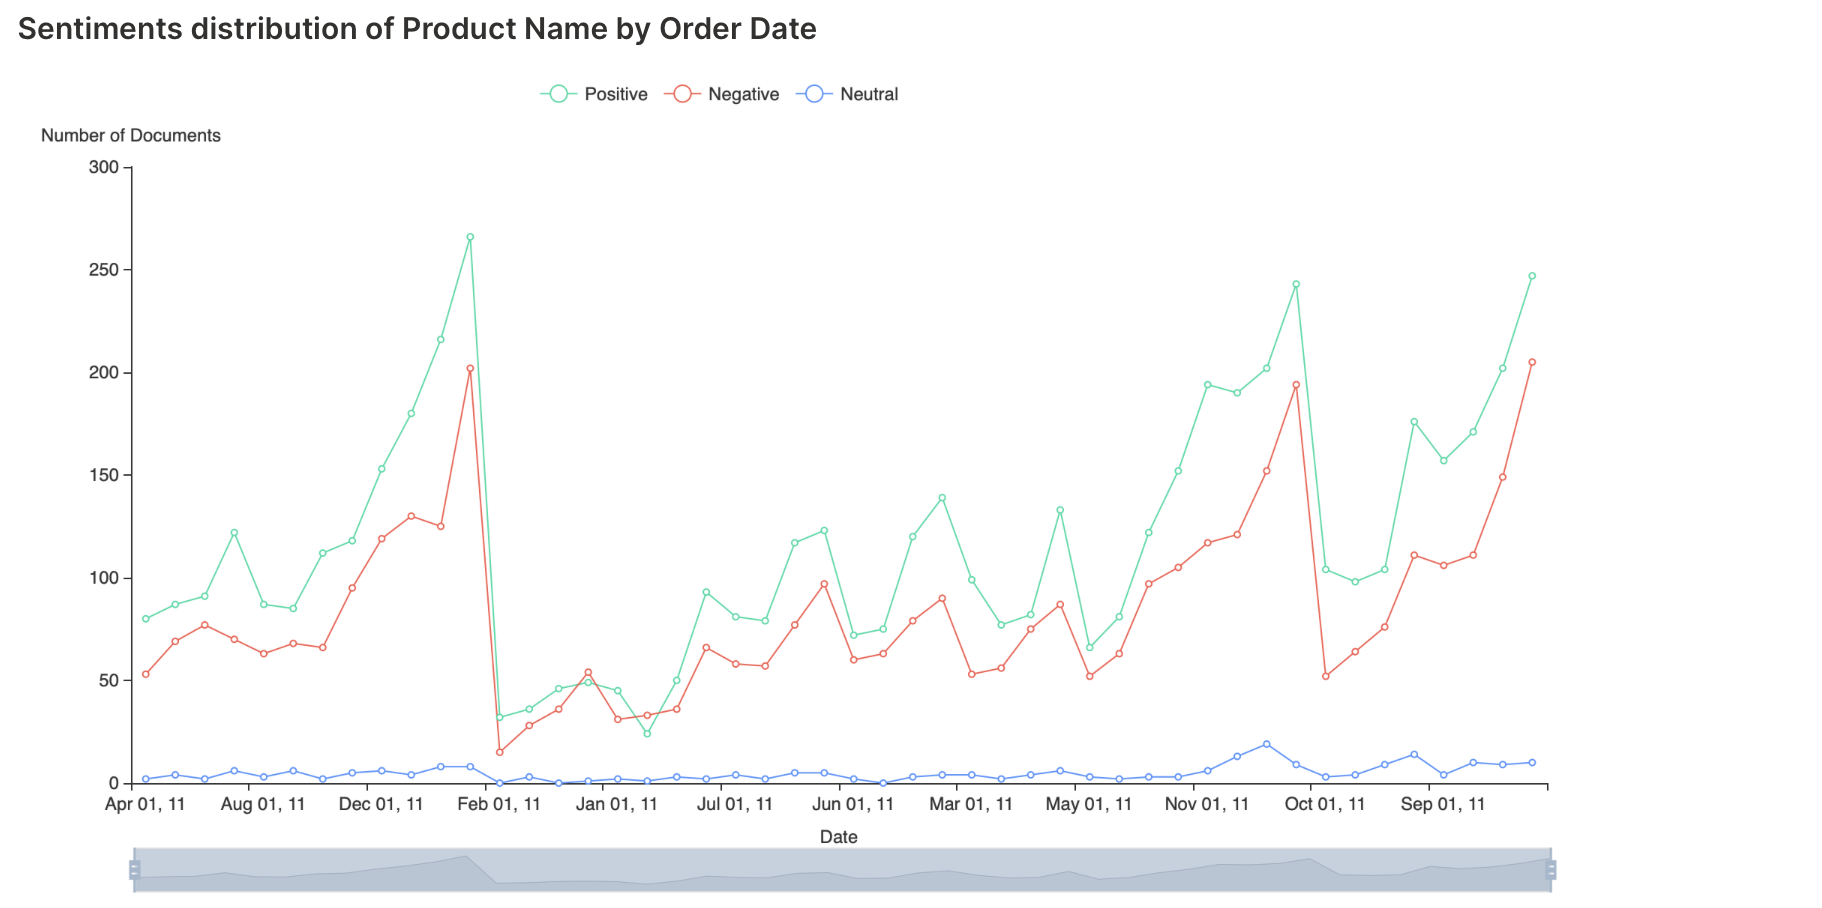
Time series analysis
Time series analysis explores categorical or numeric observations indexed by date or timestamp to identify anomalies (outliers), seasonality, trends, and forecast.
To learn about the available settings for this analysis type, see Analyses settings: Time series analysis.
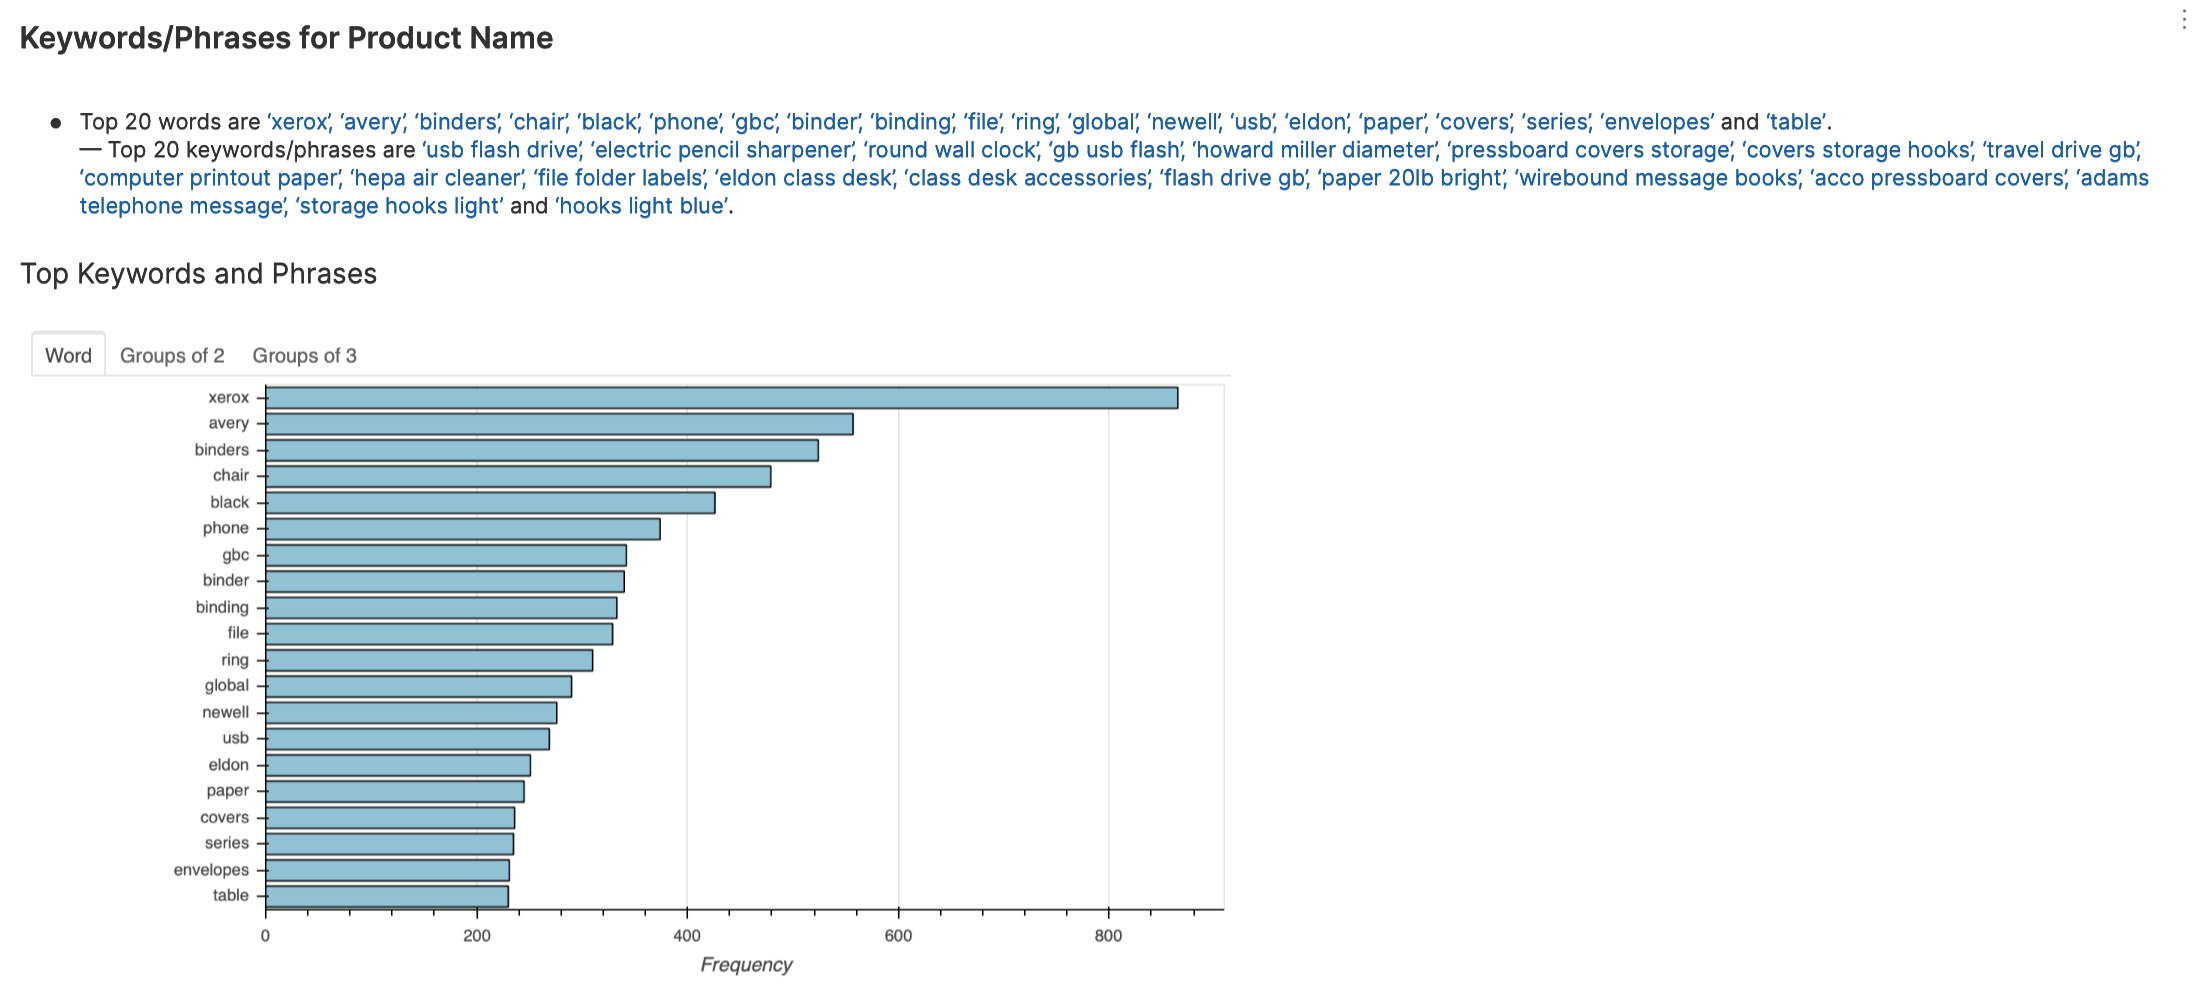
Keywords or phrases analysis
Keywords or phrases analysis explores and extracts the most used or relevant words and phrases from text. This type of analysis helps identify dominating topics (e.g., what do my customers mention most often?)
To learn about the available settings for this analysis type, see Analyses settings: Keywords or phrases analysis.
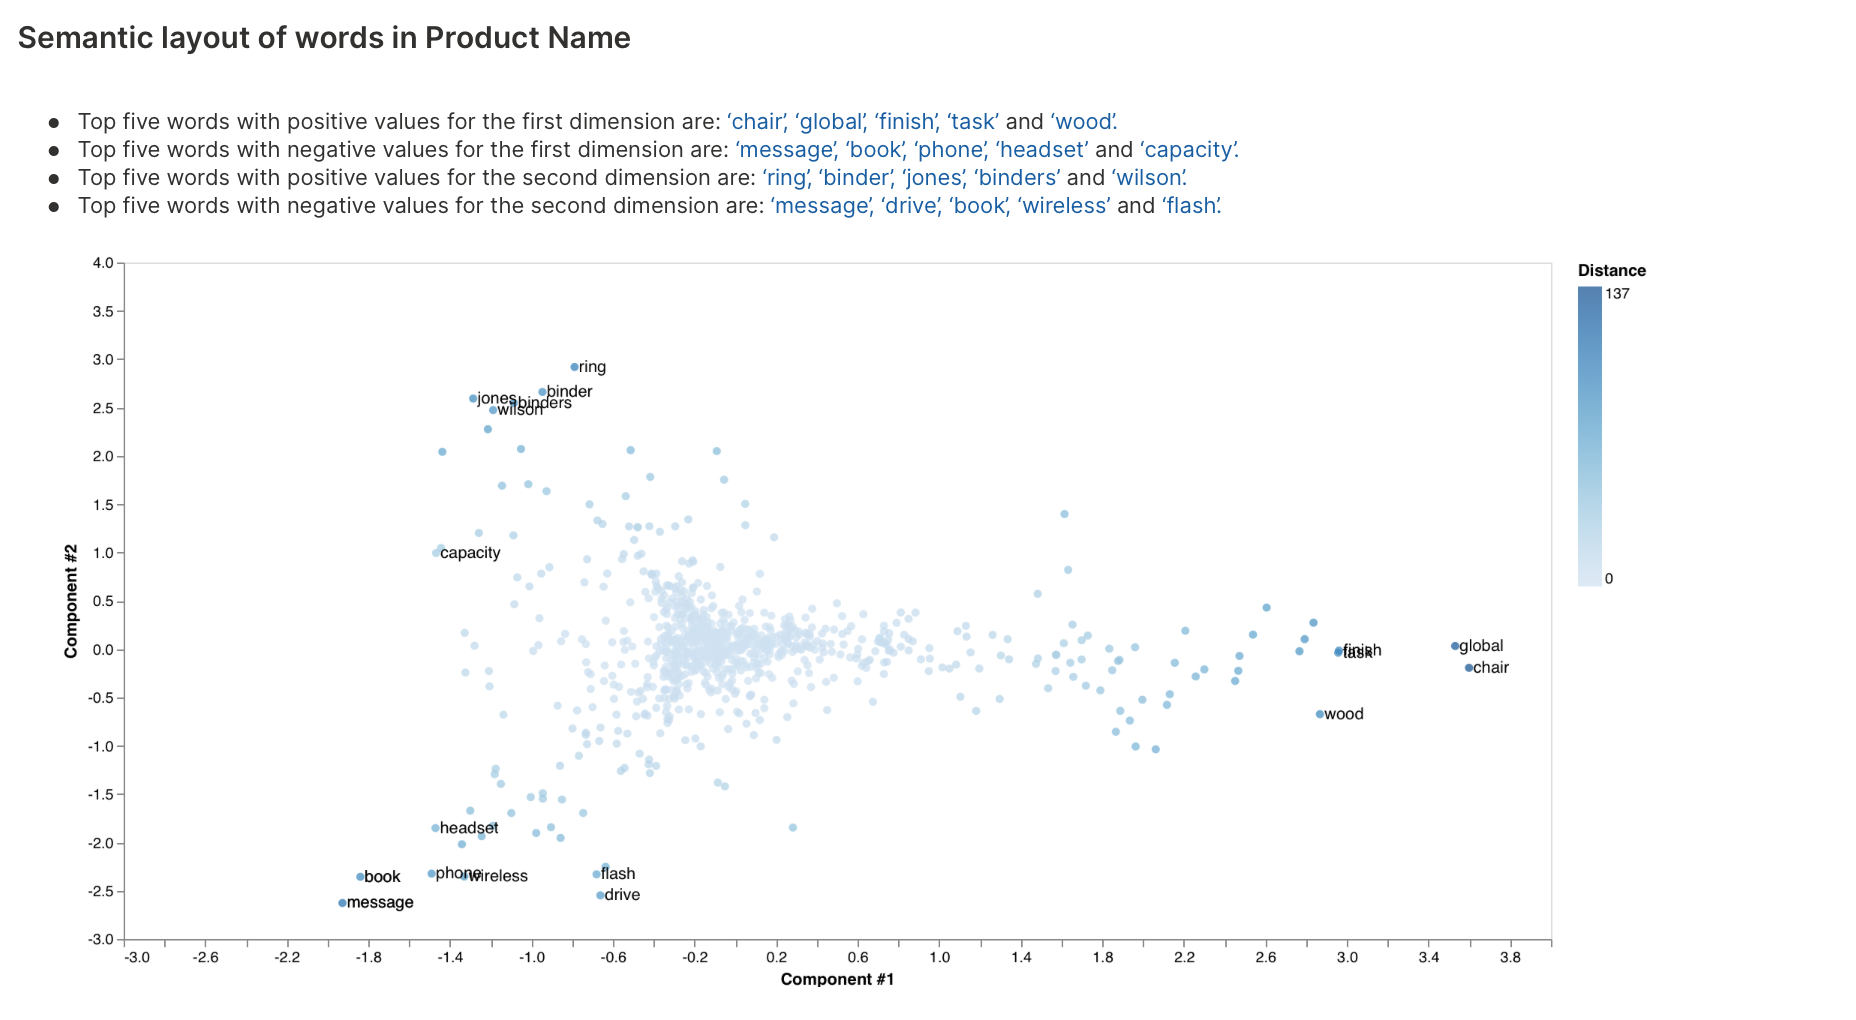
Word embeddings analysis
Word embeddings analysis helps identify words or phrases with similar meanings or presentations.
To learn about the available settings for this analysis type, see Analyses settings: Word embeddings analysis.
Sentiment analysis
Sentiment analysis is the interpretation and classification of positive, negative, and neutral sentiment within text data.
There are no customizable settings for this analysis type.
Models
H2O AutoInsights computes the sentiment of a text column with different algorithms (models) based on the available hardware:
- GPU availability: If there is a GPU available, H2O AutoInsights predicts the sentiment of a text column using a pre-trained DistilBERT model
- CPU: If there is only a CPU, H2O AutoInsights utilizes a TF-IDF vectorizer to transform the data into numerical vectors and generate sentiment predictions using a pre-trained logistic regression model.
- The TF-IDF vectorizer and logistic regression model were prebuilt (trained) using customer reviews from various hotels and e-commerce websites (for example, Amazon)
Topic modeling analysis
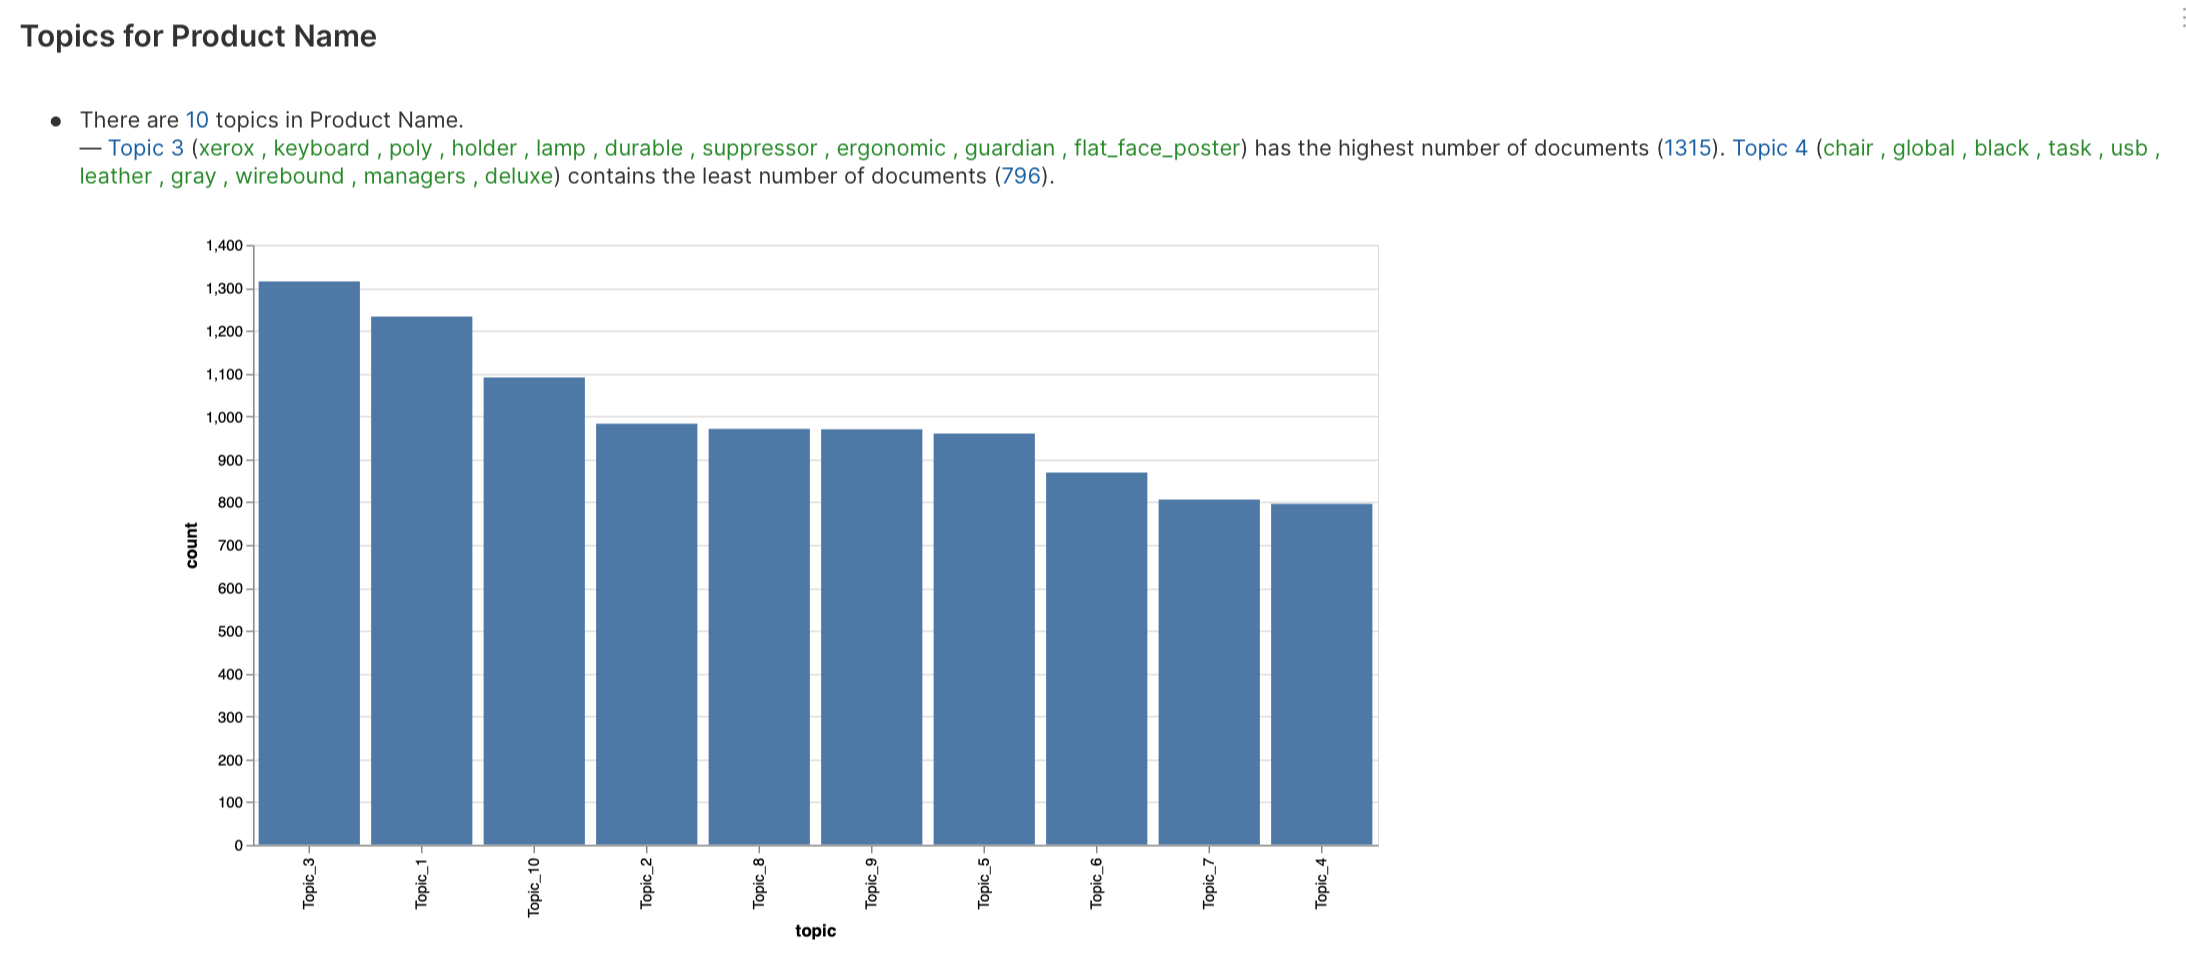
Topic modeling analysis is the process of automatically extracting meaning from texts by identifying recurrent themes or topics.
To learn about the available settings for this analysis type, see Analyses settings: Topic modeling analysis.
Data preprocessing
Before a topic modeling analysis, H2O AutoInsights removes from the text the following:
- Punctuations
- Emails
- Numbers
- Currency symbols
- Accents
Modeling
During a topic modeling analysis, H2O AutoInsights creates a corpus of words from the data. You can configure the corpus by tweaking certain settings like the number of distinct words and frequency of words. A Latent Dirichlet Allocation (LDA) model is trained on the corpus with the expected number of topics configured; by default, the model assumes ten topics exist in the data. The topic model that works underneath is an online implementation of the LDA model, which means the model incrementally gets trained on batches of data, thus preventing H2O AutoInsights from crashing due to out-of-memory while being faster than a traditional LDA model.
Topic modeling results
- Topic frequency distribution: A topic frequency distribution is generated to understand the frequency of various topics in the dataset
- Inter-topic distance map: Document-topic distribution and topic-word distribution are retrieved from the Latent Dirichlet Allocation (LDA) model. As a result, an inter-topic distance map is generated via multi-dimensional scaling to understand the similarity between topics. Likewise, the visualization helps understand the distribution of words that make up a topic
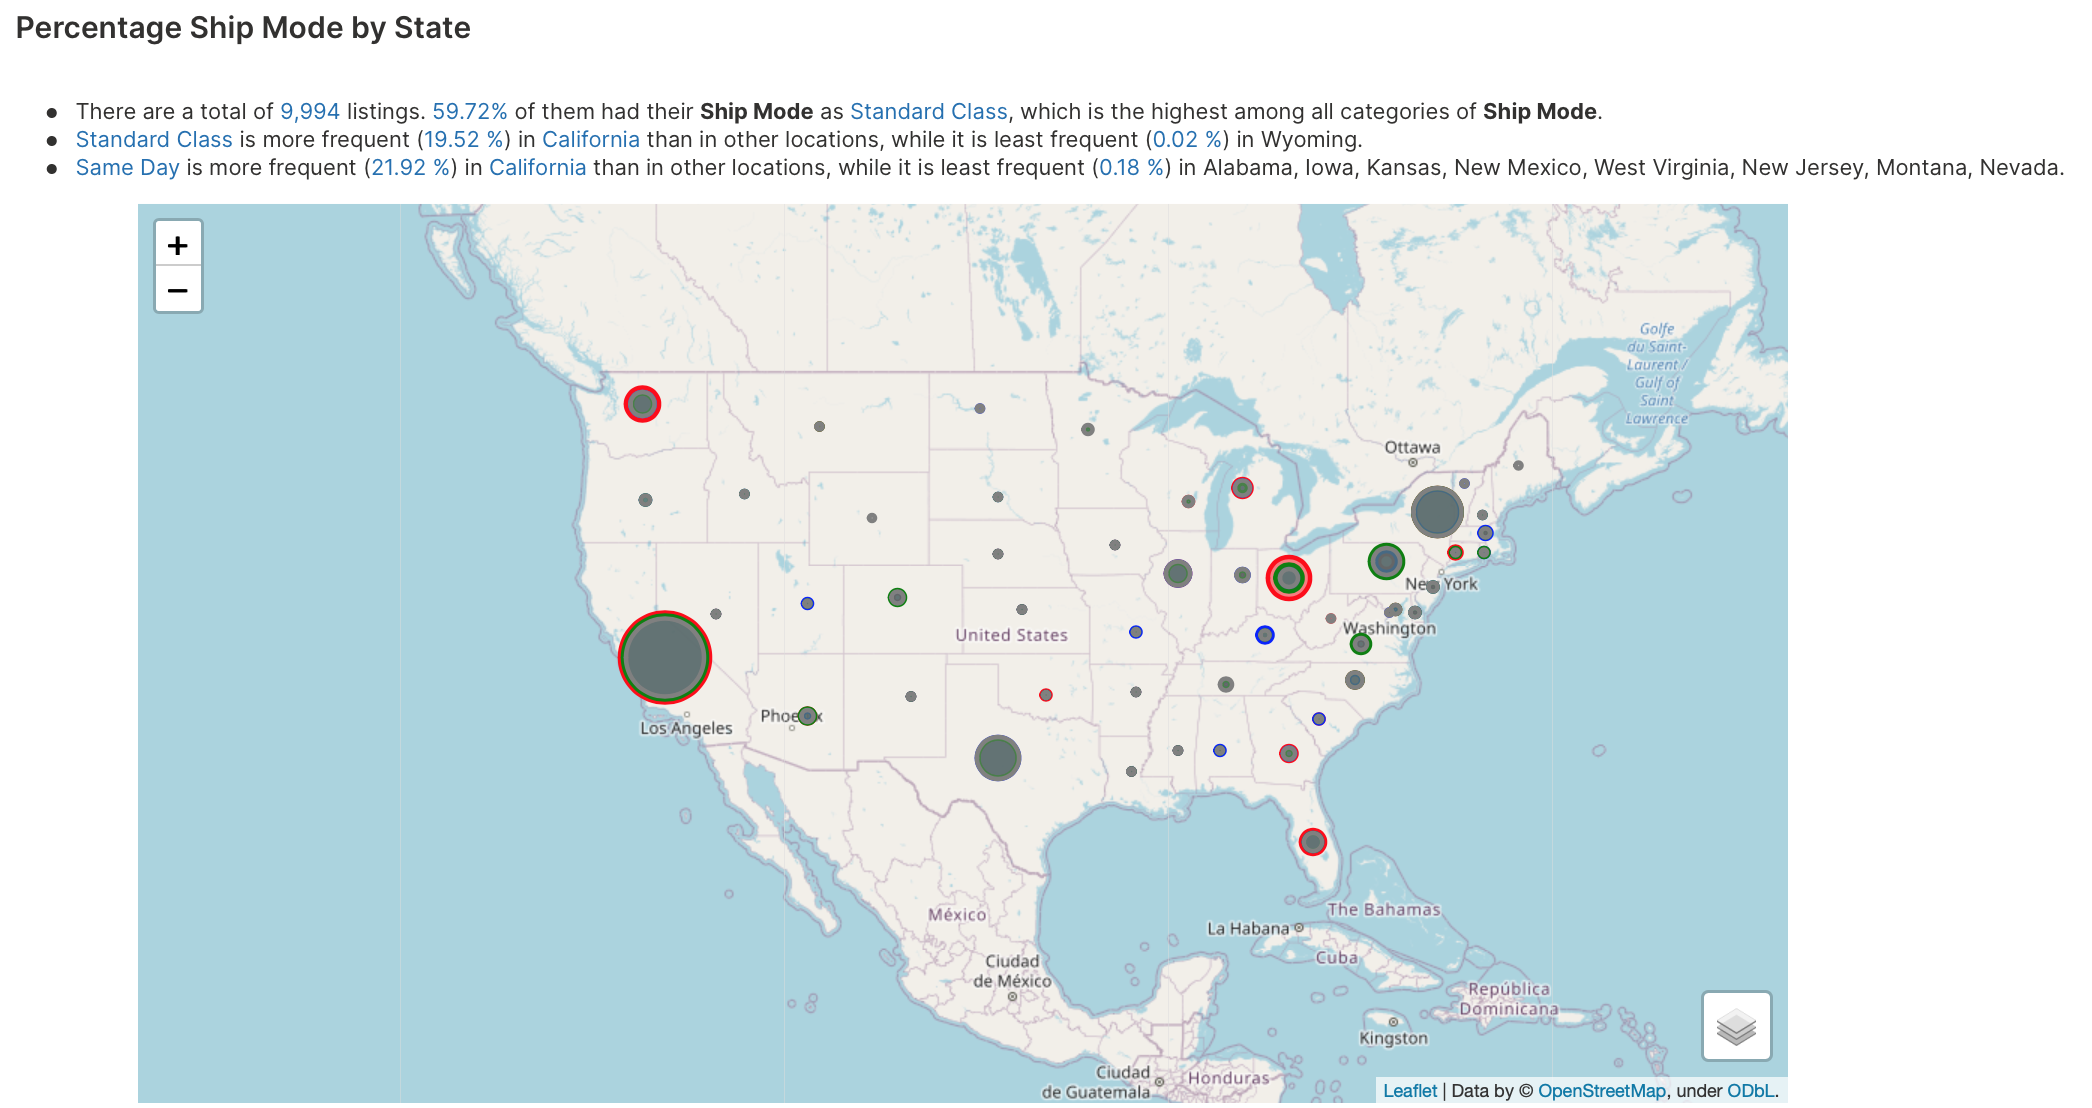
Geographic analysis
Geographic analysis is the process of automatically identifying trends in data with geographical maps. This analysis helps explore complex insights in easy-to-understand visual maps.
To learn about the available settings for this analysis type, see Analyses settings: Geographic analysis.
- Submit and view feedback for this page
- Send feedback about H2O AutoInsights to cloud-feedback@h2o.ai