View a dataset's summary
Overview
You can generate a dataset summary for any dataset imported to H2O AutoInsights. H2O AutoInsights generates a dataset summary by analyzing and providing summaries about each dataset column. In a dataset summary:
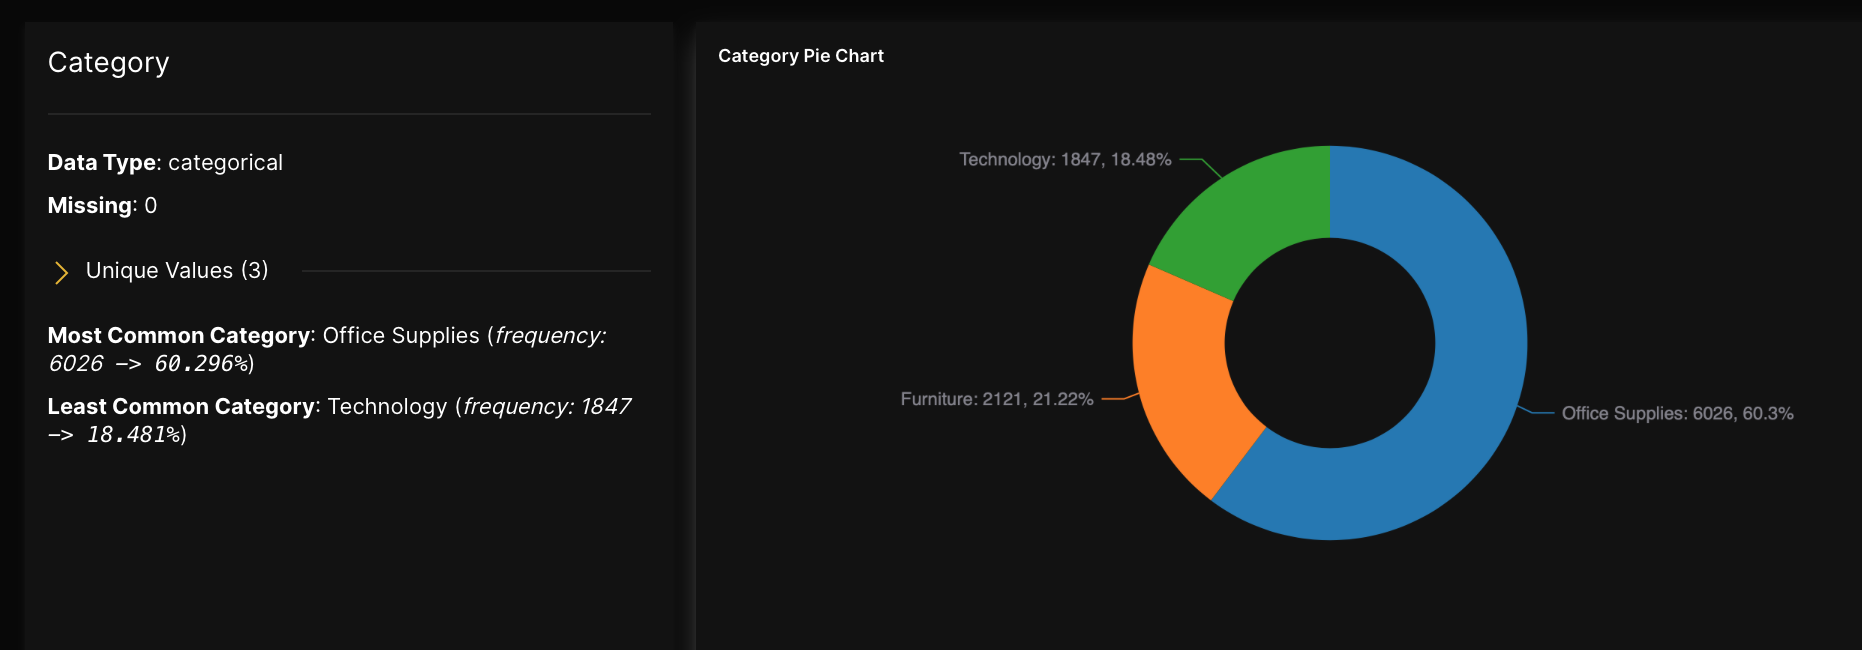
- For categorical low cardinality columns, a pie chart is displayed with percentages for all categories, plus a list of all unique values and top/bottom counts
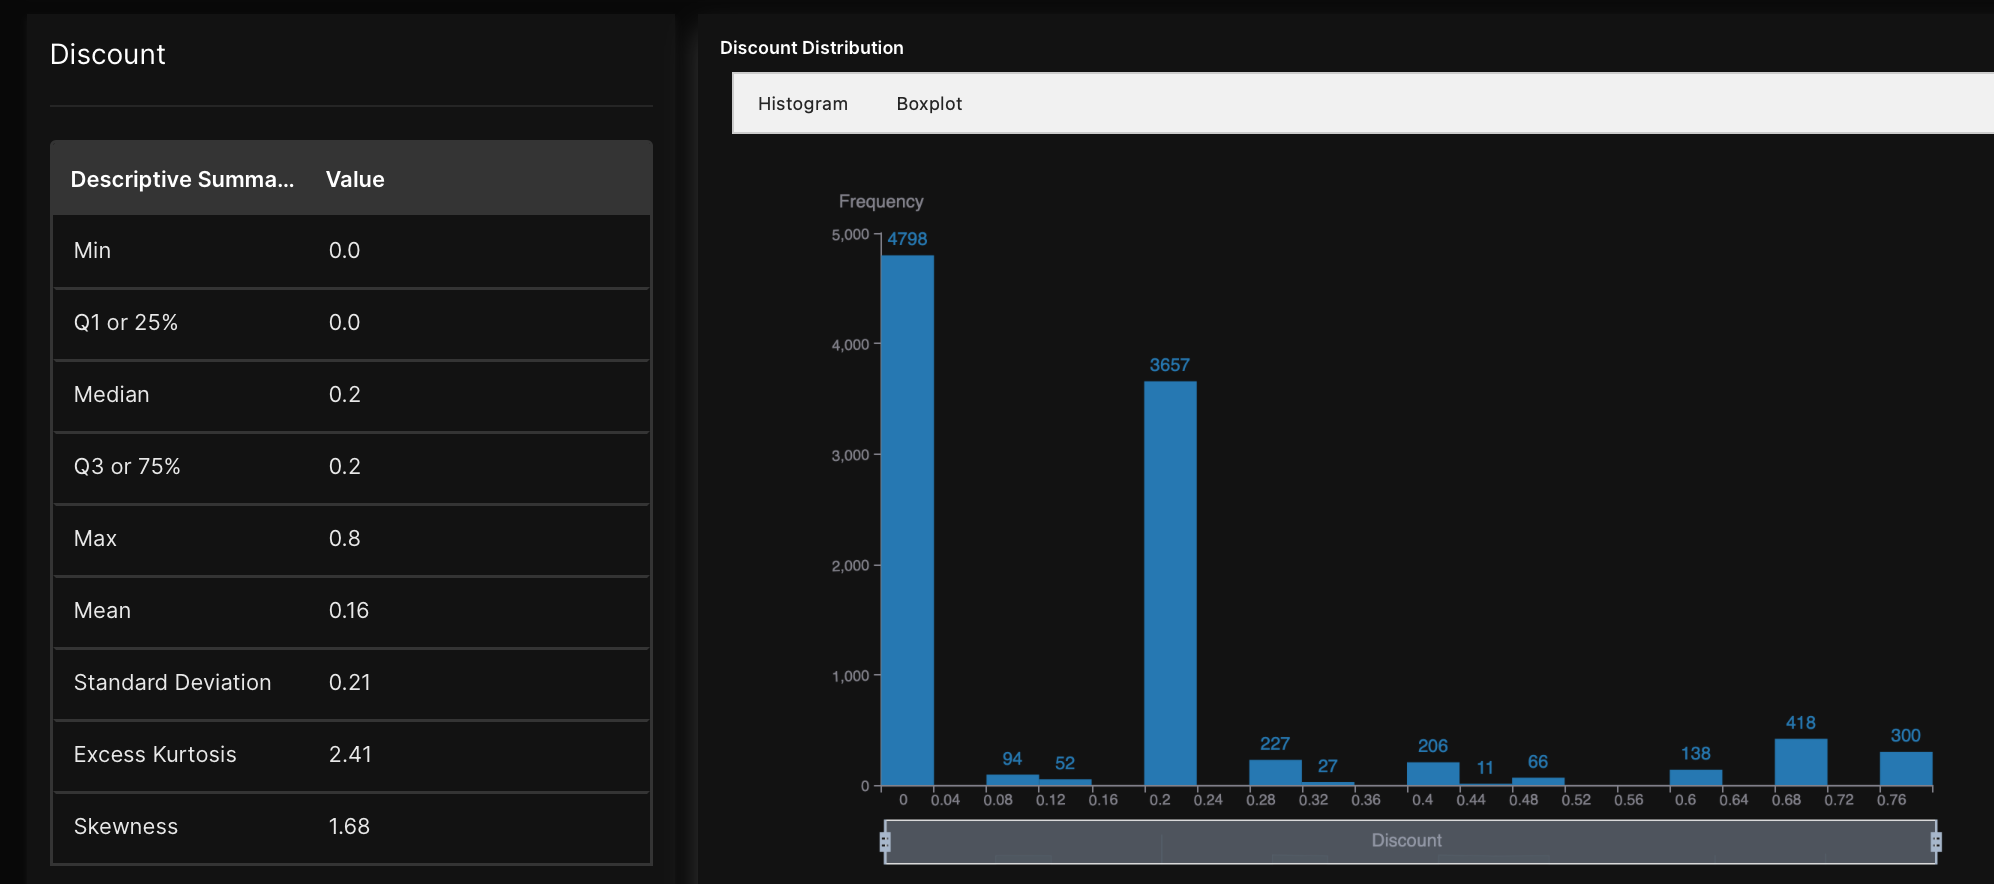
- For numeric columns, common descriptive statistics such as min, max, mean, median, quantiles, standard deviation, kurtosis, and skewness are displayed
Instructions
To view a dataset's summary, consider the following instructions:
- In H2O AutoInsights, click Menu.
- Click Datasets.
- In the Datasets table, click the name of the dataset's summary you want to view.
- Click Preview.
- Click Summary.
Feedback
- Submit and view feedback for this page
- Send feedback about H2O AutoInsights to cloud-feedback@h2o.ai