View a dataset's summary
Overview
An imported dataset contains a dataset summary that you can view anytime. A dataset summary contains an array of summary metrics, for example, count, mean, standard deviation, min, max, and missing.
Instructions
To access a dataset summary, consider the following instructions:
- In the H2O Model Validation navigation menu, click Datasets.
- In the Datasets table, click the name of the dataset you want to view its dataset summary.
Dataset summary table
note
H2O Model Validation marks feature columns with N/A (not applicable) if the column feature value is non-numeric.
| Column name | Description |
|---|---|
Feature | Feature name (one of the column names in the dataset). |
Data type | Data type. For example, integer. |
Count | Number (count) of value features present in the feature column. |
Missing | Number of missing feature values. |
Missing ratio | Percentage of missing feature values (N) (N/ Number of rows). |
Mean | Typical feature value. |
Standard deviation | Standard deviation. A measure of divergence or distribution of the feature values. |
Min | Minimum feature value. |
Max | Maximum feature value. |
Number of unique | Unique feature values. |
Frequency | Feature frequency value. |
Datetime format | Date string format (for example, yy-mm-dd, hh-mm-ss (hourly granularity) or dd-mm-yy). |
Datetime unit | The highest unit of time. Based on incremental date changes (for example, seconds, minutes, hours, days, or weeks). |
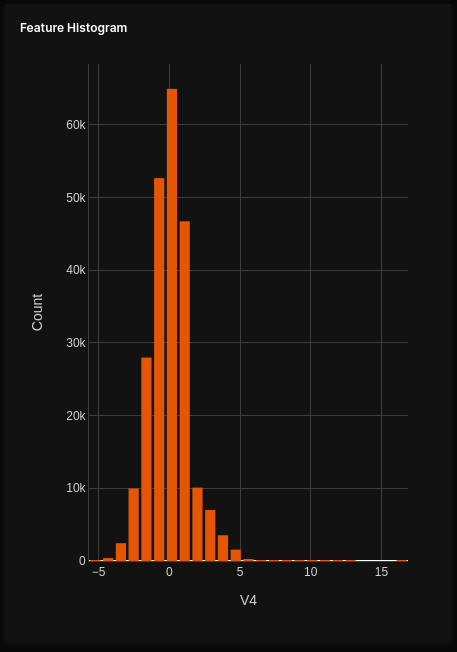
Histogram: Feature histogram
The feature histogram displays the data frequency distribution of the selected feature in the Dataset summary table.
- X-axis: Feature values
- Y-axis: Number of feature values
Feedback
- Submit and view feedback for this page
- Send feedback about H2O Model Validation to cloud-feedback@h2o.ai