Time Series Best Practices
This document describes best practices for running time series experiments in Driverless AI.
Preparing Your Data
The goal for a time series use case is to use historical data to forecast. The manner in which the data for forecasting is formatted depends on what we want to do with this forecast. To format your data for forecasting, aggregate the data for each group you are interested in for a specific period of time.
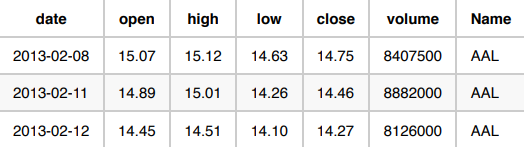
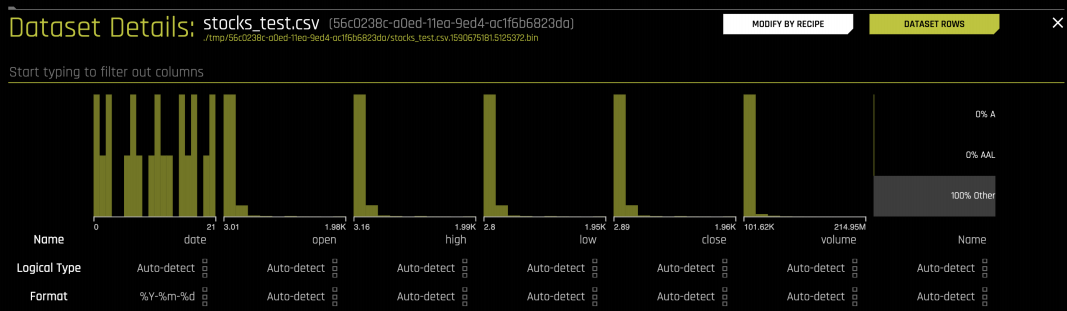
The following are three use cases in which the volume of stocks sold in the S&P 500 is predicted. Each use case provides a unique scenario that determines how the data is formatted. Our raw data looks like this:
Use Case 1: Forecast the total volume for a stock tomorrow.
For this use case, you can leave the data as is because it is already aggregated by
Nameand day.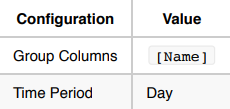
Use Case 2: Forecast the total volume for a stock next month.
For this use case, calculate the total volume per
Nameand month.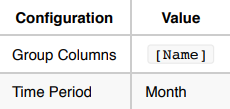
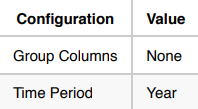
Use Case 3: Forecast the total volume of all S&P 500 stocks next year.
For this use case, calculate the total volume of all S&P 500 stocks over the course of a year.
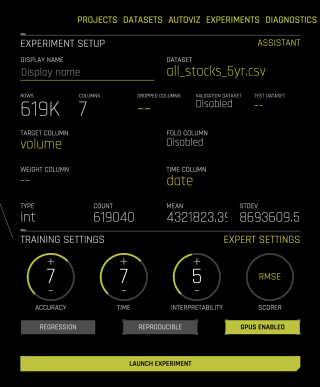
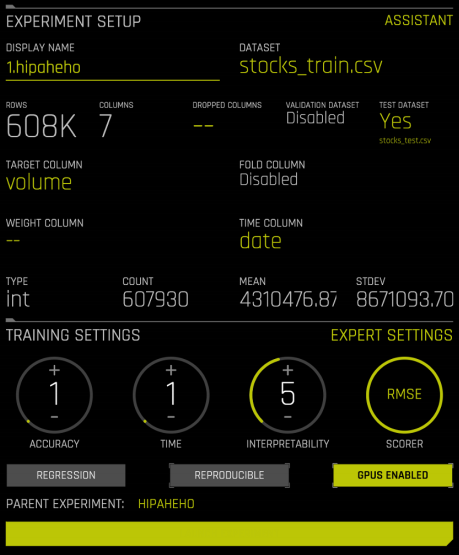
Experiment Setup
Once your data is formatted to match your use case, you can begin setting up your experiment.
Enabling the Time Series Recipe
To begin setting up your experiment, provide the following:
Training data
Target column
Time column (providing the time column enables the Time Series recipe)
Time Series Settings
Once you have provided the time column, you are asked to fill in time series-specific configurations.
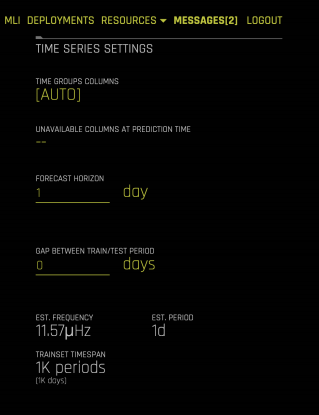
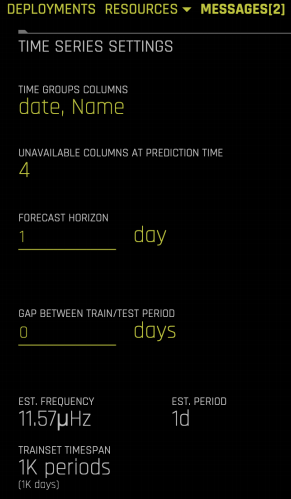
Time Group Columns: The columns that separate the data into individual time series. In this example, there is one time series per stock (column: Name ), so Name is selected as the time group column.
Unavailable Columns at Prediction Time: The columns that are not known at time of prediction. In the S&P 500 data example, the independent variables are
open,high,low, andclose. Any variables that are not known in advance must be marked as columns that are unavailable at prediction time. Driverless AI only uses historical values for the independent variables that are marked.Forecast Horizon: How far in advance you want to forecast.
Gap: Specify whether there is any gap between the training data and when you want to start forecasting. For example, if on Monday you want to predict the volume of a stock for Wednesday and Thursday, then you must provide the following configurations:
Forecast Horizon = 2 days
Gap = 1 day
For the first use case (forecast the volume of a stock tomorrow), the time series-specific configurations are set as follows:
Validation and Testing
For a time series use case, always validate and test the models on more recent data. In Driverless AI, validation data is automatically created by default, and this data is used to evaluate the performance of each model.
The test data is an optional dataset that is provided by the user. It is not used by Driverless AI until after the final model has already been chosen to prevent any accidental overfitting on the test data.
Validation Data
Validation data is automatically generated by Driverless AI using a rolling window approach. The number of time units contained in the validation data matches the forecast horizon and gap configurations. If you want to forecast the next day, the validation data must consist of one day’s worth of data. If you want to forecast the next five days, the validation data must consist of five days’ worth of data. In the first use case, Driverless AI internally creates splits where the validation data always consists of one day of data.
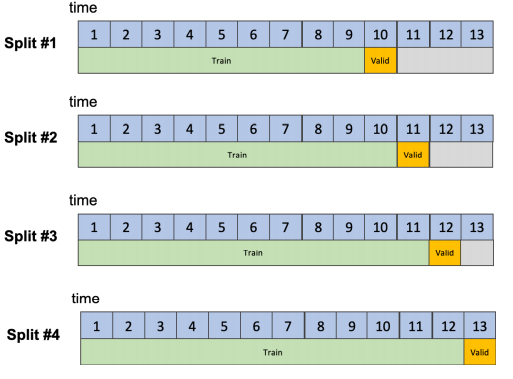
The total number of data points used to validate models is:
In a use case where the number of Time Group Columns is small and you only want to forecast stock volume for a specific stock, the validation data can become very small. For these cases, it is important to make sure that the validation data is large enough to prevent overfitting. There are generally two ways to do this: increase the number of validation splits done by Driverless AI, or increase the number of Time Group Columns in the dataset. You can increase the number of validation splits performed by Driverless AI by going to the Expert Settings under the Time Series tab:
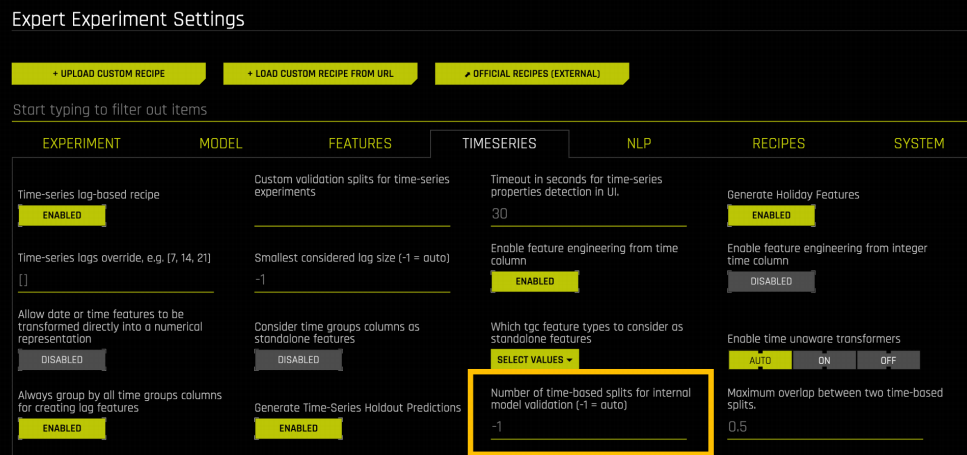
By default, Driverless AI automatically determines the number of validation splits based on the Accuracy setting (higher accuracy leads to more validation splits). You can override this to a larger number if you know that the number of rows for each validation split will be small (that is, a small number of Time Group Columns and/or a small Forecast Horizon).
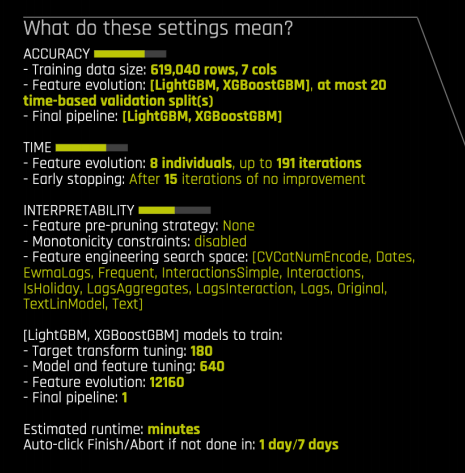
If you override this, you can see the change reflected in the experiment preview. In the following experiment, the number of validation splits has been increased to 20 in the expert settings panel. This change is reflected in the experiment preview.
Another way to prevent small validation data is to consider including more Time Group Columns. Instead of forecasting the volume for each stock separately, you can combine the data for all stocks and run a single experiment.
Test Data
The test data is an optional dataset provided by the user. Driverless AI automatically calculates the performance of the final model on this dataset but does not use it for model selection. The test dataset can be larger than the Forecast Horizon. The first use case involves forecasting the next day’s stock volume. You can, however, provide Driverless AI with one month of test data. In this scenario, Driverless AI evaluates how the model does at forecasting the next day’s stock volume over the one month period.
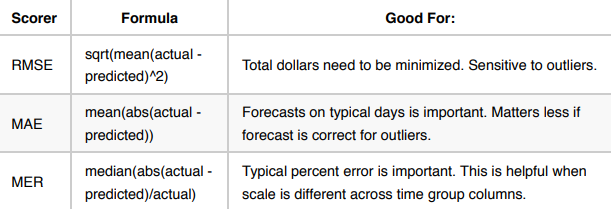
Scorers
The scorer determines how Driverless AI evaluates the success of each model.
The following is a list of popular scorers with information about which use cases they excel in.
Interpreting Models with MLI
By clicking on Interpret this Model once an experiment has completed, you can gather more information about how your final model performed on the validation and test data.
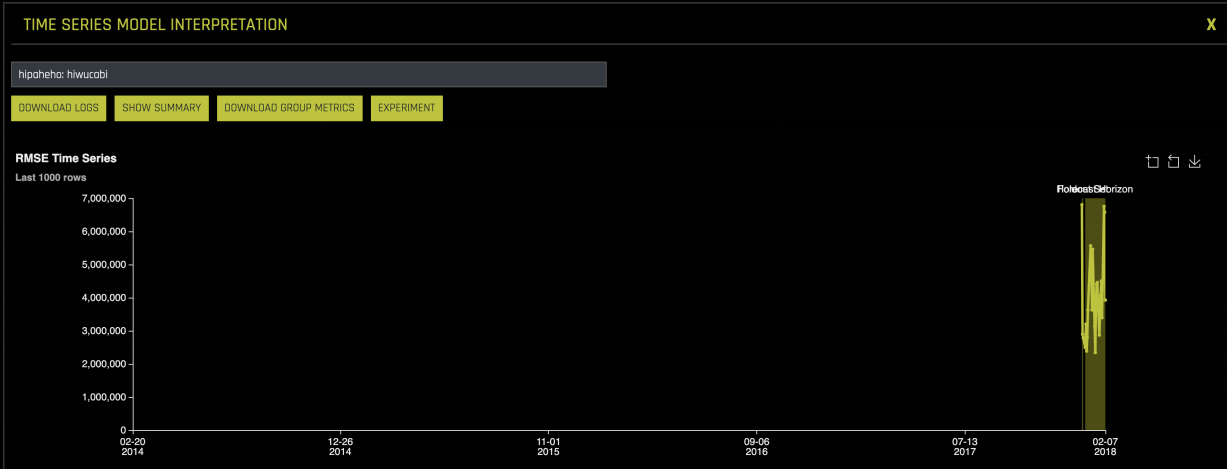
The first graph in the Model Interpretability module shows the error for each date in the validation and test data:
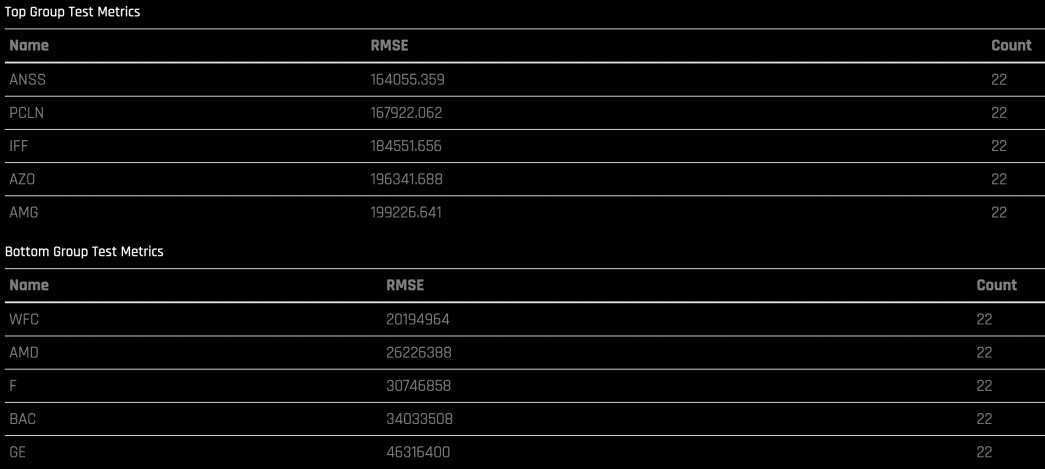
You can also see groups with very high error and very low error:
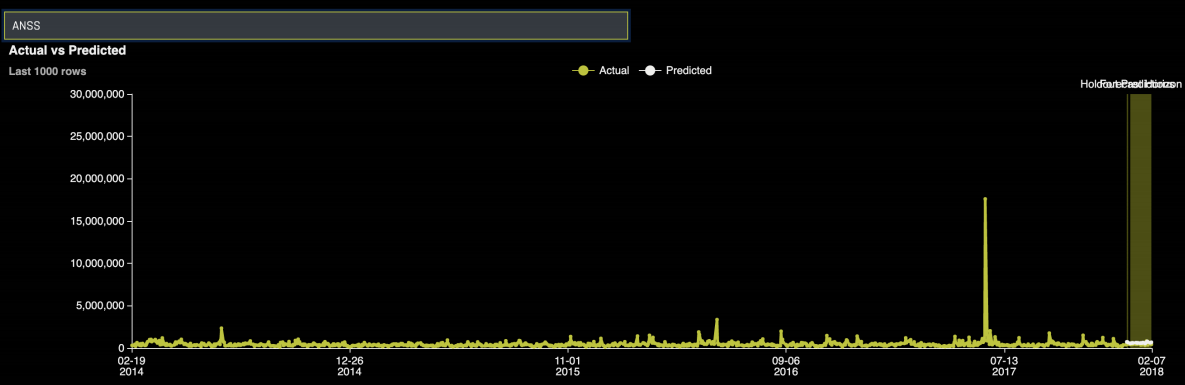
You can search for a specific group to see the actual time series vs predicted:
By clicking on a specific forecasted point, you can see the Shapley contributions for that point. The Shapley contributions tell you the effect each predictor has on the prediction for that point.
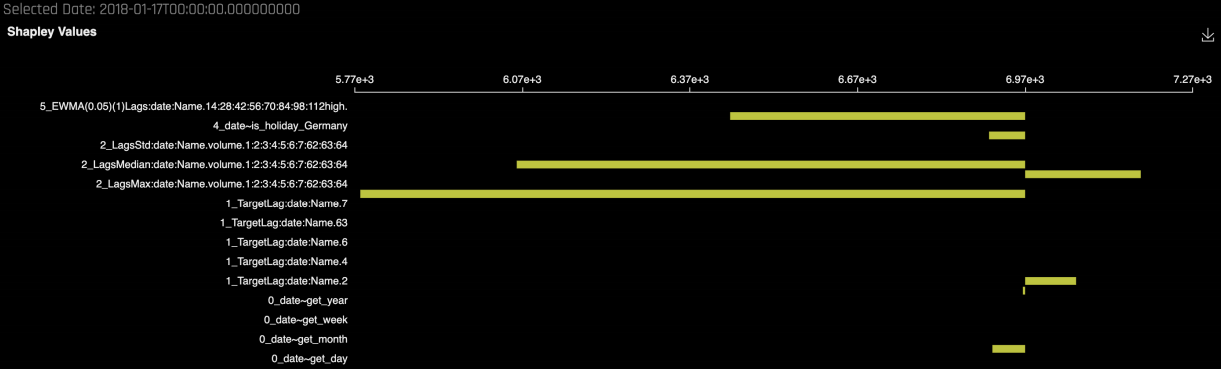
The Shapley contributions also show the strength and direction of each predictor for the selected date.
Scoring
Because Driverless AI is building a traditional machine learning model (such as GLM, GBM, Random Forest), it requires a record to score on to generate a prediction. If you want to use the model to forecast, you have three different scoring options:
Using Driverless AI
The Python Scoring pipeline
Independent of Driverless AI
Python whl with scoring function inside
The MOJO Scoring pipeline
Independent of Driverless AI
Java runtime or C++ runtime
If you want to use the model to score past the Forecast Horizon, then you can only use Driverless AI or the Python Scoring pipeline for scoring. This means that if you provide Driverless AI with training data up to 2018-02-07 and ask it to build a model to predict tomorrow’s volume, the MOJO can only be used to score for 2018-02-08.
The MOJO is stateless. It takes a single record and provides a prediction. Because it is stateless, it is only able to use information (like past behavior) that is saved from the training data. If a Driverless AI model shows that the previous day’s stock volume is very important, then once the MOJO is used to start scoring past 2018-02-08, it no longer has information about the previous day’s stock volume.
Predicting Within Forecast Horizon
If you want to predict within the Forecast Horizon, you can provide Driverless AI, the Python Scoring pipeline, or the MOJO scoring pipeline with the record that you want to predict for. Consider the following example:
The training data ends on Friday 2018-01-05 and you want to forecast the next business day’s stock volume. Therefore, Monday 2018-01-08 is within the Forecast Horizon. To predict the Stock volume for Stock: AAL on 2018-01-08, provide any scoring method with the following data.
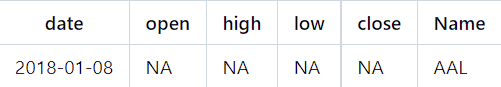
The output is the volume prediction.
Note: Because open, high, low, and close are not known at the time of prediction, these are filled in with NAs.
Predicting Outside Forecast Horizon
If you now want to use the model to predict past 2018-01-08, then you can only use Driverless AI or the Python scoring pipeline to score because the MOJO is stateless and cannot be used outside of the Forecast Horizon.
In order to forecast outside of the Forecast Horizon, you need to provide the model with any information that occurred after the training data ended up until the date you want to forecast for. In the case where you want to forecast for 2018-01-09, you must tell the model what happened on 2018-01-08 (this date was not in the training data, so Driverless AI does not know what ended up happening on that date).
In order to score for 2018-01-09, provide Driverless AI with the following data.
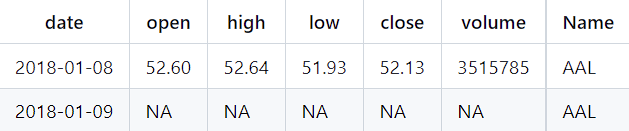
The model now returns two predictions: one for 2018-01-08 and one for 2018-01-09 (the prediction of interest).
Other Approaches
Using the IID Recipe
Sometimes it can be helpful to try building an experiment without the Time Series recipe even if you have a forecasting use case. The Time Series recipe relies heavily on lagging the data, which means that it is most helpful for cases where the past behavior is predictive. If you have a use case where there is no strong temporal trend, then it may be helpful to use Driverless AI without the Time Series recipe turned on. You can do this by simply not providing a Time Column when setting up the experiment.
Notes:
If you decide to try the model without Time Series turned on, make sure to provide a test dataset that is out of time.
By default, Driverless AI performs random cross validation that can lead to overfitting if you have a forecasting use case.
If you do not provide the Time Column, you will not be able to tell Driverless AI which columns are unavailable at prediction time. This means that you must lag your data in advance.
Lagging Data in Advance
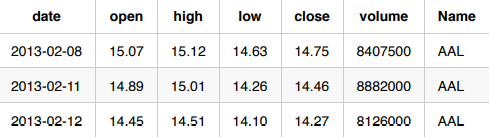
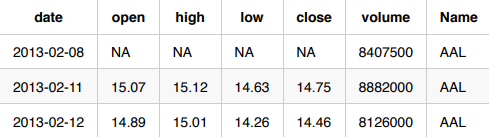
For this use case, you do not know the open, close, low, and high predictors in advance. If you want to use Driverless AI without the Time Series recipe turned on, you must manually lag these variables so that they consist of the previous day’s information.
Original Data:
Lagged for Driverless AI IID
You can do this by using the Data Recipe option in Driverless AI. To do this, click on the Details of the Dataset and select Modify by Recipe:
You can upload a modification recipe or use Live Code. If you choose to use Live Code, you can see a preview of the code and how it will modify the dataset:
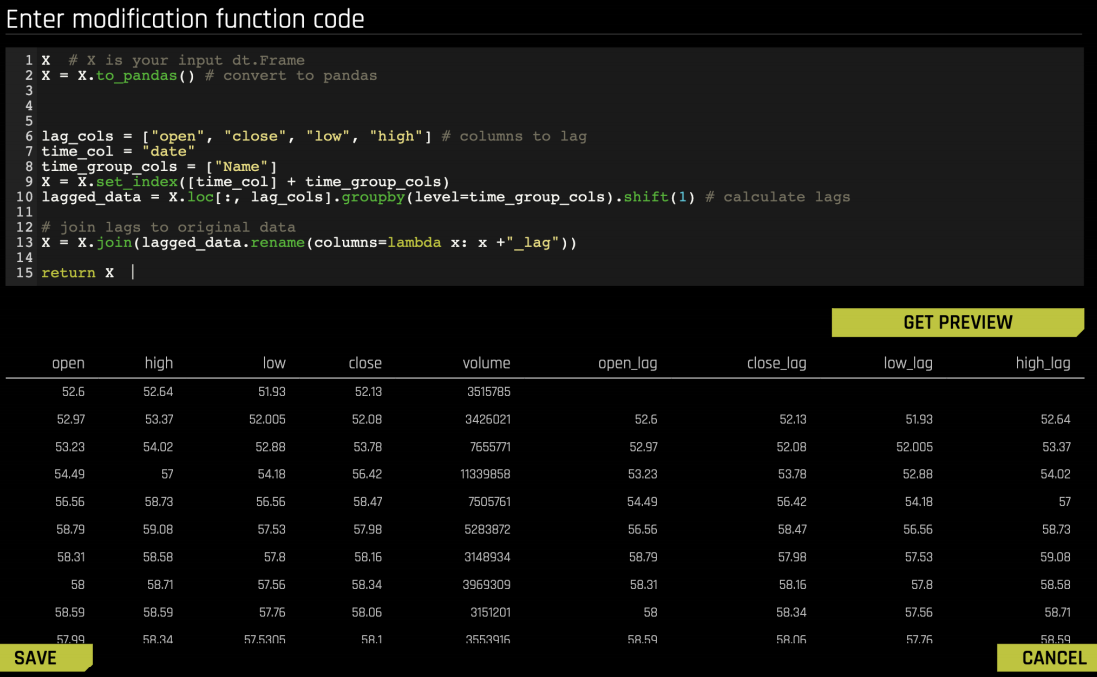
The following is the code used for this example:
X # X is your input dt.Frame
X = X.to_pandas() # convert to pandas

# Calculate lags
lag_cols = ["open", "close", "low", "high"] # columns to lag
time_col = "date"
time_group_cols = ["Name"]
X = X.set_index([time_col] + time_group_cols)
lagged_data = X.loc[:, lag_cols].groupby(level=time_group_cols).shift(1)

# Join lags to original data
X = X.join(lagged_data.rename(columns=lambda x: x +"_lag"))

return X