Task 7: DAI model tab
Overview
In the DAI MODEL tab, you'll find a range of visualizations and insights into how the H2O Driverless AI model operates.
Shapley values for transformed features
One key visualization available in the DAI MODEL tab is the Shapley Values for Transformed Features plot.
- In the DAI MODEL tab, click the Shapley Values for Transformed Features tile.
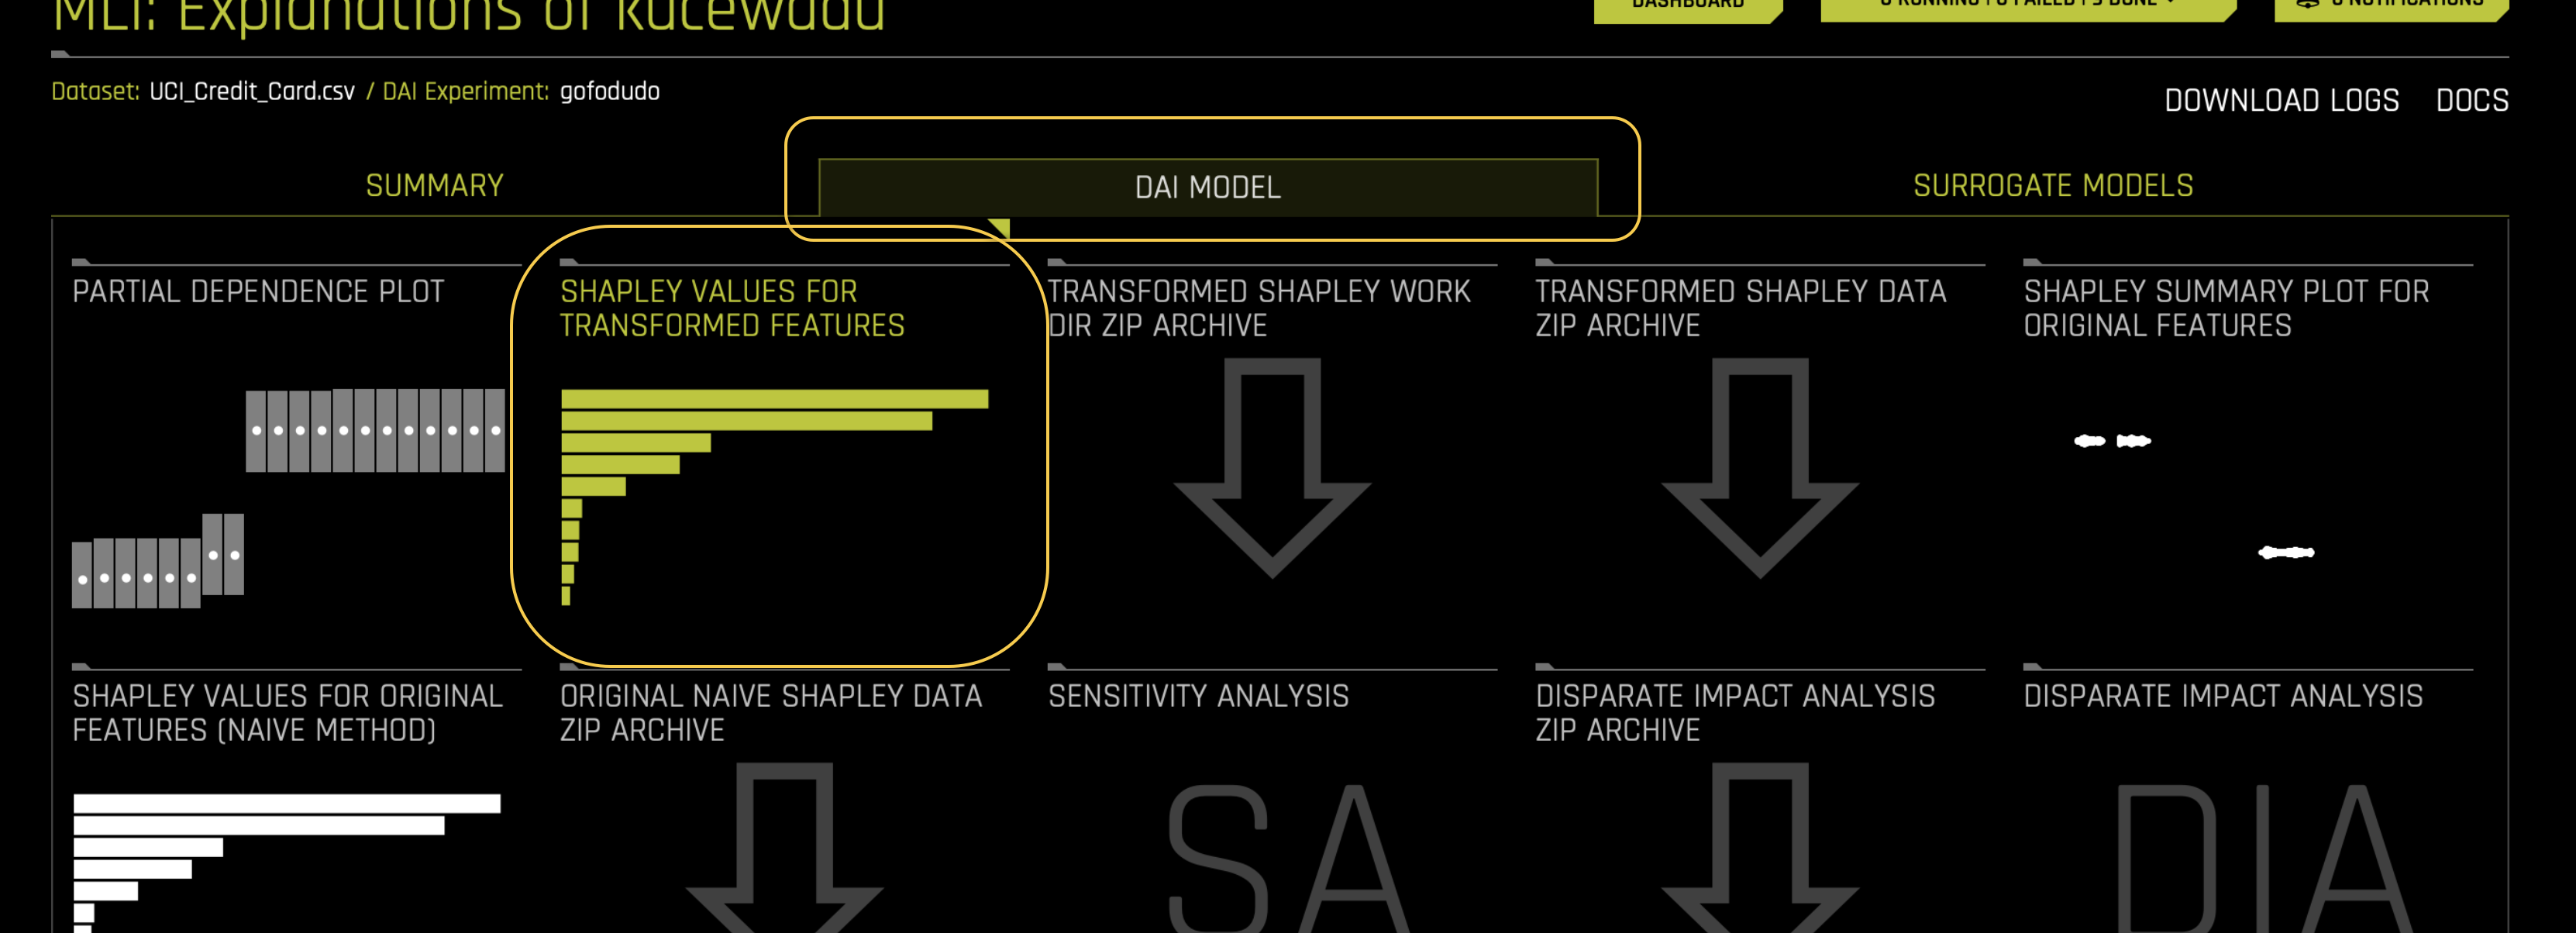
This plot gives you an overview of the primary transformed features influencing the model's behavior, indicating whether these features positively or negatively affect its predictions.
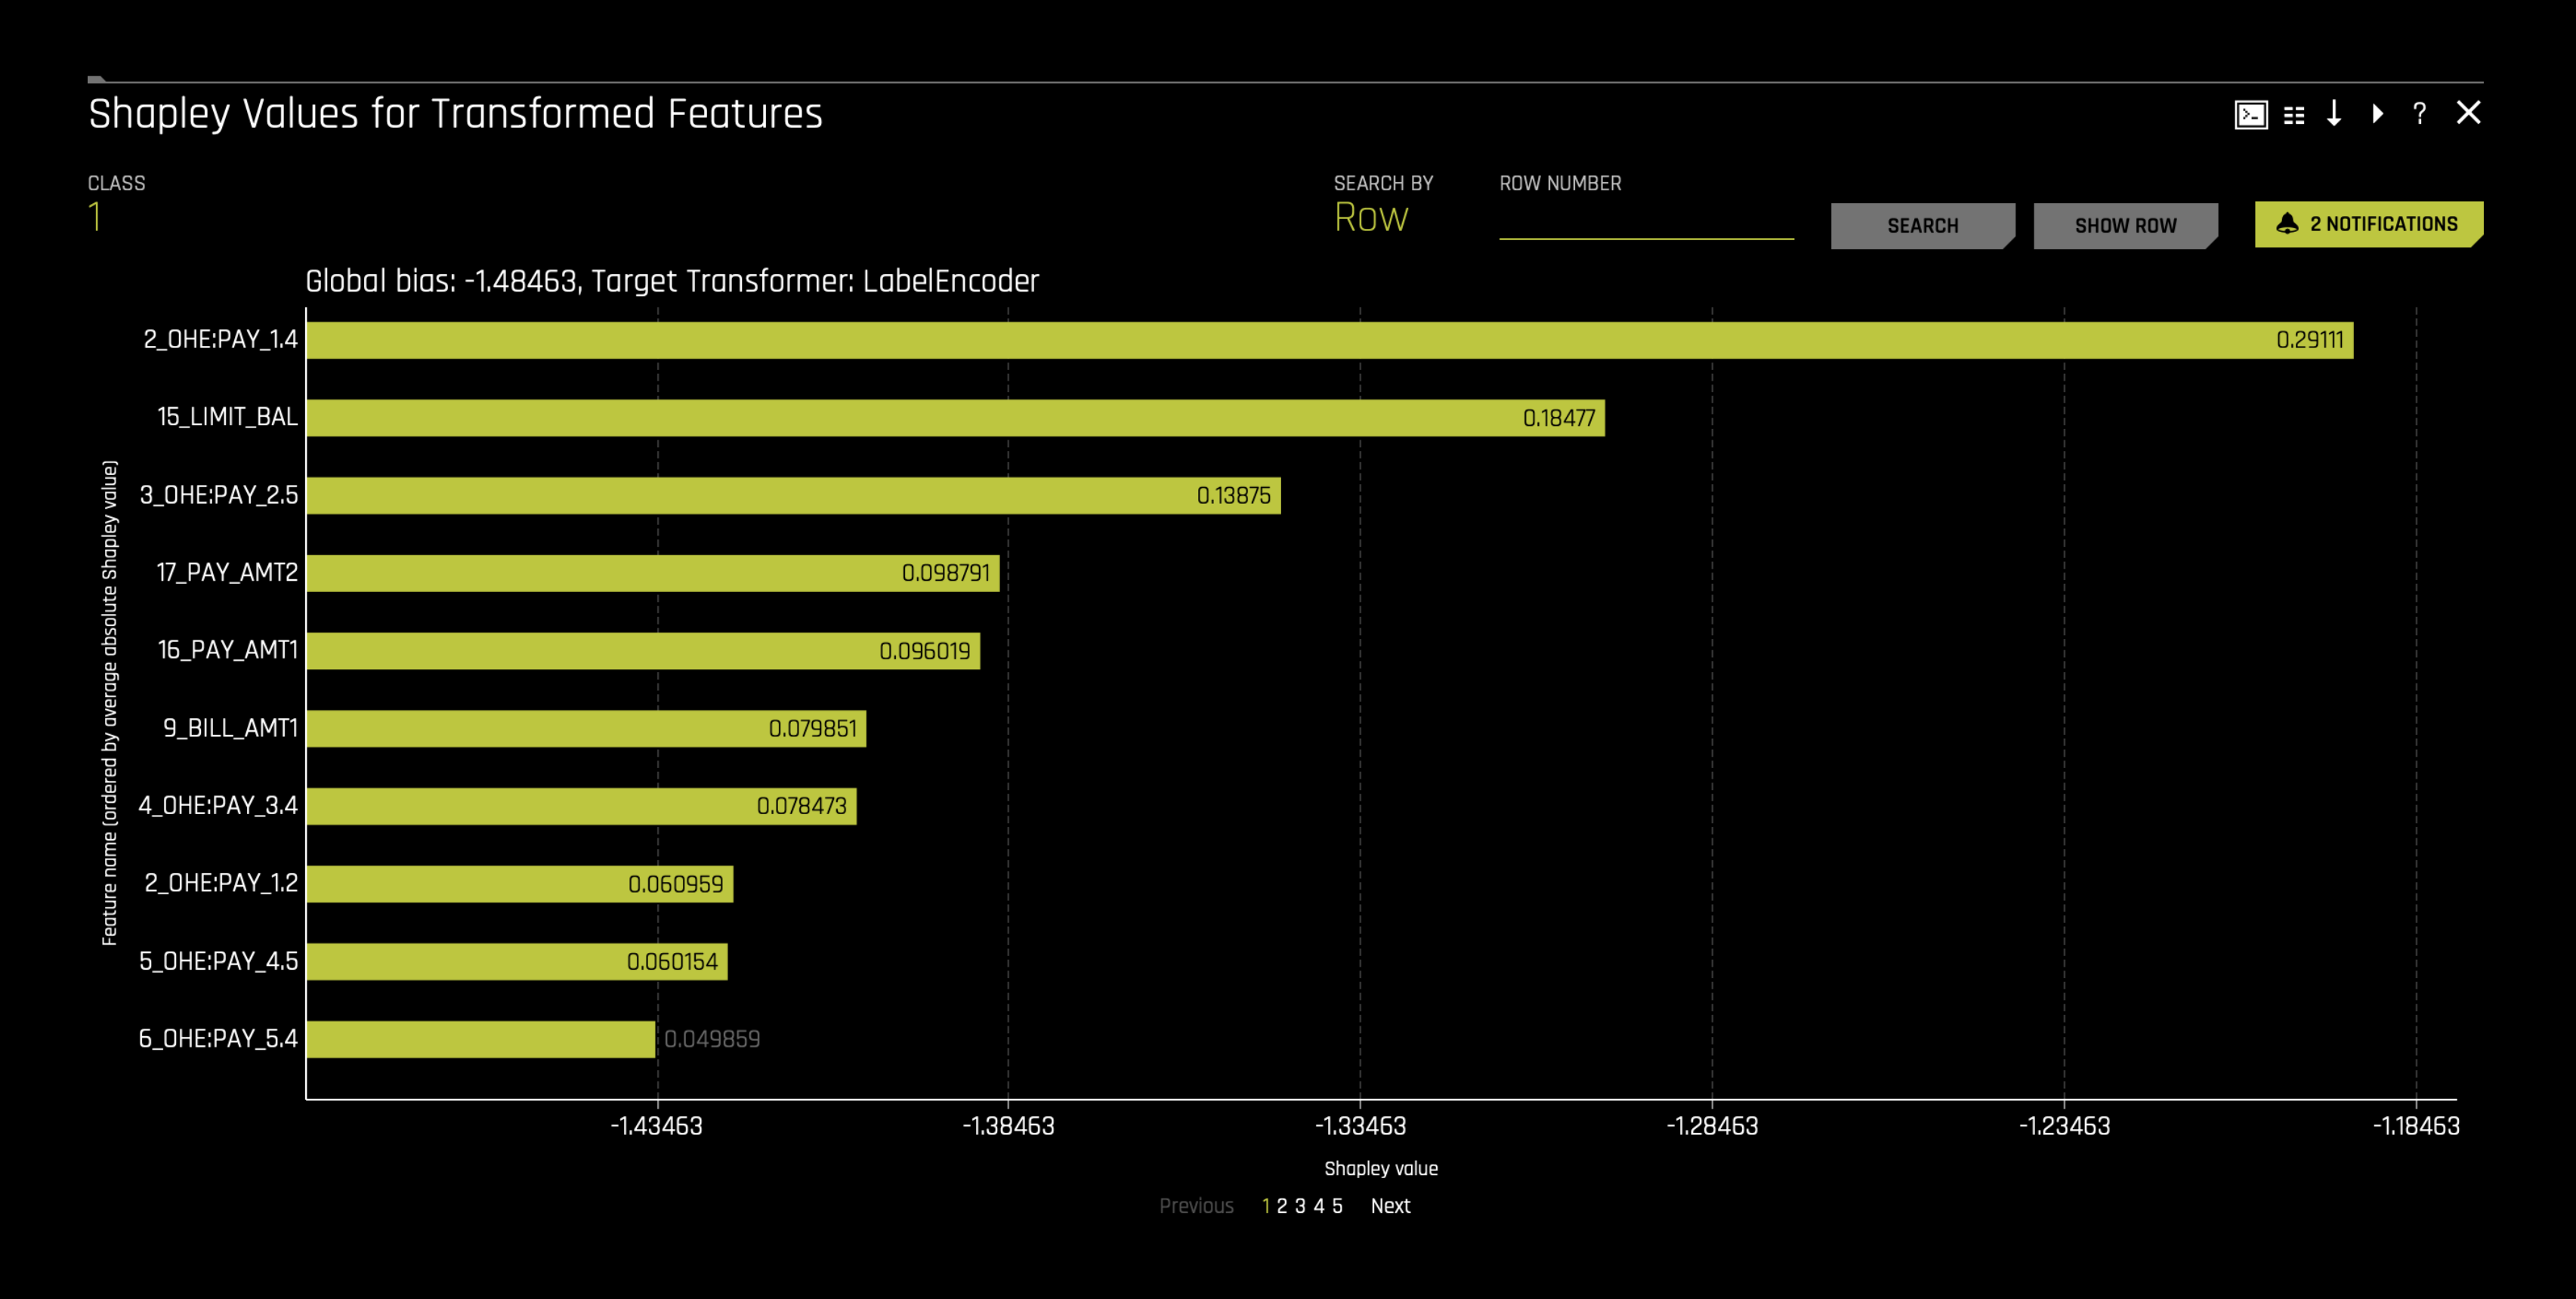
Understanding the significance of these transformed features in the Shapley plot can be complex. Still, it's essential for grasping the model's inner workings and how different features contribute to its predictions. Moreover, the DAI MODEL tab allows you to gain a mathematically precise understanding of the mechanisms of the highly complex and nonlinear H2O Driverless AI model.
Therefore, for this tutorial in the next task, we will observe the surrogate models of the H2O Driverless AI model, which will allow you to dive deeper into understanding its complexities in the original feature space. These surrogate models offer approximate explanations of what influences the model's behavior within the original feature space, providing valuable insights for interpreting the model, debugging it, and refining it.
Consequently, surrogate models are employed to elucidate the intricacies of the developed H2O Driverless AI model, though in an approximate manner, as surrogate models inherently approximate the H2O Driverless AI model.
Partial Dependence Plot
The Partial Dependence Plot (PDP) illustrates the relationship between a selected input variable and the model's predicted outcome, averaged over the dataset. This visualization helps in understanding how changes in a particular feature influence the model's predictions on average. The PDP is represented by a yellow line, accompanied by ±1 standard deviation bands, indicating the variability of the predictions.
H2O Driverless AI overlays Individual Conditional Expectation (ICE) plots onto the PDP. ICE plots, shown in grey, depict the prediction behavior for individual data instances as the selected feature varies across its range. This combination allows users to compare the model's average prediction behavior with its behavior on specific instances, providing insights into both global and local model interpretations.
- For more information, see Partial Dependence and ICE Technique in the H2O Driverless AI documentation.
- For detailed information about the other plots in the DAI model tab, see Task 6 in Tutorial 4A.
Now that you have learned about the DAI model tab and its plots, in Task 7 you will explore the Surrogate models tab.
- Submit and view feedback for this page
- Send feedback about H2O Driverless AI | Tutorials to cloud-feedback@h2o.ai