Task 7: Interpret built model
To delve deeper into the NLP model we've constructed, let's utilize the INTERPRET THIS MODEL button in H2O Driverless AI to generate an MLI report. This functionality is particularly valuable for enhancing machine learning interpretability, especially in regulated industries where transparency and explanation are crucial. You can interpret the model by using the generated MLI report. As a result, you can uncover valuable insights into its inner workings, such as feature importance and other performance metrics. This process can empower you to understand better and trust the predictions made by the model.
- Click INTERPRET THIS MODEL.
- Select WITH DEFAULT SETTINGS.
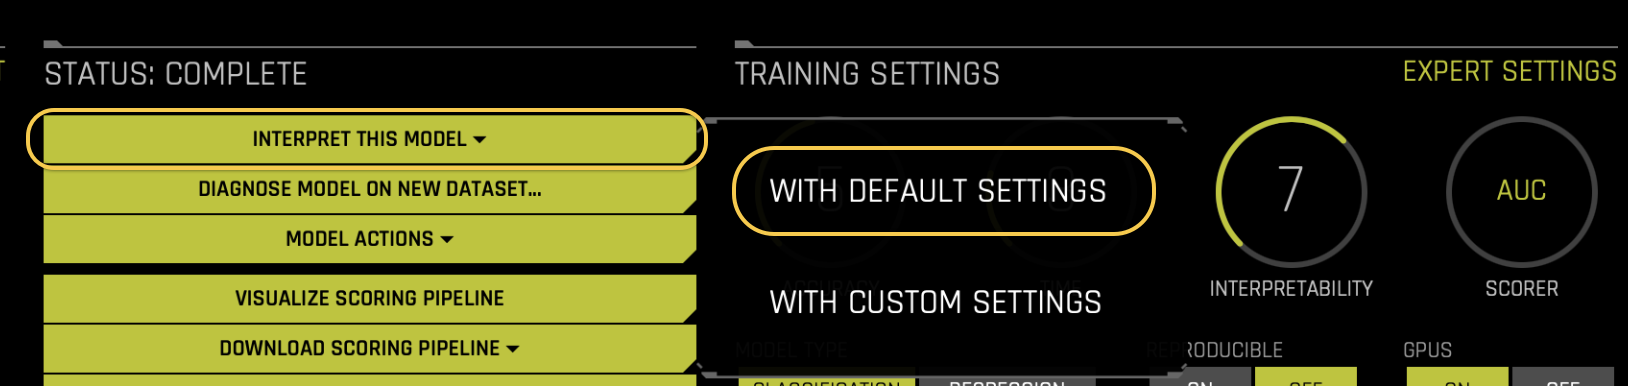
- Wait a few moments for the MLI report to get generated.
NLP
The NLP tab is organized into tiles for each interpretation method relevant for natural language processing (NLP) models. To view a specific plot, click the tile for the plot that you want to view.
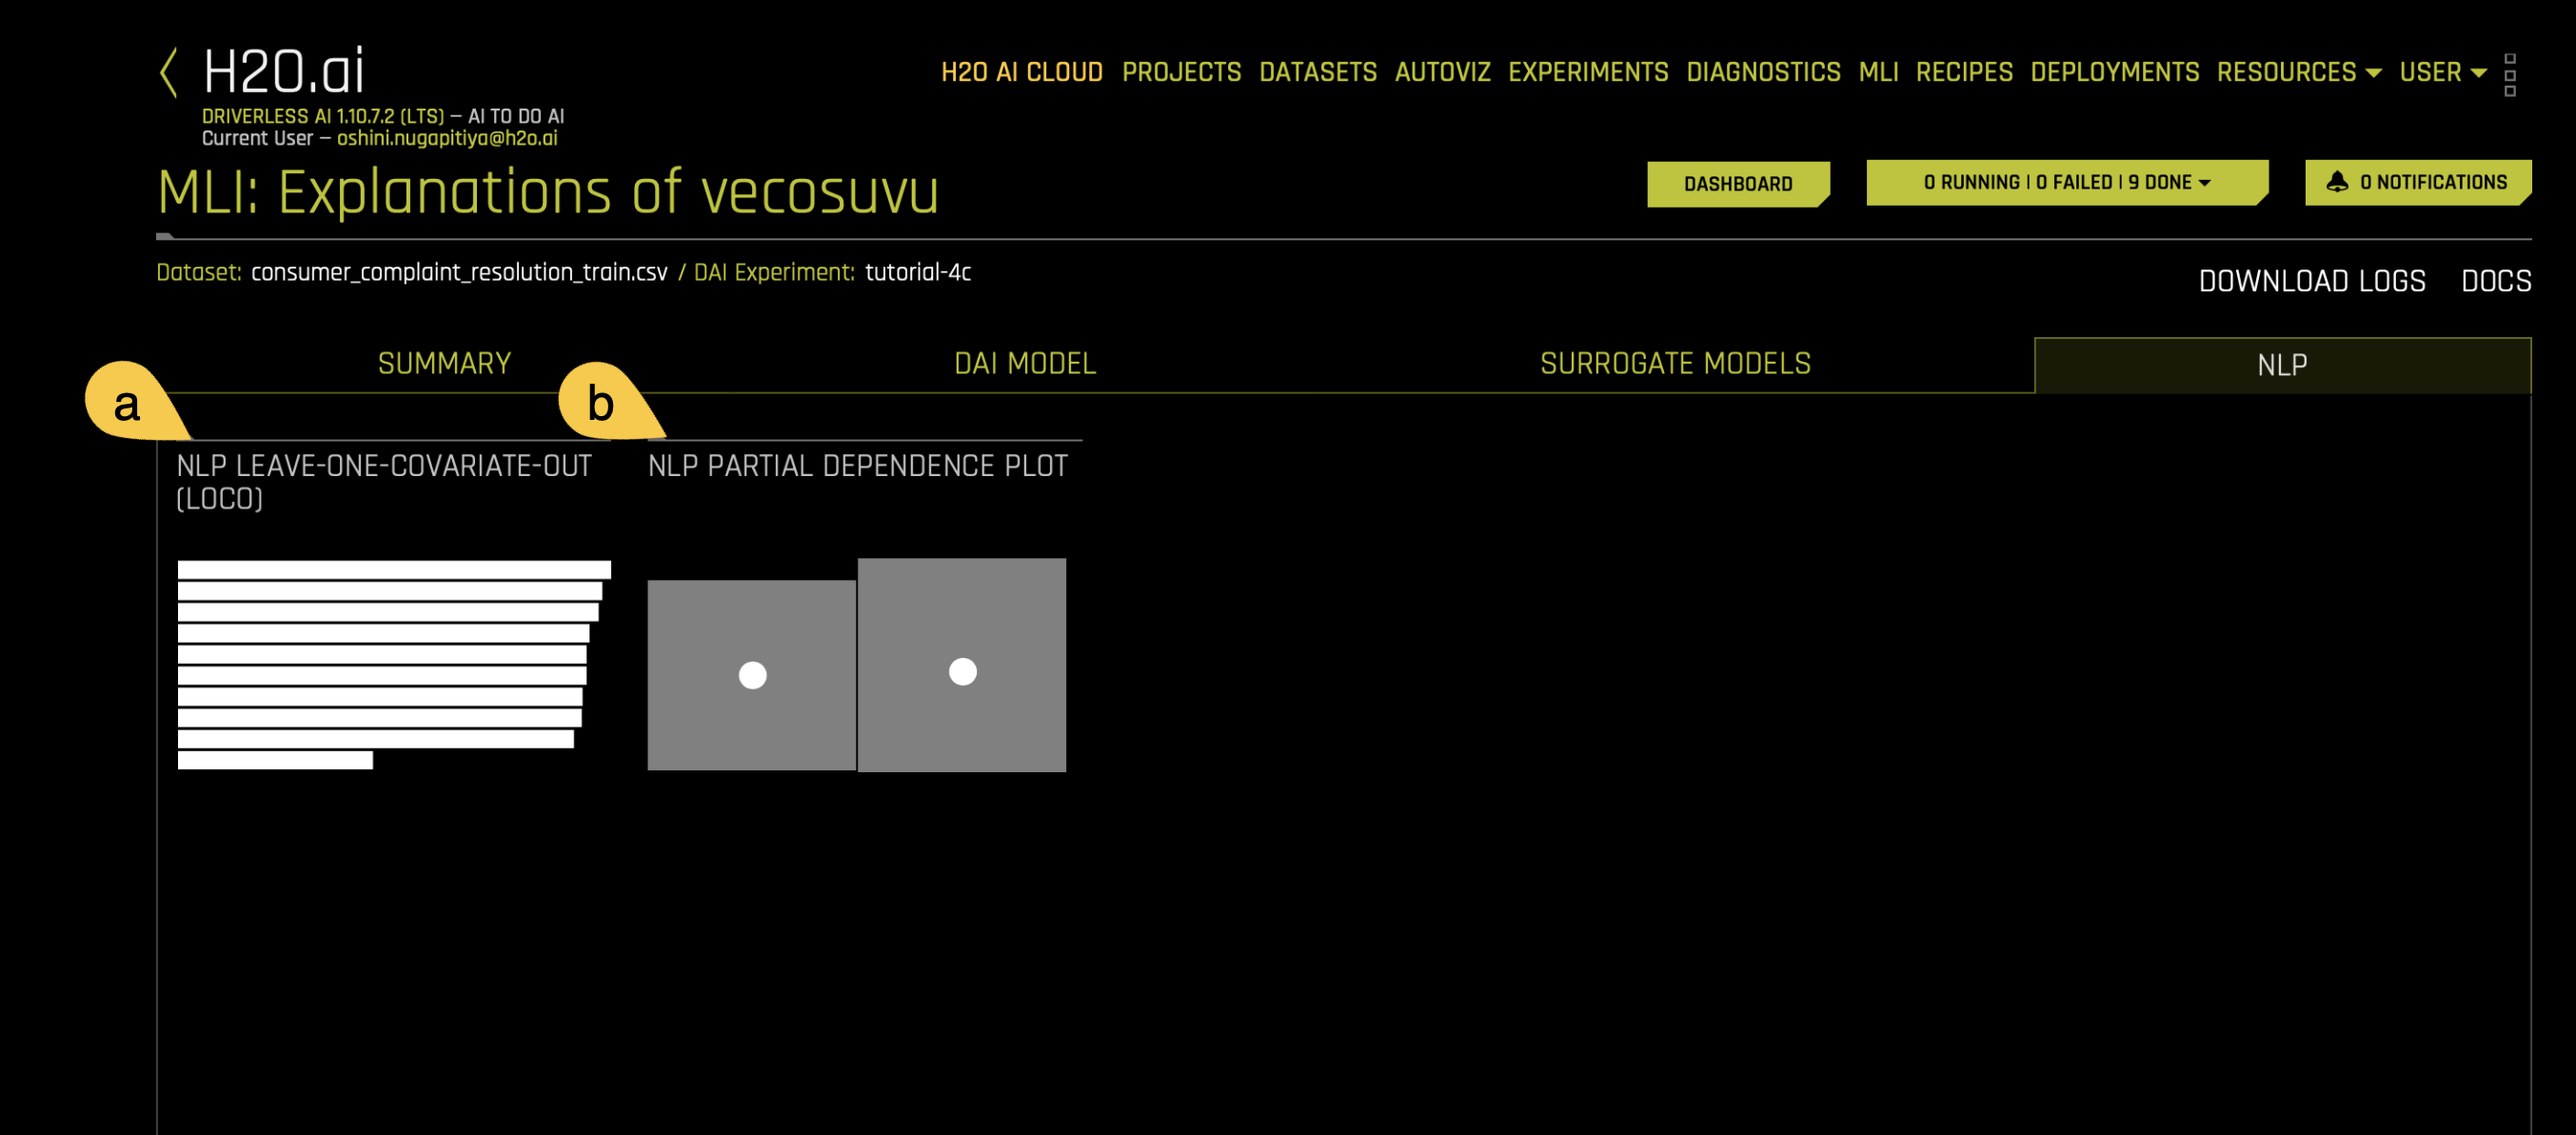
a. NLP Leave-One-Covariate-Out (LOCO)
The NLP Leave-One-Covariate-Out (LOCO) plot in H2O Driverless AI helps you understand how individual words (tokens) in your text data influence the predictions of your natural language processing (NLP) model. By systematically removing each token from the text and observing the change in the model's prediction, this plot highlights the importance of specific words in the decision-making process.
- The model identifies tokens (words or phrases) in your text data using a method called Term Frequency-Inverse Document Frequency (TF-IDF), which measures how important a word is in the context of the dataset.
- Each token is individually removed from the text in a specific column. If a token appears in multiple columns, the removal is performed separately for each column, acknowledging that the token's significance may vary across different contexts.
- The model's prediction is recalculated without the token, and the difference between this new prediction and the original prediction (with the token included) is measured. A significant change indicates that the token has a substantial impact on the model's prediction.
The plot displays the overall importance of tokens across the entire dataset, highlighting which words most influence the model's predictions.
By specifying a row number, you can see how each token affects the prediction for that particular instance. Tokens are highlighted based on their importance, allowing you to understand the model's decision on a case-by-case basis.
b. NLP Partial Dependence Plot
This plot is available for binomial, multiclass, and regression natural language processing (NLP) models. It is located in the NLP tab on the Model Interpretation page, which is only visible for NLP models.
NLP partial dependence (yellow) portrays the average prediction behavior of the Driverless AI model when an input text token is left in its respective text and not included in its respective text along with +/- 1 standard deviation bands. ICE (grey) displays the prediction behavior for an individual row of data when an input text token is left in its respective text and not included in its respective text. The text tokens are generated from TF-IDF.
- For detailed information about the plots in the DAI model tab, see Task 6 in Tutorial 4A.
- For detailed information about the plots in the Surrogate models tab, see Task 6 in Tutorial 4A.
Now that you’ve learned how to interpret the model using the generated MLI report, in Task 8, you’ll learn how to deploy the generated NLP model with H2O MLOps.
- Submit and view feedback for this page
- Send feedback about H2O Driverless AI | Tutorials to cloud-feedback@h2o.ai