Experiments
Overview
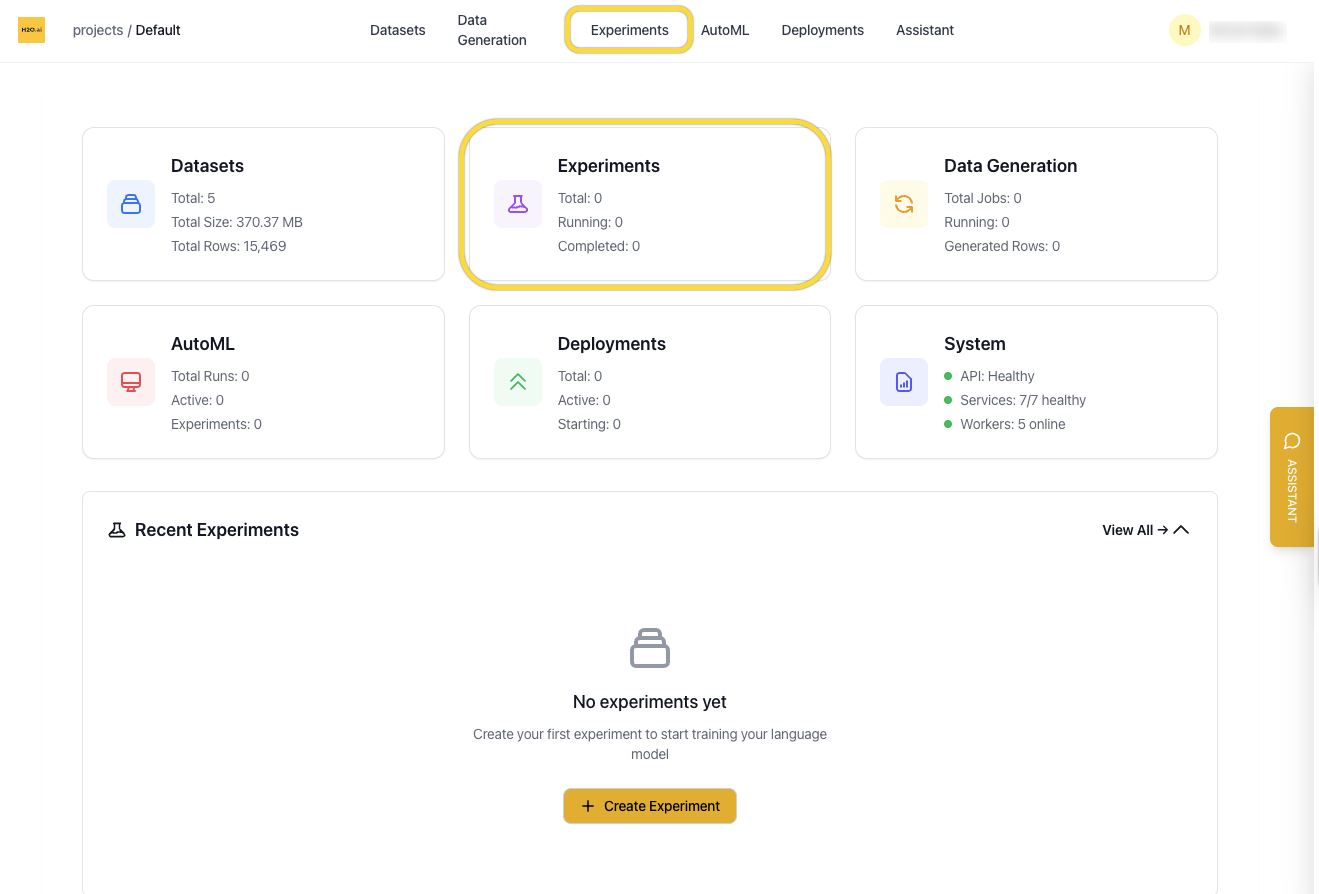
The Experiments page shows all fine-tuning jobs in your current project. From here you can view experiment status, monitor training metrics, and create new experiments from scratch or based on previous runs.
You can access the Experiments page from:
- The homepage card
- The top navigation bar
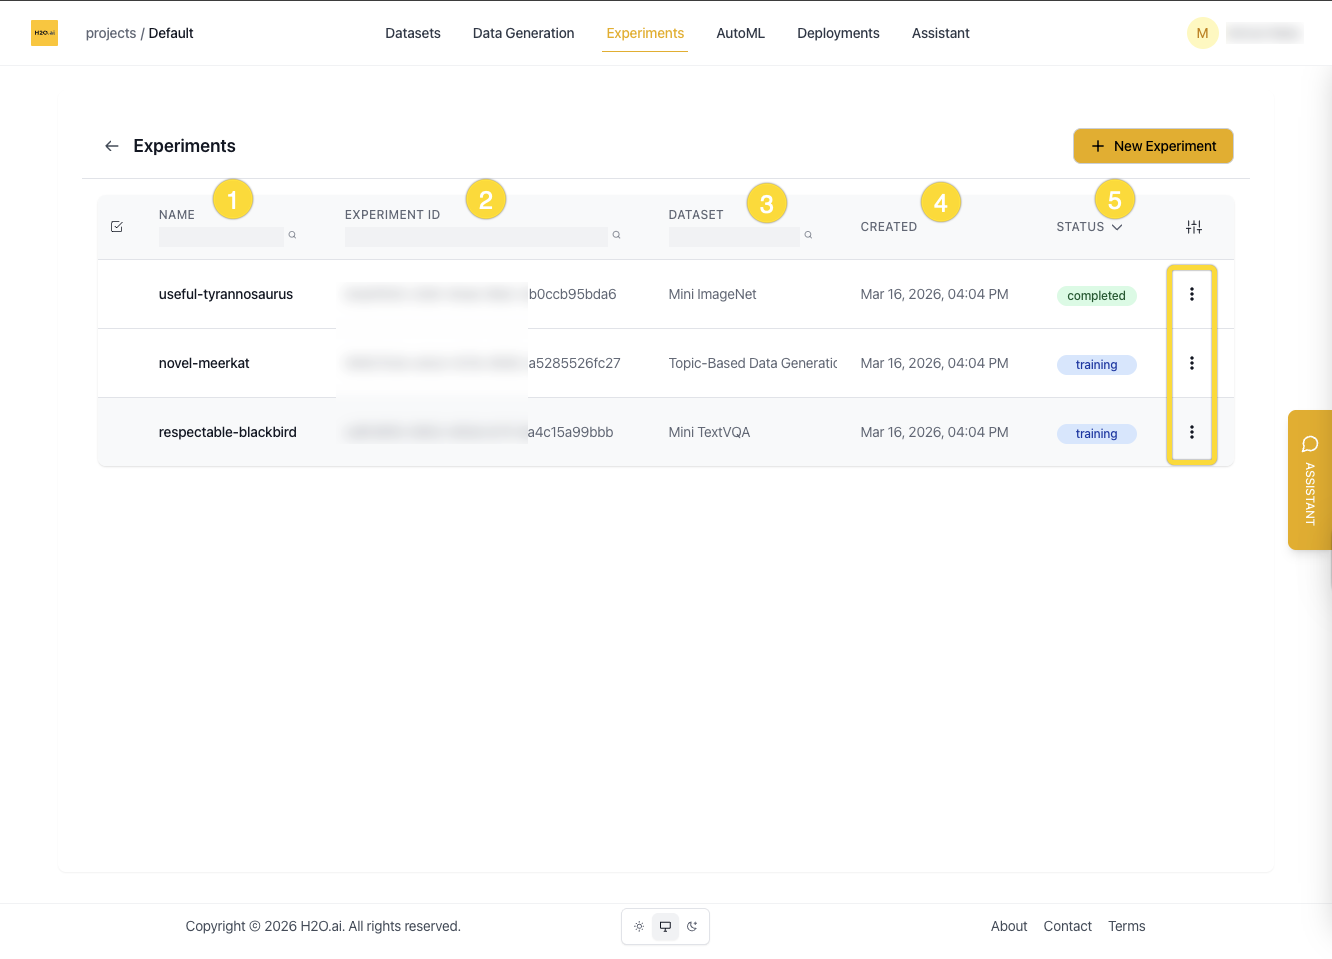
Experiment List View
Each row in the experiment list displays:
- Name
- Experiment ID
- Associated dataset
- Created date
- Status (
Queued,Starting,Training,Completed)
Columns can be shown or hidden using the column toggle button at the top right.
You can:
- Search by name, dataset, or ID
- Sort by status or date created
- Enter edit mode to select and delete multiple experiments
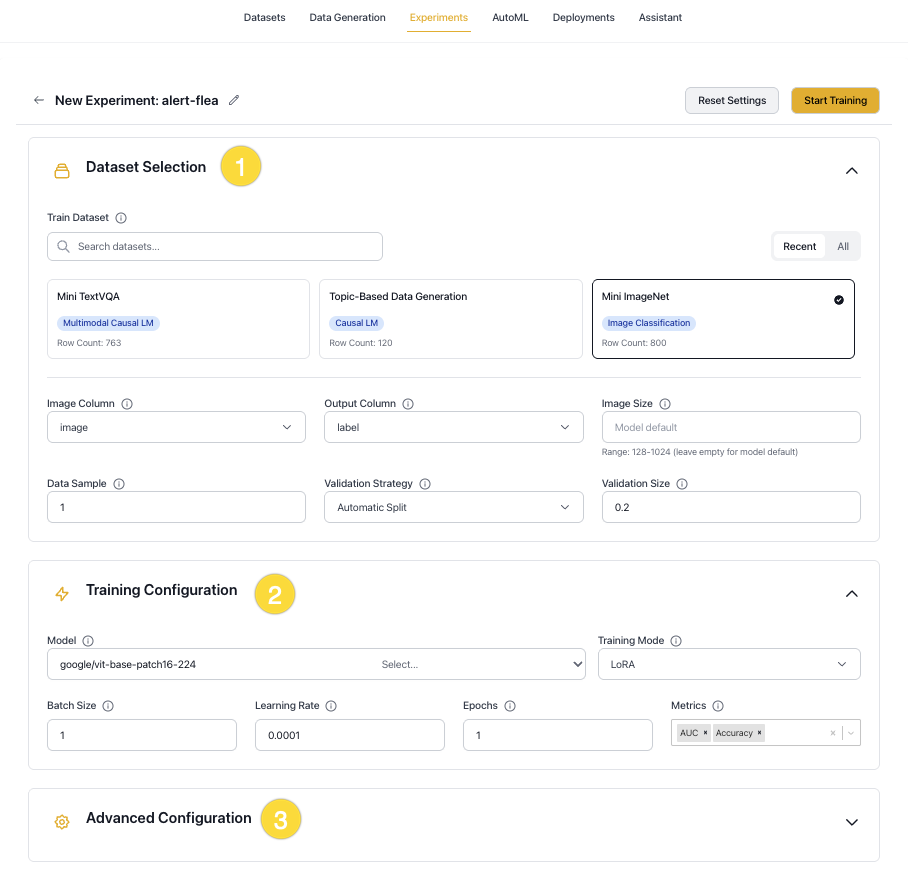
Create a New Experiment
Click New Experiment on the Experiments page to start a new training run. You can also create an experiment from a Dataset page.
The dialog box shows the most commonly used settings. Some options appear only after a specific selection — for example, LoRA adapter settings are shown only when Training Mode is set to lora or qlora. Settings not visible in the dialog box, such as tokenizer, architecture, environment, and inference parameters, can be configured in the Advanced Configuration YAML editor at the bottom of the dialog box.
Configure your experiment using the sections below:
Experiment Details
Experiment name
A label for this training run. If left blank, a name is autogenerated. Use a descriptive name to make the experiment easy to identify in the list.
YAML key: experiment_name
Problem type
Determines the model head, loss function, and evaluation metrics, and controls which dataset columns are used.
YAML key: problem_type
Options:
text_causal_language_modeling(Causal LM): Text generation, completion, and chat. Output is free-form text.text_causal_classification_modeling(Classification LM): Text classification (e.g., sentiment, topic). Output is a class label such as0or1.image_classification(Image Classification): Classifies images into predefined categories.multimodal_causal_language_modeling(Multimodal): Image-and-text tasks such as visual QA and OCR.object_detection(Object Detection): Detects and localizes objects in images using bounding boxes. Experimental.
The following controls are available at the top of the dialog box:
- Reset Settings: Clears the current configuration and restores all fields to their defaults.
- Start Training: Submits the experiment and begins training.
Dataset Selection
Train dataset
The dataset to use for training. Select from the available datasets in the current project.
YAML key: dataset.train_dataset_id
Input column
The column containing the input text (the prompt or instruction for the model). Not used for image_classification or object_detection, which use the image column instead.
YAML key: dataset.input_column | Default: input
Output column
The target column containing the expected answer or label. Multiple columns can be specified for multi-part answers that are concatenated. For object_detection, this column must contain bounding box annotations in COCO format (a dictionary with bbox and category fields). Set to null when Unroll conversations is enabled, in which case the assistant turn defines the answer.
YAML key: dataset.output_column | Default: output
Image column
The column containing image data. Only used for image_classification, multimodal_causal_language_modeling, and object_detection.
YAML key: dataset.image_column | Default: image
Max token length
The maximum sequence length after tokenization. Inputs longer than this value are truncated; shorter inputs are padded. Higher values increase memory usage and can slow training, but may improve accuracy on long-context tasks. If the value exceeds the model's max_position_embeddings, it is automatically capped to match.
YAML key: tokenizer.max_length | Default: 512
Data sample
The fraction of the dataset to use. Accepts values between 0 and 1 (e.g., 0.1 uses 10%). Using a smaller fraction speeds up iteration but may reduce model quality. Use 1.0 for final training runs.
YAML key: dataset.data_sample | Default: 1.0
Data sample choice
When Data sample is less than 1.0, controls which splits are downsampled: Train, Validation, or both.
YAML key: dataset.data_sample_choice | Default: [Train, Validation]
Validation strategy
Controls how the validation set is created.
YAML key: dataset.validation_strategy | Default: automatic
Options:
automatic: A validation set is created automatically by splitting a portion of the training data, as specified by Validation size.custom: Use a separate validation dataset. Select it in the validation dataset field.
Validation size
The fraction of training data to reserve for validation when Validation strategy is automatic (e.g., 0.2 = 20%). Ignored when the strategy is custom.
YAML key: dataset.validation_size | Default: 0.2
Number of classes
The number of output classes. If not set, the value is inferred from the dataset automatically. Applies to text_causal_classification_modeling, image_classification, and object_detection.
YAML key: dataset.num_classes | Default: auto-detected
Training Configuration
Model
The pretrained model to use as the starting point for fine-tuning. H2O Enterprise LLM Studio supports popular open-source models, including Meta Llama, Qwen, Google Gemma, Mistral, DeepSeek, and H2O Danube.
| Model Family | Examples | Typical Size Range |
|---|---|---|
| H2O Danube | h2o-danube3-500m-chat, h2o-danube3-4b-chat | 500M - 4B |
| Meta Llama | Llama-3.2-1B-Instruct, Llama-3.2-3B-Instruct | 1B - 70B+ |
| Qwen | Qwen3-0.6B, Qwen3-1.7B, Qwen3-4B, Qwen3-8B | 0.6B - 32B |
| Google Gemma | gemma-2-2b-it, gemma-2-9b-it | 2B - 27B |
| DeepSeek | DeepSeek-R1-Distill-Qwen-1.5B, DeepSeek-R1-Distill-Llama-8B | 1.5B - 8B |
| Mistral | Mistral-7B-Instruct-v0.3 | 7B+ |
The models available in your deployment depend on which models have been registered by your administrator. Contact your admin to request additional models.
The transformers class used to load the model is selected automatically based on the problem type:
AutoModelForCausalLMfortext_causal_language_modelingAutoModelForSequenceClassificationfortext_causal_classification_modelingAutoModelForImageClassificationforimage_classificationAutoModelForImageTextToTextformultimodal_causal_language_modelingAutoModelForObjectDetectionforobject_detection
YAML key: llm_backbone | Default: h2oai/h2o-danube3-500m-chat
Training mode
Controls how model weights are updated during training.
YAML key: architecture.training_mode | Default: lora
Options:
lora(LoRA): Adds trainable low-rank matrices to the model weights. Fastest option with a small memory footprint.qlora(QLoRA): Quantized variant of LoRA. Uses the least GPU memory.full(Full fine-tuning): Updates all model weights. Requires the most memory and compute.
Batch size
Number of training samples processed per step per GPU. Larger batches improve throughput but require more GPU memory.
YAML key: training.batch_size | Default: 1
Learning rate
Controls the size of weight updates at each optimizer step. A value that is too high can cause instability; too low a value slows convergence. If unsure, use AutoML to find a good starting value.
YAML key: training.learning_rate | Default: 0.0001
Epochs
Number of full passes through the training dataset. More epochs can improve fit but may cause overfitting. Tune in combination with learning rate and validation metrics.
YAML key: training.epochs | Default: 1
Metrics
Evaluation metrics computed on the validation set during training. You can select multiple metrics per experiment.
YAML key: prediction.metrics
Available metrics by problem type:
- Causal LM:
Perplexity,BLEU,LLM-as-a-Judge,QA_Accuracy - Multimodal:
Perplexity,BLEU,QA_Accuracy - Classification LM:
AUC,Accuracy,LogLoss,MAP@3 - Image Classification:
AUC,Accuracy,LogLoss,MAP@3 - Object Detection:
mAP,mAP@50,mAP@75,mAR
LLM-as-a-Judge settings
These settings appear when LLM-as-a-Judge is selected as a metric. An external LLM scores each model output by comparing it against the reference answer.
LLM judge model
The model used to score outputs.
YAML key: training.llm_judge_model | Default: gpt-5-mini
LLM judge prompt template
The prompt sent to the judge model. Use the placeholders {PROMPT}, {PREDICTED_TEXT}, and {TARGET_TEXT} to inject experiment data.
YAML key: training.llm_judge_prompt_template | Default: built-in H2O evaluation template
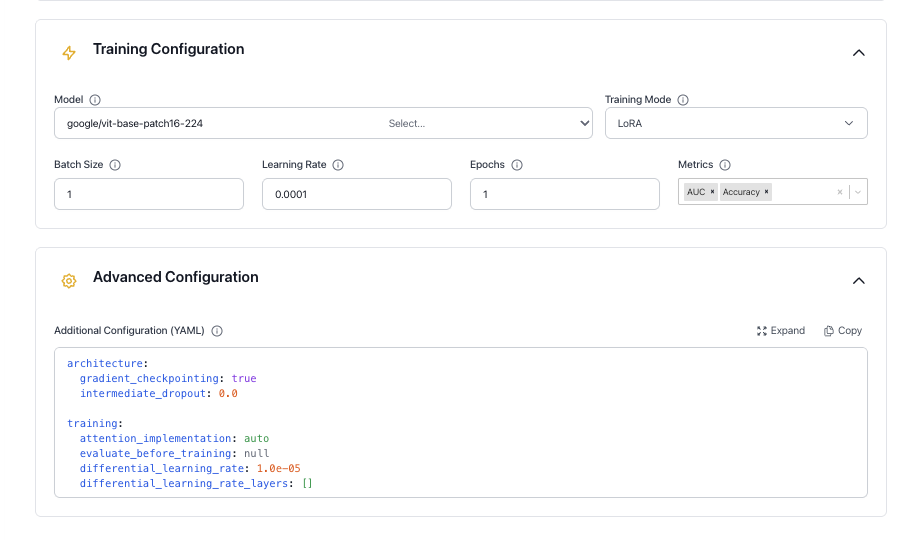
Advanced Configuration
The full schema with defaults is shown below. Only include the keys you want to override — unchanged values can be omitted.
Configuration schema
architecture:
  gradient_checkpointing: true
  intermediate_dropout: 0.0
  backbone_kwargs: "{}"

training:
  attention_implementation: auto
  evaluate_before_training: null
  differential_learning_rate: 1.0e-05
  differential_learning_rate_layers: []
  gradient_clip: 0.0
  weight_decay: 0.0
  warmup_epochs: 0.0
  min_learning_rate_ratio: 0.0
  grad_accumulation: 1
  evaluation_epochs: 0.5
  optimizer: "AdamW"
  schedule: "Cosine"
  train_validation_data: false
  use_length_based_sampler: true
  lora_rank: 4
  lora_alpha: 16
  lora_dropout: 0.05
  lora_target_modules: ""
  loss_function: null
  image_augmentation_pipeline: null
  image_resolution: null
  use_mixup: false
  use_cutmix: false

prediction:
  batch_size_inference: 0
  max_length_inference: 128
  min_length_inference: 2
  num_beams: 1
  repetition_penalty: 1.0
  temperature: 0.0
  top_k: 0
  top_p: 1.0

tokenizer:
  padding_quantile: 1.0
  tokenizer_kwargs: '{"use_fast": true, "add_prefix_space": false}'
  chat_template: null
  padding_side: null

dataset:
  system_column: null
  unroll_conversations: false

environment:
  find_unused_parameters: false
  mixed_precision: true
  trust_remote_code: false
  use_fsdp: false
  use_fsdp_cpu_offload: false
  seed: -1
  huggingface_branch: "main"
Architecture
Controls memory and regularization behavior for the model backbone.
Gradient checkpointing
When enabled, intermediate activations are recomputed on the backward pass rather than stored. This reduces peak GPU memory usage at the cost of slightly slower training.
YAML key: architecture.gradient_checkpointing | Default: true
Intermediate dropout
Dropout probability applied to intermediate layers to reduce overfitting.
YAML key: architecture.intermediate_dropout | Default: 0.0
Backbone kwargs
Additional keyword arguments passed as a JSON string to transformers.AutoConfig.from_pretrained() when the model backbone is loaded. Useful for overriding model-specific settings not exposed elsewhere.
YAML key: architecture.backbone_kwargs | Default: "{}"
Training
Full reference for training hyperparameters and adapter settings. The core controls — batch size, learning rate, and epochs — are also available in the Training Configuration section.
Attention implementation
The attention backend used during training. When set to auto, the best available implementation is selected for the model (for example, Flash Attention 2 when supported).
YAML key: training.attention_implementation | Default: auto
Evaluate before training
When true, the model is evaluated on the validation set before training starts. Defaults to false for text_causal_language_modeling, multimodal_causal_language_modeling, and object_detection, and true for text_causal_classification_modeling and image_classification.
YAML key: training.evaluate_before_training | Default: auto
Differential learning rate
A separate learning rate applied to the layers listed in differential_learning_rate_layers. Useful for fine-tuning specific parts of the model at a different rate.
YAML key: training.differential_learning_rate | Default: 1.0e-05
Differential learning rate layers
Comma-separated layer names to apply the differential learning rate to. When empty, the differential learning rate is not used and all layers train at the base rate.
YAML key: training.differential_learning_rate_layers | Default: []
Gradient clip
Maximum gradient norm. Gradients exceeding this value are rescaled to prevent training instability. Set to 0 to disable clipping.
YAML key: training.gradient_clip | Default: 0.0
Weight decay
L2 regularization coefficient. Adds a penalty for large weights to help reduce overfitting.
YAML key: training.weight_decay | Default: 0.0
Warmup epochs
Number of epochs over which the learning rate ramps linearly from 0 to the base rate at the start of training. A small value such as 0.05 is typical.
YAML key: training.warmup_epochs | Default: 0.0
Minimum learning rate ratio
The floor of the learning rate schedule, expressed as a fraction of the base learning rate. For example, 0.1 means the rate decays no lower than 10% of the starting value.
YAML key: training.min_learning_rate_ratio | Default: 0.0
Gradient accumulation
Number of forward passes before a weight update is applied. Increasing this value simulates a larger batch size without requiring additional GPU memory.
YAML key: training.grad_accumulation | Default: 1
Evaluation epochs
How often the model is evaluated on the validation set, measured in epochs. Values below 1.0 trigger evaluation within an epoch (e.g., 0.5 evaluates twice per epoch).
YAML key: training.evaluation_epochs | Default: 0.5
Optimizer
The optimization algorithm used for training.
YAML key: training.optimizer | Default: AdamW
Schedule
The learning rate schedule applied after warmup.
YAML key: training.schedule | Default: Cosine
Options: Cosine, Linear, Constant
Train on validation data
When enabled, the validation set is merged into the training set before training starts. This disables validation loss monitoring and should only be used for final production runs.
YAML key: training.train_validation_data | Default: false
Use length-based sampler
When enabled, training batches are assembled by grouping sequences of similar length. This reduces padding overhead and balances workload across GPUs.
YAML key: training.use_length_based_sampler | Default: true
LoRA rank
The inner dimension of the low-rank adapter matrices. Higher values give the adapter more capacity but increase memory usage. Only applies when Training mode is lora or qlora.
YAML key: training.lora_rank | Default: 4
LoRA alpha
Scaling factor for the LoRA update. Higher values increase the influence of the adapter on the model output relative to the original weights.
YAML key: training.lora_alpha | Default: 16
LoRA dropout
Dropout probability applied to LoRA layers to reduce overfitting.
YAML key: training.lora_dropout | Default: 0.05
LoRA target modules
Comma-separated list of layer names to inject LoRA into. When empty, all eligible linear layers (excluding the head and score layers) are targeted.
YAML key: training.lora_target_modules | Default: "" (all eligible linear layers)
Loss function
Overrides the default loss function for the problem type. When null, the default loss is used.
YAML key: training.loss_function | Default: null
Image augmentation pipeline
The augmentation level applied to training images. Only applies to image_classification. Resize and normalization from the model's image processor are always applied regardless of this setting.
YAML key: training.image_augmentation_pipeline | Default: null
Options:
null: No augmentation beyond the model's default preprocessing.low: Horizontal flip only.medium: Flip, affine transform, and random erasing.high: Random resized crop, flip, affine transform, color jitter, and random erasing.
Image resolution
Override the input image resolution used during training. When set, images are resized to this value (in pixels) before being passed to the model. When null, the model's default resolution from its image processor is used. Only applies to image_classification.
YAML key: training.image_resolution | Default: null
Use mixup
When enabled, pairs of training images and their labels are linearly blended during training. Only applies to image_classification.
YAML key: training.use_mixup | Default: false
Use CutMix
When enabled, a rectangular region from one training image is replaced with a patch from another, and their labels are mixed proportionally. Only applies to image_classification.
YAML key: training.use_cutmix | Default: false
Prediction
Generation parameters used during validation and inference. Applies to text_causal_language_modeling and multimodal_causal_language_modeling.
Inference batch size
Batch size used during inference and validation. Set to 0 to use the same value as the training batch size.
YAML key: prediction.batch_size_inference | Default: 0
Max generation length
Maximum number of tokens the model generates per output.
YAML key: prediction.max_length_inference | Default: 128
Min generation length
Minimum number of tokens the model must generate before an end-of-sequence token is allowed.
YAML key: prediction.min_length_inference | Default: 2
Number of beams
Number of beams used in beam search. Set to 1 to use greedy or sampling-based decoding instead.
YAML key: prediction.num_beams | Default: 1
Repetition penalty
Reduces the probability of tokens that have already appeared in the output. A value of 1.0 applies no penalty. Values above 1.0 discourage repetition; values below 1.0 encourage it.
YAML key: prediction.repetition_penalty | Default: 1.0
Temperature
Controls randomness during sampling. Higher values produce more varied outputs; lower values produce more deterministic outputs. Set to 0.0 for greedy decoding (no sampling).
YAML key: prediction.temperature | Default: 0.0
Top-K
At each generation step, sampling is restricted to the k most probable tokens. Only active when temperature is greater than 0. Set to 0 to disable.
YAML key: prediction.top_k | Default: 0
Top-P
Nucleus sampling threshold. Sampling is restricted to the smallest set of tokens whose cumulative probability meets or exceeds this value. Set to 1.0 to disable. Only active when temperature is greater than 0.
YAML key: prediction.top_p | Default: 1.0
Tokenizer
Controls text tokenization before input is passed to the model. The defaults work well for most use cases.
Padding quantile
Sets the target padding length for a batch as a quantile of the sequence lengths in that batch. For example, 0.9 pads to the 90th-percentile length, reducing memory wasted on outlier-length sequences. Set to 1.0 to pad to the longest sequence in the batch. Set to 0.0 to disable dynamic padding.
YAML key: tokenizer.padding_quantile | Default: 1.0
Tokenizer kwargs
Additional keyword arguments passed as a JSON string to transformers.AutoTokenizer when the tokenizer is initialized.
YAML key: tokenizer.tokenizer_kwargs | Default: {"use_fast": true, "add_prefix_space": false}
Chat template
The Jinja2 template used to format conversation turns for generation problem types (text_causal_language_modeling, multimodal_causal_language_modeling). Set to "model" to use the model's built-in template from Hugging Face Hub. Provide a custom Jinja2 string to override the template entirely. Leave as null to use the H2O default template.
YAML key: tokenizer.chat_template | Default: H2O default template
Padding side
The side on which padding tokens are added. Auto-configured per problem type: left for text_causal_language_modeling and multimodal_causal_language_modeling, and right for text_causal_classification_modeling and image_classification.
YAML key: tokenizer.padding_side | Default: auto
Dataset
Additional dataset settings configurable only via YAML. For all other dataset fields, see Dataset Selection.
System column
The column containing the system prompt. If not set, no system prompt is applied. Only used for text_causal_language_modeling.
YAML key: dataset.system_column | Default: null
Unroll conversations
When enabled, multi-turn conversation datasets are split into individual training samples, each containing a system prompt, a user turn, and an assistant answer. Only applies to text_causal_language_modeling.
YAML key: dataset.unroll_conversations | Default: false
Environment
Controls distributed training, hardware, and runtime settings.
Find unused parameters
DDP flag that restricts backpropagation to parameters used in the forward pass. Automatically disabled when gradient checkpointing is on, as the two settings are incompatible.
YAML key: environment.find_unused_parameters | Default: false
Mixed precision
When enabled, training uses Automatic Mixed Precision (AMP), which reduces GPU memory usage and increases throughput on NVIDIA Ampere and later hardware.
YAML key: environment.mixed_precision | Default: true
Trust remote code
When enabled, custom model code hosted on the Hugging Face Hub is executed locally. Only enable this for repositories you trust.
YAML key: environment.trust_remote_code | Default: false
Use FSDP
When enabled, training uses Fully Sharded Data Parallel (FSDP), which shards model parameters, gradients, and optimizer state across GPUs to reduce per-device memory usage. Currently experimental for vision models.
YAML key: environment.use_fsdp | Default: false
Use FSDP CPU offload
When enabled, FSDP parameters and optimizer state are offloaded to CPU memory to further reduce GPU memory pressure. Requires use_fsdp to be enabled.
YAML key: environment.use_fsdp_cpu_offload | Default: false
Seed
Random seed for NumPy, Python's random module, PyTorch, and CUDA. Set to -1 to pick a random seed on each run. Set to a non-negative integer for reproducible results.
YAML key: environment.seed | Default: -1
Hugging Face branch
The branch, tag, or commit SHA of the Hugging Face model repository to download from. Change this when you need a specific revision of a model.
YAML key: environment.huggingface_branch | Default: "main"
Object Detection (Experimental)
Object detection is an experimental feature and may have performance or functionality limitations compared to other problem types. See Known limitations below.
Object detection trains models to identify and locate objects in images using bounding boxes. This problem type uses DETR (DEtection TRansformer) architecture.
Dataset format
Your dataset must include:
- Image column: A column containing image data (base64-encoded or binary).
- Annotation column: A column containing per-image object annotations in COCO format.
Each annotation must be a dictionary (or JSON string) with the following fields:
{
  "bbox": [[x, y, width, height], [x, y, width, height], ...],
  "category": [0, 1, 2, ...]
}
bbox: Bounding boxes in COCO format —[x, y, width, height], wherexandyare the top-left corner coordinates.category: 0-indexed category IDs corresponding to each bounding box.
Example annotation for an image with two objects:
{
  "bbox": [[100, 150, 200, 300], [400, 200, 150, 250]],
  "category": [0, 2]
}
Supported models
Object detection uses DETR-based models from Hugging Face:
facebook/detr-resnet-50(default)facebook/detr-resnet-101- Other DETR variants compatible with
AutoModelForObjectDetection
Metrics
The following metrics are available for object detection and can be selected in the Training Configuration section:
| Metric | Description |
|---|---|
| mAP | Mean Average Precision averaged across all IoU thresholds. |
| mAP@50 | Mean Average Precision at IoU threshold 0.50. |
| mAP@75 | Mean Average Precision at IoU threshold 0.75 (stricter localization). |
| mAR | Mean Average Recall averaged across all IoU thresholds. |
Known limitations
- Deployment: Object detection models cannot be deployed through the standard pipeline. DETR models are not compatible with the vLLM inference engine.
- Model architecture: Only DETR-based architectures are supported. Other architectures such as YOLO and Faster R-CNN are not available.
View an Experiment
Click any row in the experiment list to open the experiment detail view.
Status and resources
The status bar updates in real time as the experiment runs. Stages are:
- Queued
- Starting
- Training / Validation
- Completed
Expand the Resources section to view:
- Number of GPUs used
- Price per GPU-hour
- Total cost
- Runtime duration
Charts
The chart shows training and validation progress over time:
- Training Loss
- Validation Loss
- Validation Perplexity
Loss is plotted on the left axis and perplexity on the right. A healthy run shows both training and validation loss decreasing and converging. A widening gap between the two curves indicates overfitting.
Configuration
The full YAML configuration used to run the experiment.
Connected experiments
Experiments linked to this run through AutoML or Ask KGM are shown here. Experiments created by using Copy from an existing experiment are also linked and shown in this section. If you ran a standalone experiment, only the current experiment is shown.

Training logs
Record of the model's learning progress, including:
- Epoch progress
- Metric values at each evaluation step
- Fine-tuning metadata (e.g., LoRA rank and target modules)
System logs
Runtime infrastructure events, including hardware activity, warnings, and errors that occurred during training.
Experiment Actions
From the top right of the experiment page you can:
- Deploy the trained model (see Deployments)
- Open the action menu (
...) to access:- Push to Hugging Face: Publish the model to Hugging Face Hub (requires your credentials)
- Ask KGM: Get a recommendation for the next experiment from a fine-tuning agent
- Rerun: Re-launch the experiment with identical settings
- Copy: Open a new experiment pre-filled with the settings from this run
- Delete: Permanently remove this experiment
Ask KGM
Ask KGM opens a dialog with a recommended next experiment. KGM stands for Kaggle Grandmaster, a reference to H2O.ai's expert data scientists.
Suggestions may include:
- A different model backbone
- An adjusted learning rate
- Other hyperparameter changes based on your training metrics
Review the explanation and click Proceed to launch the suggested experiment.
- Submit and view feedback for this page
- Send feedback about H2O Enterprise LLM Studio to cloud-feedback@h2o.ai