Tutorial 5: Dataset analysis with Enterprise h2oGPTe agents
Overview
This tutorial explores dataset analysis with Enterprise h2oGPTe agents. In this tutorial, we will ask an Enterprise h2oGPTe-agent the following:
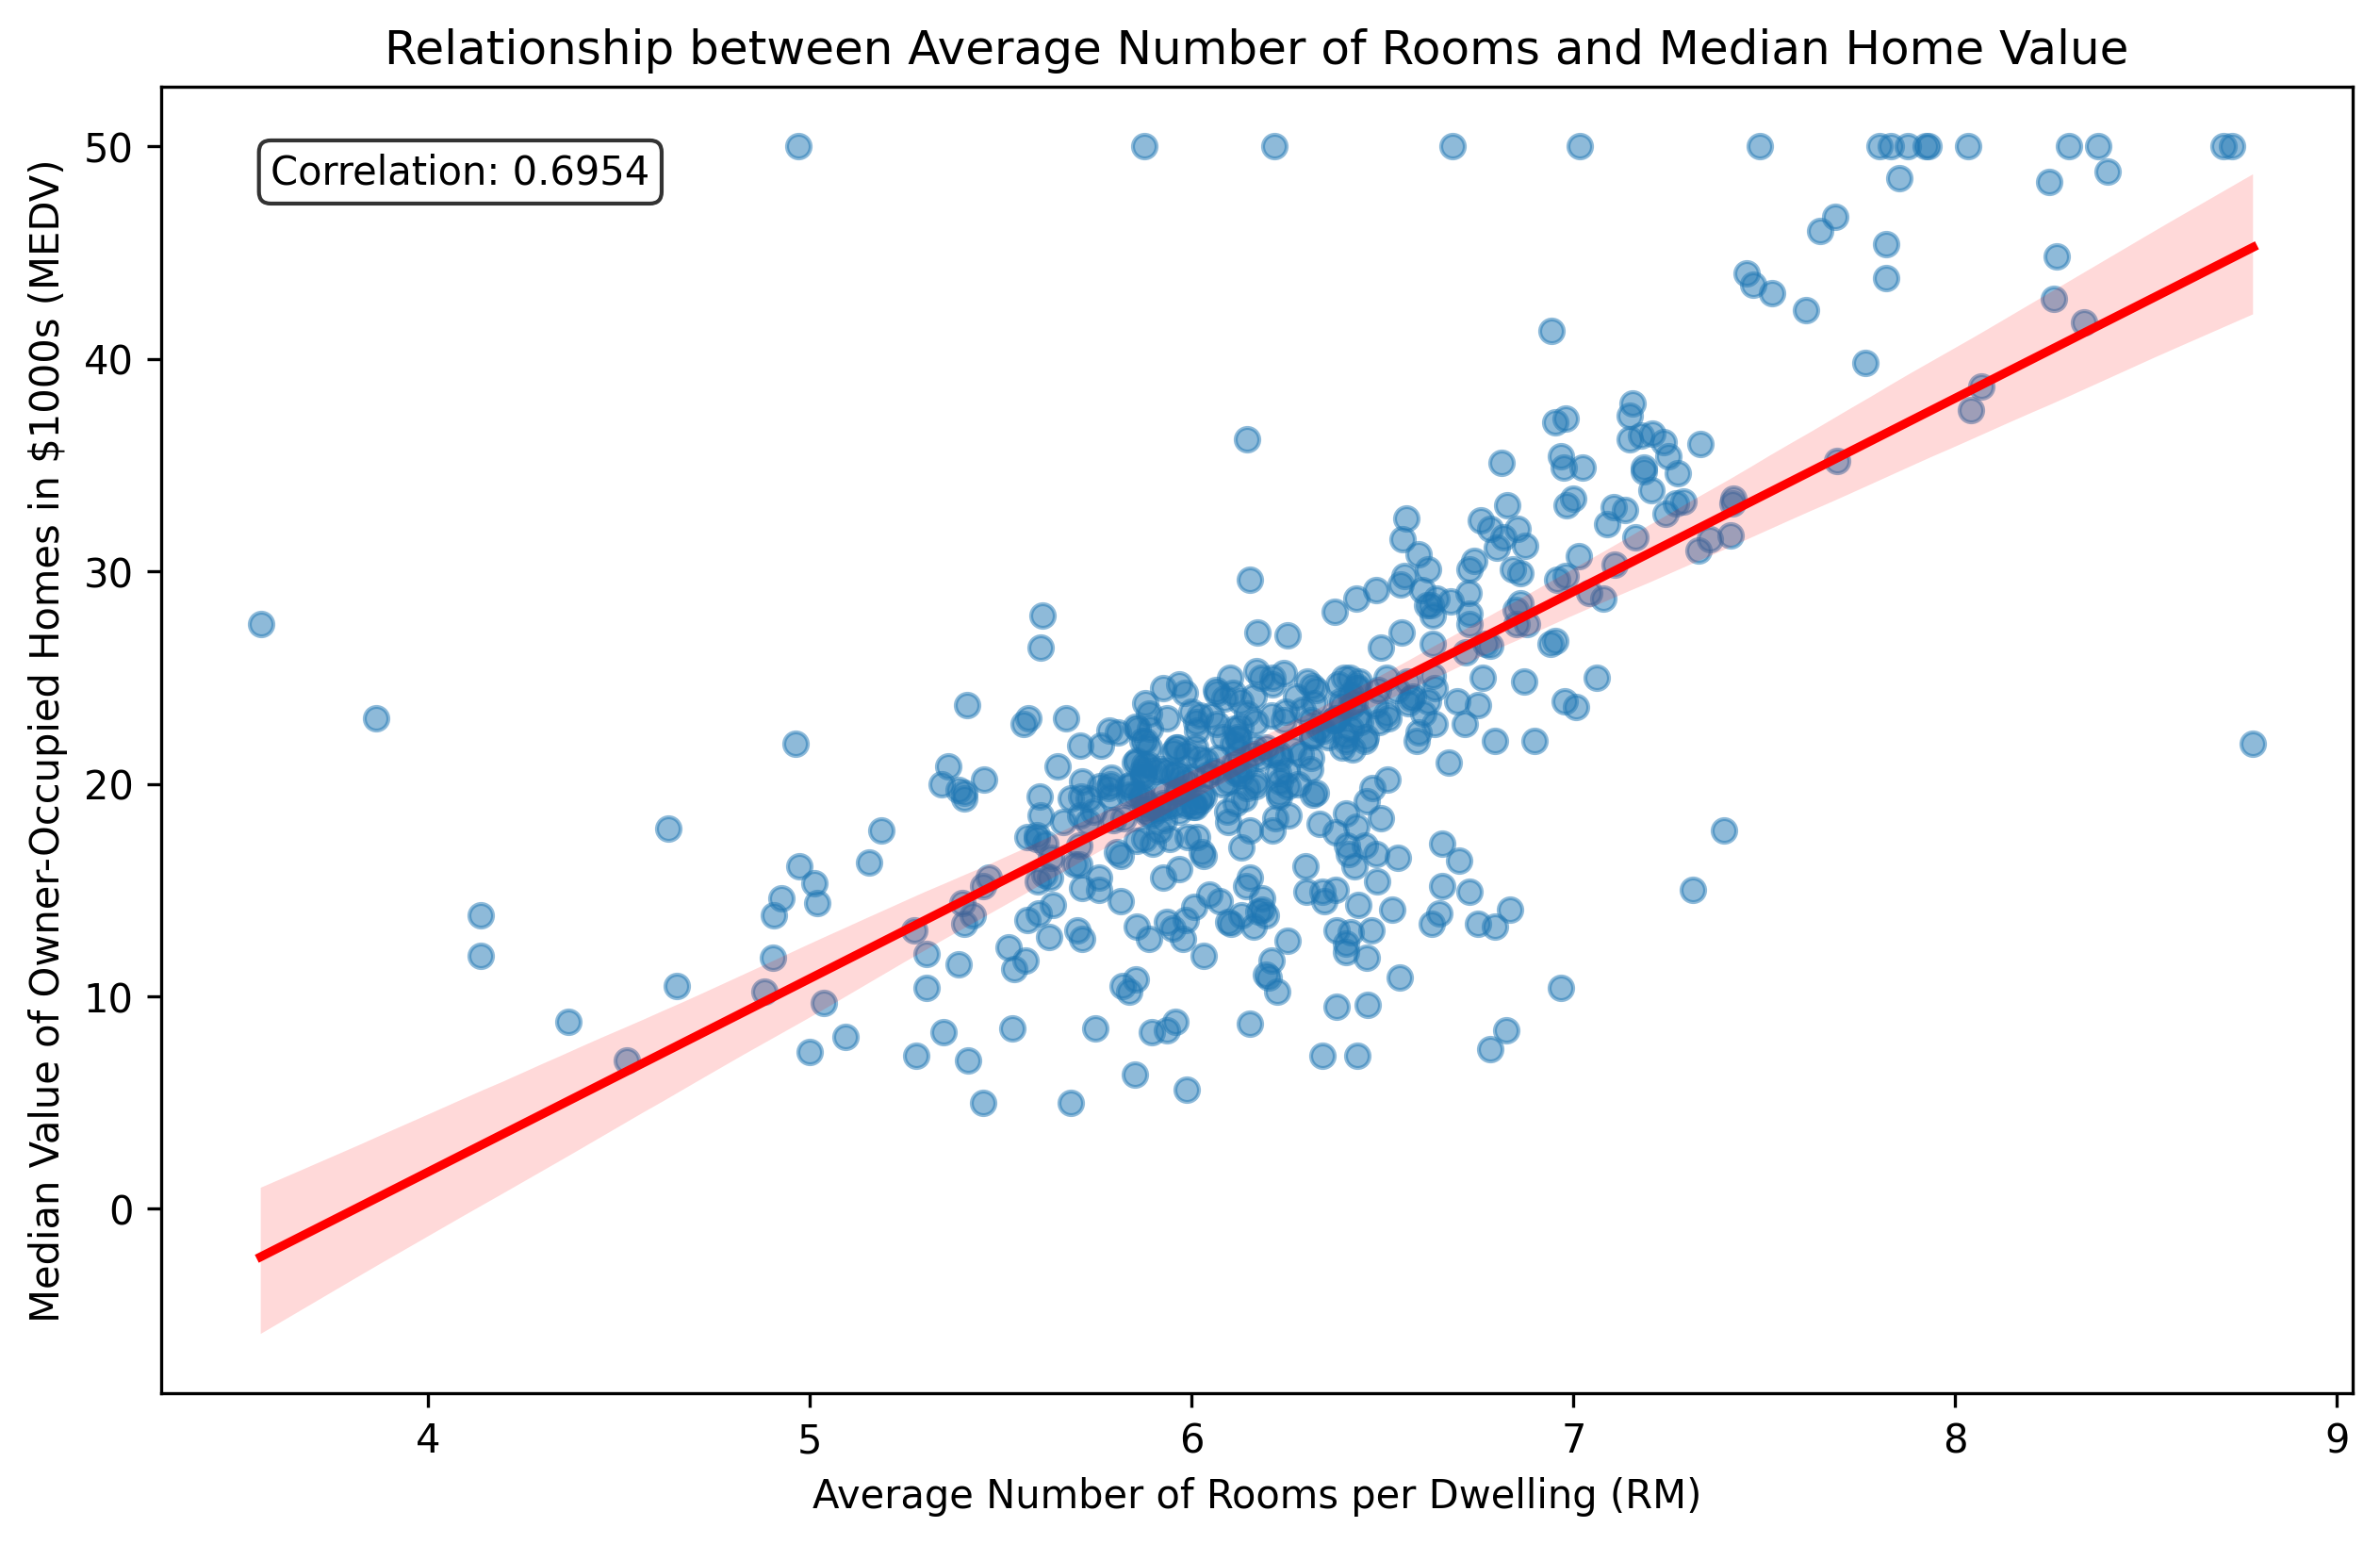
Using the Boston Housing Dataset, calculate the correlation between the RM (average number of rooms per dwelling) and MEDV (median value of owner-occupied homes in $1000s) columns. Next, create a scatter plot with RM on the x-axis and MEDV on the y-axis to visualize their relationship, and add a trend line to illustrate the positive correlation.
The Boston Housing Dataset is a well-known dataset used primarily for practicing regression techniques in machine learning. It contains information about various features of Boston's housing, which can be used to predict housing prices.
Enterprise h2oGPTe agents enhance the functionality and versatility of Enterprise h2oGPTe to execute a broader range of tasks autonomously. In other words, this setting allows the large language model (LLM) to perform actions such as running code, generating plots, searching the web, conducting research, and developing and preparing models.
Objectives
- Dataset analysis: Explore how Enterprise h2oGPTe can help you explore complex datasets with AI auto-generated graphs.
- Understand the role of agents in Enterprise h2oGPTe: Explore the differences between enabling and disabling Enterprise h2oGPTe agents and how this affects the system's capabilities during a user query.
Prerequisites
- (Optional) Review the Traditional Enterprise h2oGPTe workflow
Step 1: Create a new Chat with an agent enabled
- On Enterprise h2oGPTe, click + New chat.
- Click Agent.

Step 2: Enter query
-
In the Ask anything box, enter the following query:
Using the Boston Housing Dataset, calculate the correlation between the RM(average number of rooms per dwelling) and MEDV (median value of owner-occupiedhomes in $1000s) columns. Next, create a scatter plot with RM on the x-axis andMEDV on the y-axis to visualize their relationship, and add a trend line toillustrate the positive correlation.You can access the Boston Housing Dataset here (Kaggle - The Boston HousingDataset: https://www.kaggle.com/code/prasadperera/the-boston-housing-dataset).noteYou do not need to specify the dataset, as Enterprise h2oGPTe agents can search the web for a copy of the dataset.
-
Click Submit.
With the agent enabled, Enterprise h2oGPTe can calculate the correlation using a Python environment and immediately generate a plot showing the relationship between the RM and MEDV columns while adding a trend line to illustrate the positive correlation. Enabling agents in Enterprise h2oGPTe expands the toolkit, allowing you to achieve more practical and interactive results.
When the agent is disabled, Enterprise h2oGPTe provides a text explanation of calculating the correlation using code while unable to perform the calculation or generate a plot directly.
Step 3: Observe results
Your downloadable files might differ from those discussed here.
After a few seconds or minutes, Enterprise h2oGPTe generates a query result, including an explanation for the following graph (PNG image) located in the Downloadable files section:

Summary
This tutorial taught us the differences between enabling and disabling agents in Enterprise h2oGPTe and how this affects the system's capabilities during a user query. Primarily, we learned that Enterprise h2oGPTe can help analyze datasets with AI auto-generated graphs.
- Submit and view feedback for this page
- Send feedback about Enterprise h2oGPTe to cloud-feedback@h2o.ai