Task 4: Experiment results summary
Overview
At the end of the experiment, a project summary will appear in the lower right corner. The experiment name is located in the upper left corner (as shown).
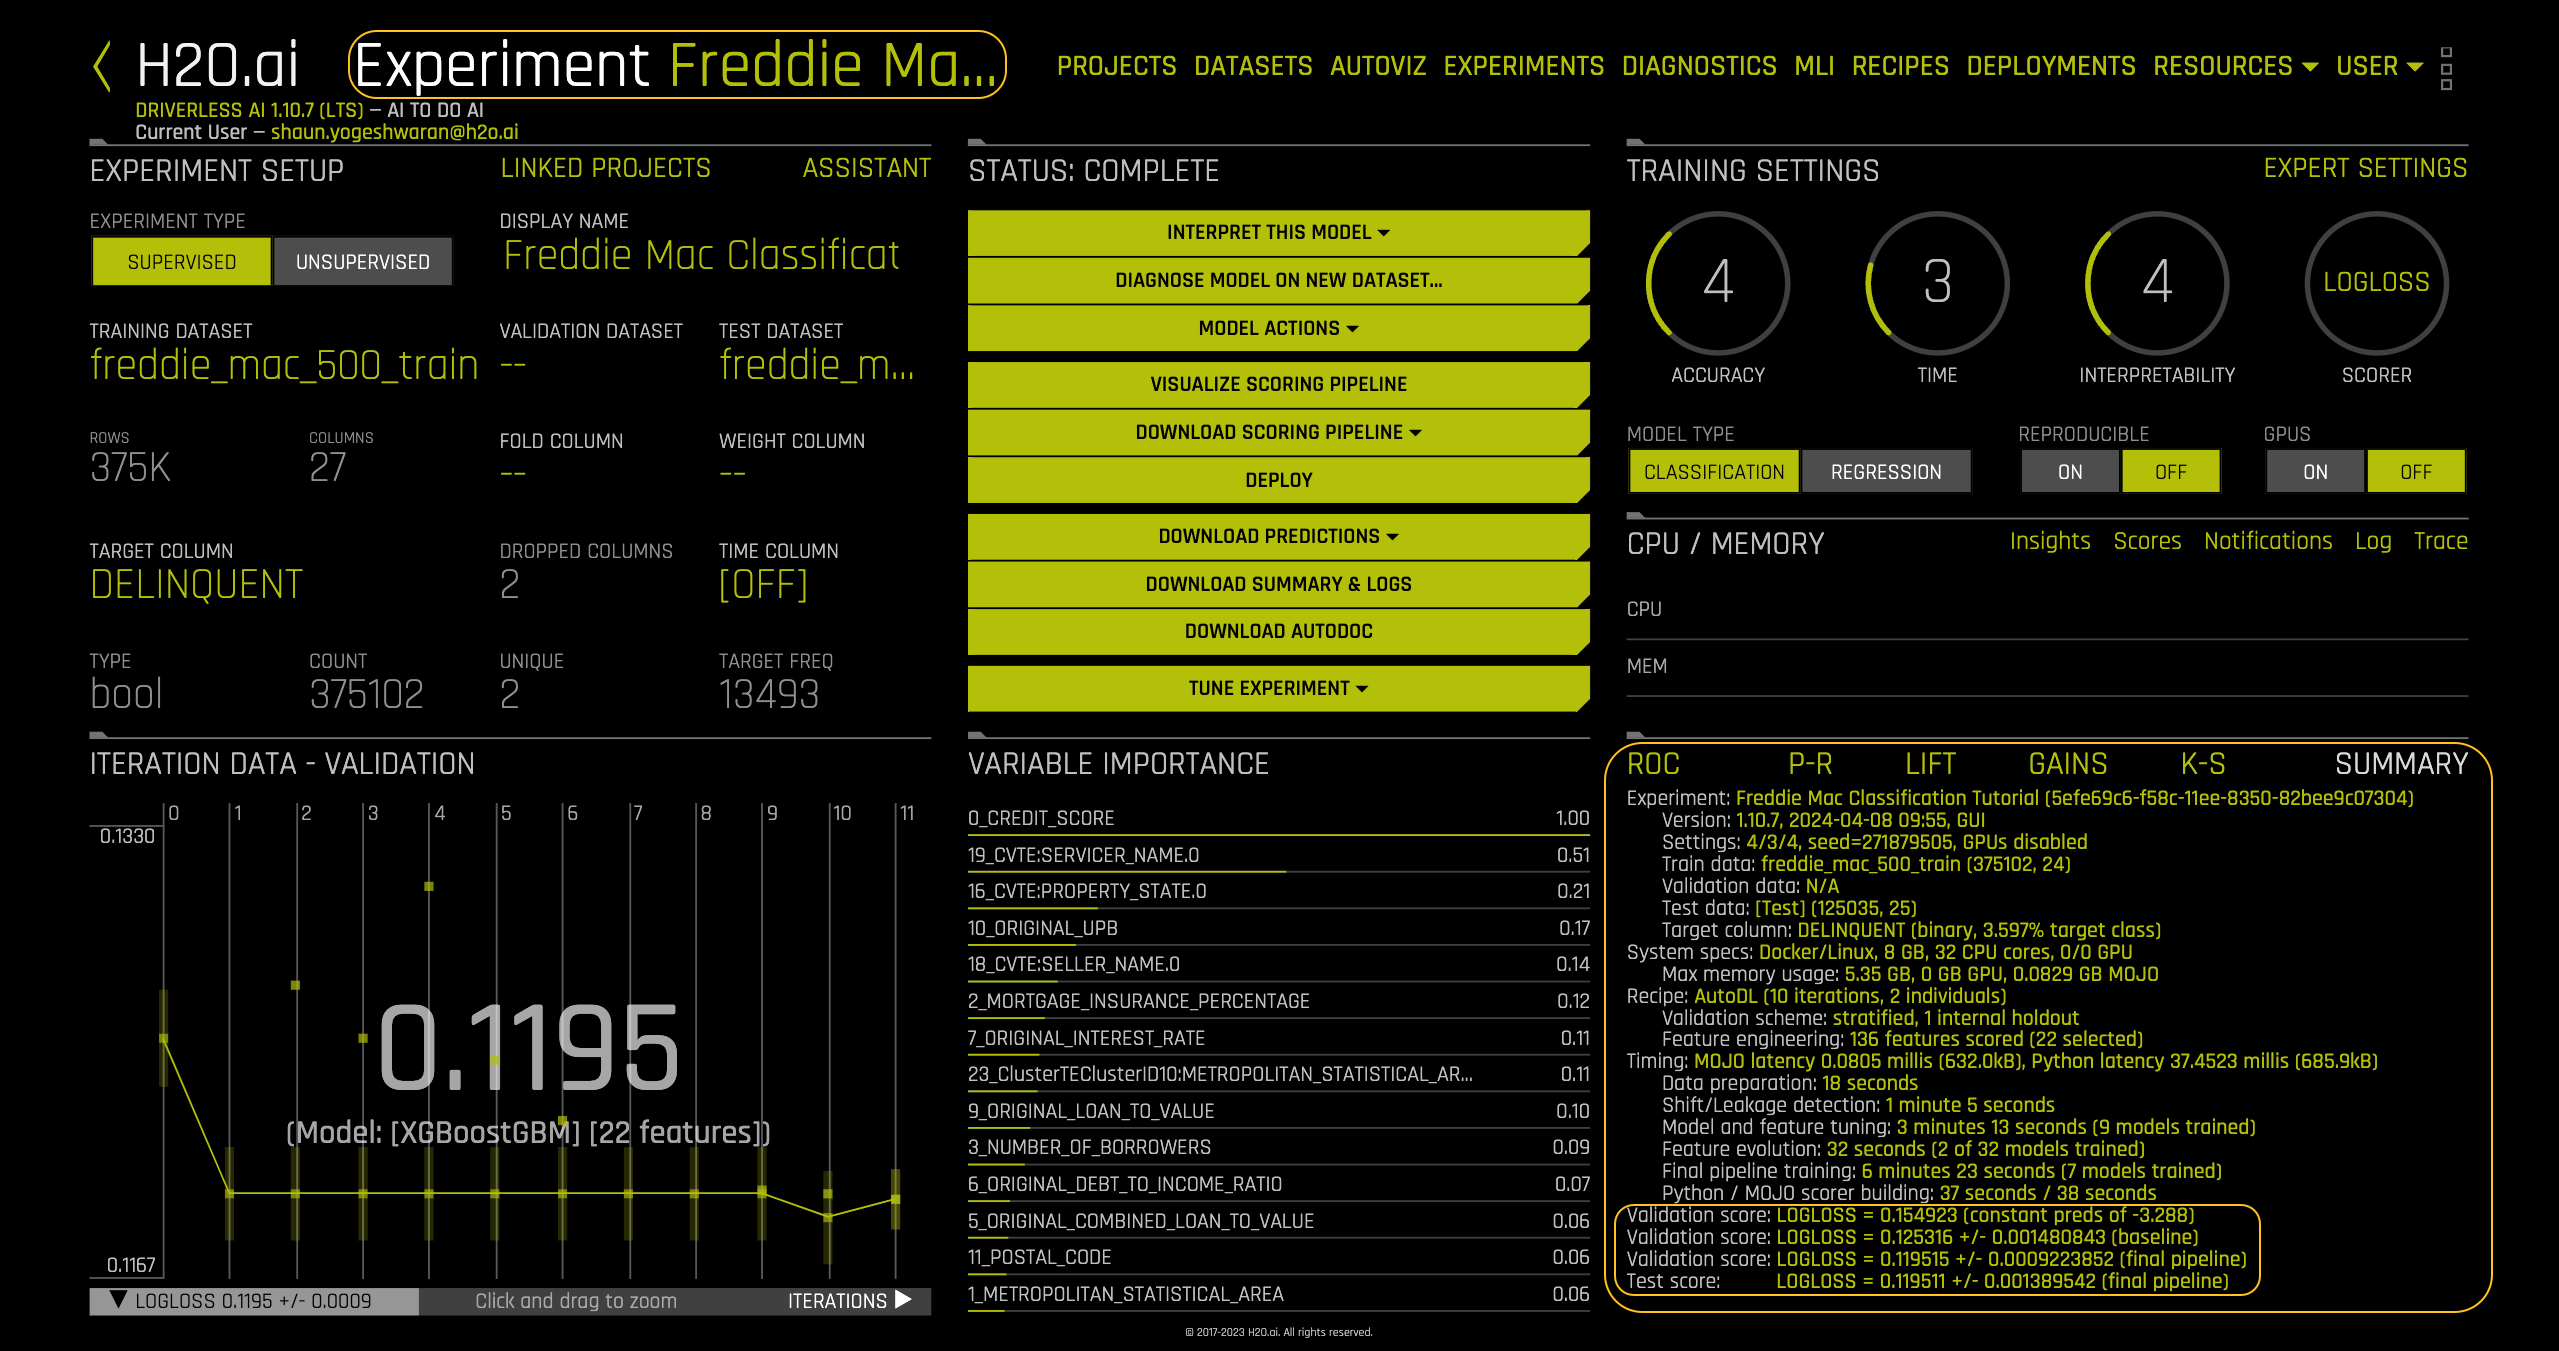
The summary includes the following:
Experiment: Name of the experiment.
- Version: Version of Driverless AI and the date it was launched.
- Settings: The selected training settings, seed, and amount of GPU’s enabled.
- Train data: Name of the training set, number of rows, and columns.
- Validation data: Name of the validation set, number of rows, and columns.
- Test data: Name of the test set, number of rows, and columns.
- Target column: Name of the target column (type of data and % target class).
System Specs: The machine specs including RAM, number of CPU cores, and number of GPU’s.
- Max memory usage: The maximum memory used during the experiment.
Recipe: The recipe used for the experiment.
- Validation scheme: Type of sampling and number of internal holdouts.
- Feature Engineering: Number of features scored and the final selection.
Timing: The time taken for each step in the experiment.
- Data preparation: Total time for data preparation and number of features scored.
- Shift/Leakage detection: Total time for shift and leakage detection.
- Model and feature tuning: Total time for model and feature tuning with the number of models trained.
- Feature evolution: Total time for feature evolution and number of models trained .
- Final pipeline training: Total time for final pipeline training and the total models trained.
- Python / MOJO scorer building: Total time for Python/MOJO scorer building.
Validation score: Logloss score +/- machine epsilon for the baseline.
Validation score: Logloss score +/- machine epsilon for the final pipeline.
Test score: Logloss score +/- machine epsilon score for the final pipeline.
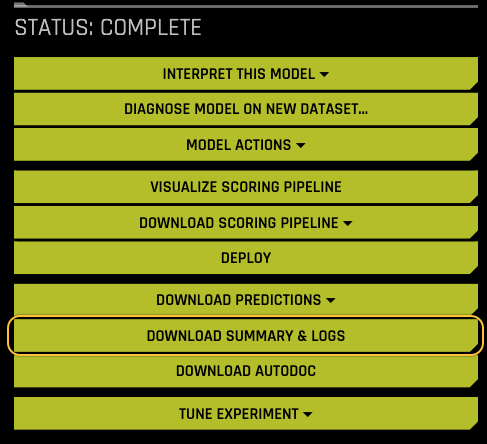
The information in the experiment SUMMARY tab, along with additional detail, can be found in the experiment summary report. Click on the DOWNLOAD SUMMARY & LOGS button to download the report.
Understanding model performance in the Freddie Mac classification experiment
This guide explores key questions to assess your model's performance in the Freddie Mac classification task.
Feature selection:
The total number of features that were scored for your model and the total features that were selected.
Validation vs. Test Score
- Compare Validation and Test Scores: Analyze the difference between the final model's validation score and its test score.
- Validation Score: This score reflects the model's performance on a dedicated validation dataset not used for training.
- Test Score: This score represents the model's performance on a completely unseen test dataset.
Ideally, the validation and test scores should be close. A substantial difference suggests the model is overfitting to the training data and may not generalize well to unseen data.
Interpreting Log Loss
- Test Log Loss: The test log loss metric serves as an indicator of your model's performance on unseen data, specifically the
freddie_mac_500_testset. It essentially reflects the model's error rate in classifying the test instances.
Log loss values are inversely proportional to model performance. Lower log loss signifies a better fit, implying a lower number of misclassifications. Conversely, higher log loss indicates the model is making more mistakes in its predictions.
In this experiment, the relatively small log loss of 0.119511 +/- 0.001389542 suggests that the model achieved a low misclassification rate on the unseen test data. This is a positive indication of the model's ability to generalize well.
If you're unfamiliar with Log Loss, refer Log Loss for more information.
In the upcoming tasks we'll explore the financial implications of misclassification by exploring the confusion matrix and plots derived from it.
- Submit and view feedback for this page
- Send feedback about H2O Driverless AI | Tutorials to cloud-feedback@h2o.ai