Task 7: ER: Prec-Recall
Continuing on the diagnostics page, select the P-R curve. The P-R curve should look similar to the one below:
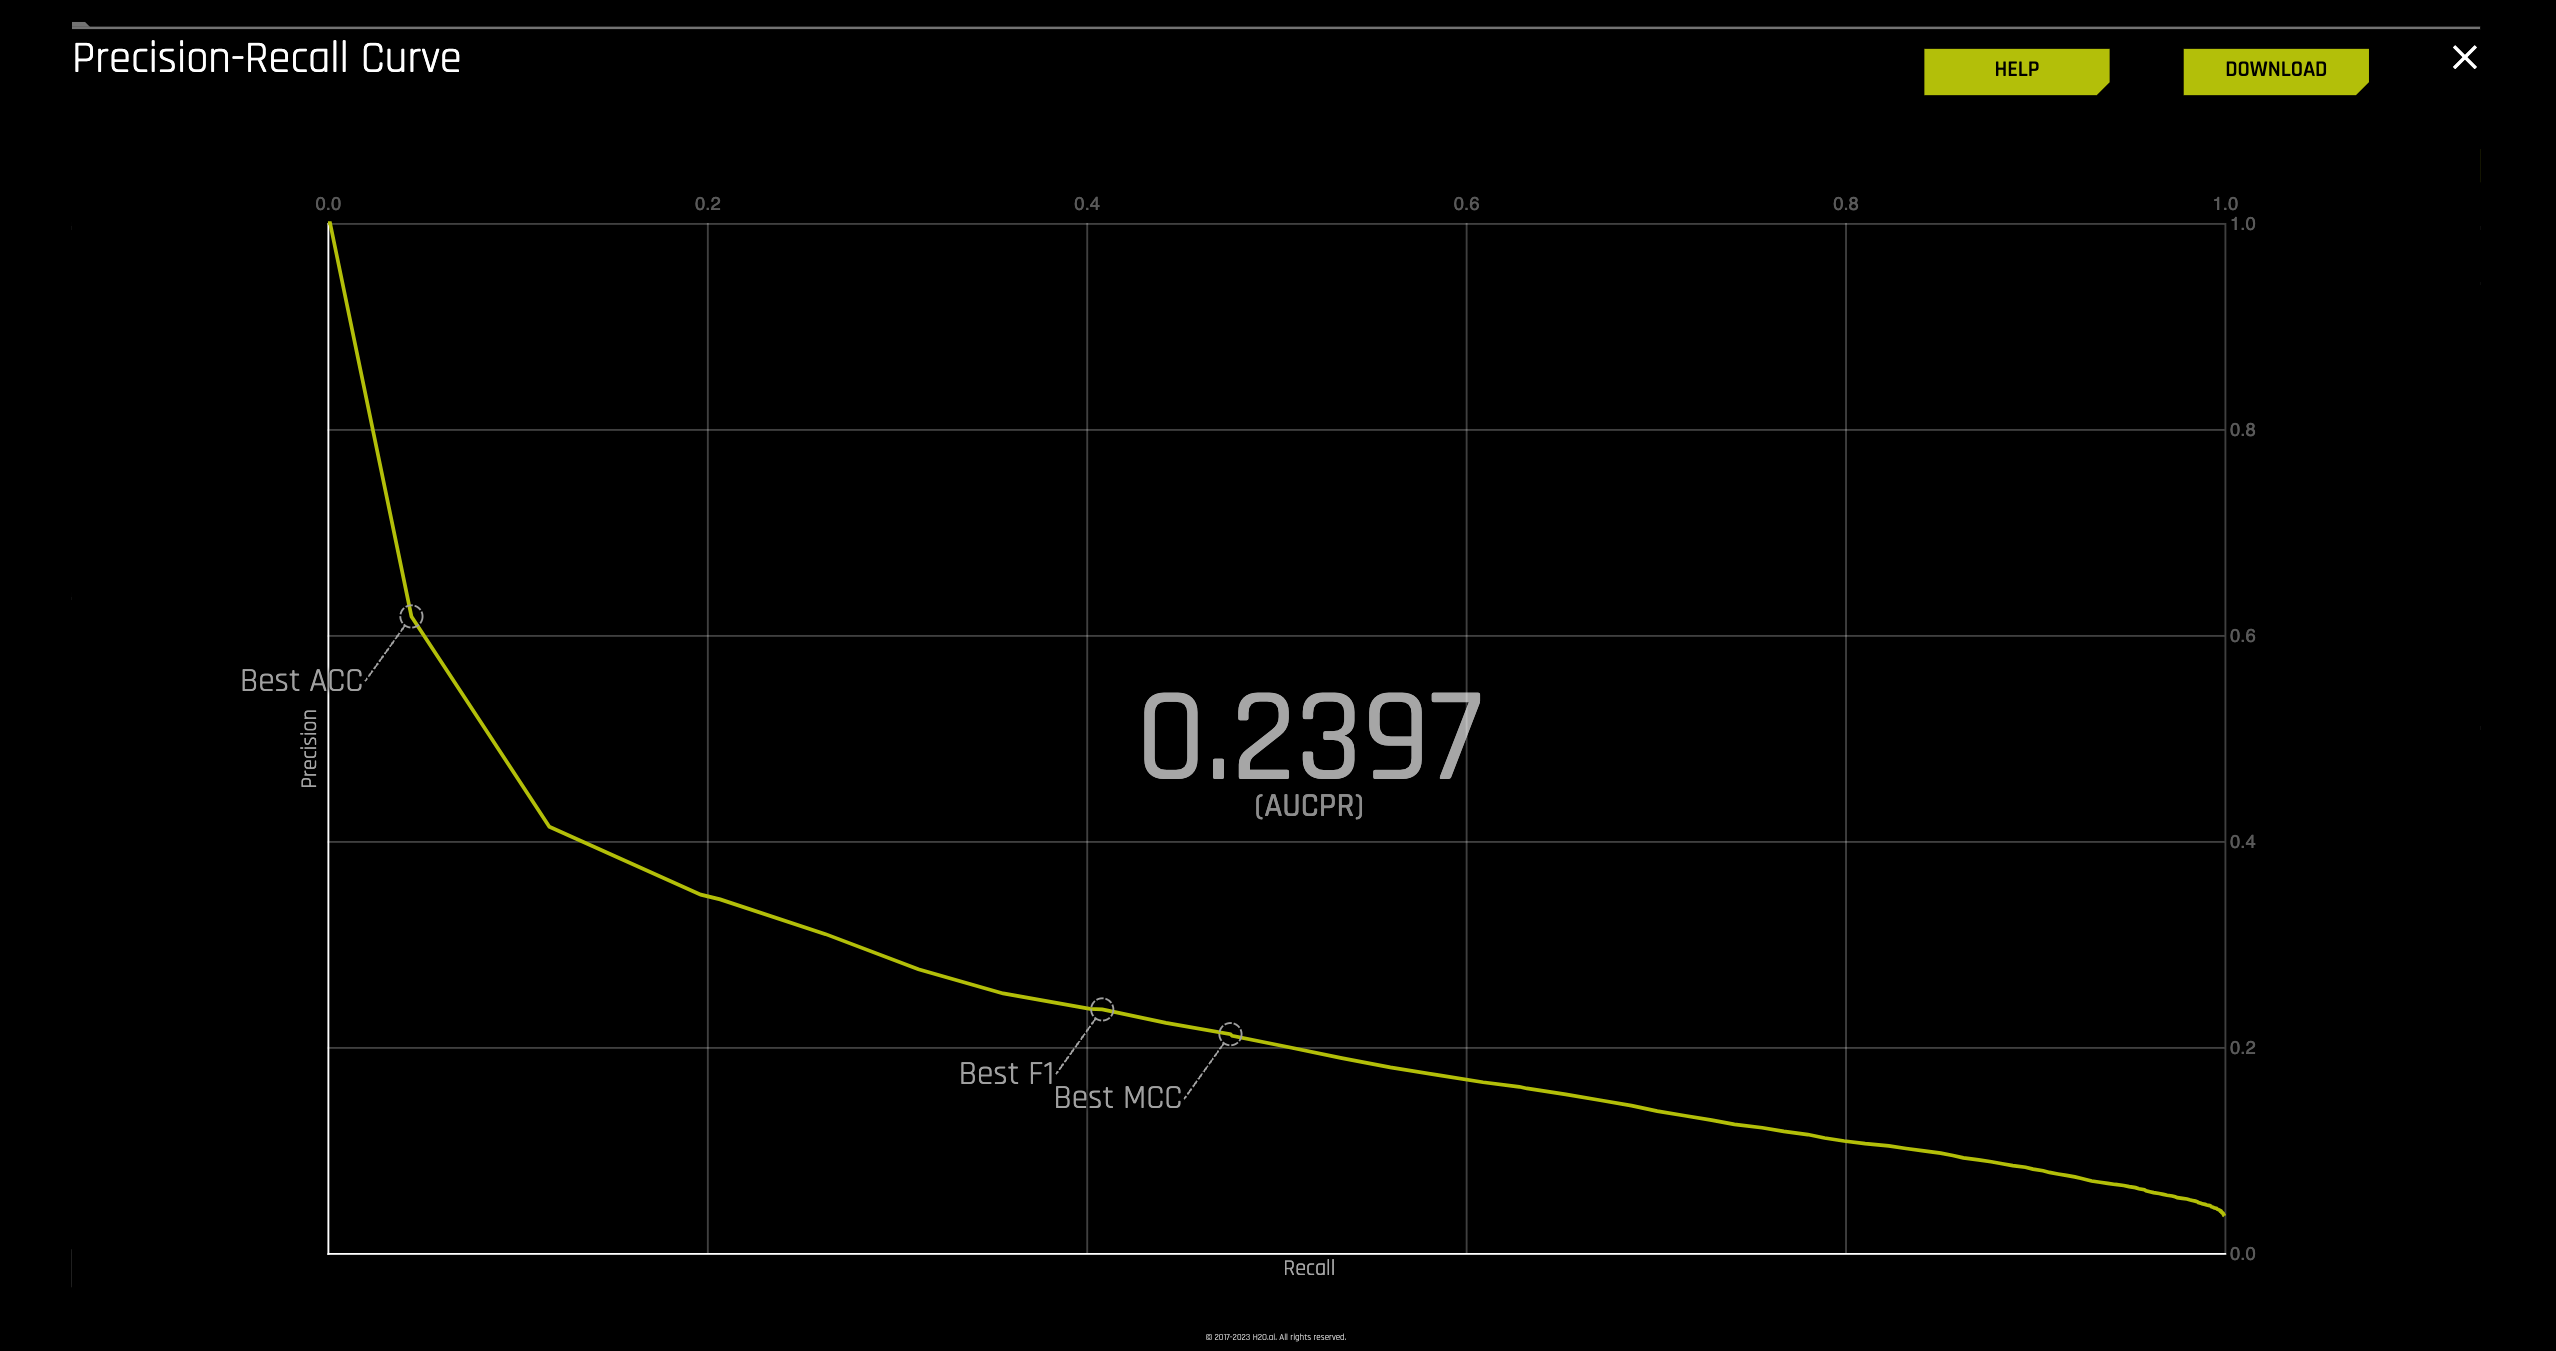
Note the following regarding the Precision-Recall (Prec-Recall) metrics:
- The precision-recall plot plots recall on the x-axis and precision on the y-axis.
- Recall is synonymous with sensitivity, while precision corresponds to the positive predictive value.
- ROC curves are suitable when there is a balanced distribution of observations across classes.
- Precision-Recall curves are more appropriate in scenarios with a significant class imbalance.
- Similar to ROC, the AUCPR (Area under the curve of Precision-recall curve) serves as a metric for model accuracy, with higher values indicating better performance.
- Driverless AI will identify thresholds for Accuracy (ACC), F1, or MCC (Matthews correlation coefficient) that optimize performance on both ROC and Precision-Recall curves.
Looking at the P-R curve results, we will take a look at the values found on the P-R curve to determine if a customer will default on their home loan.
Based on the P-R curve that Driverless AI model generated for you experiment identify the AUC.
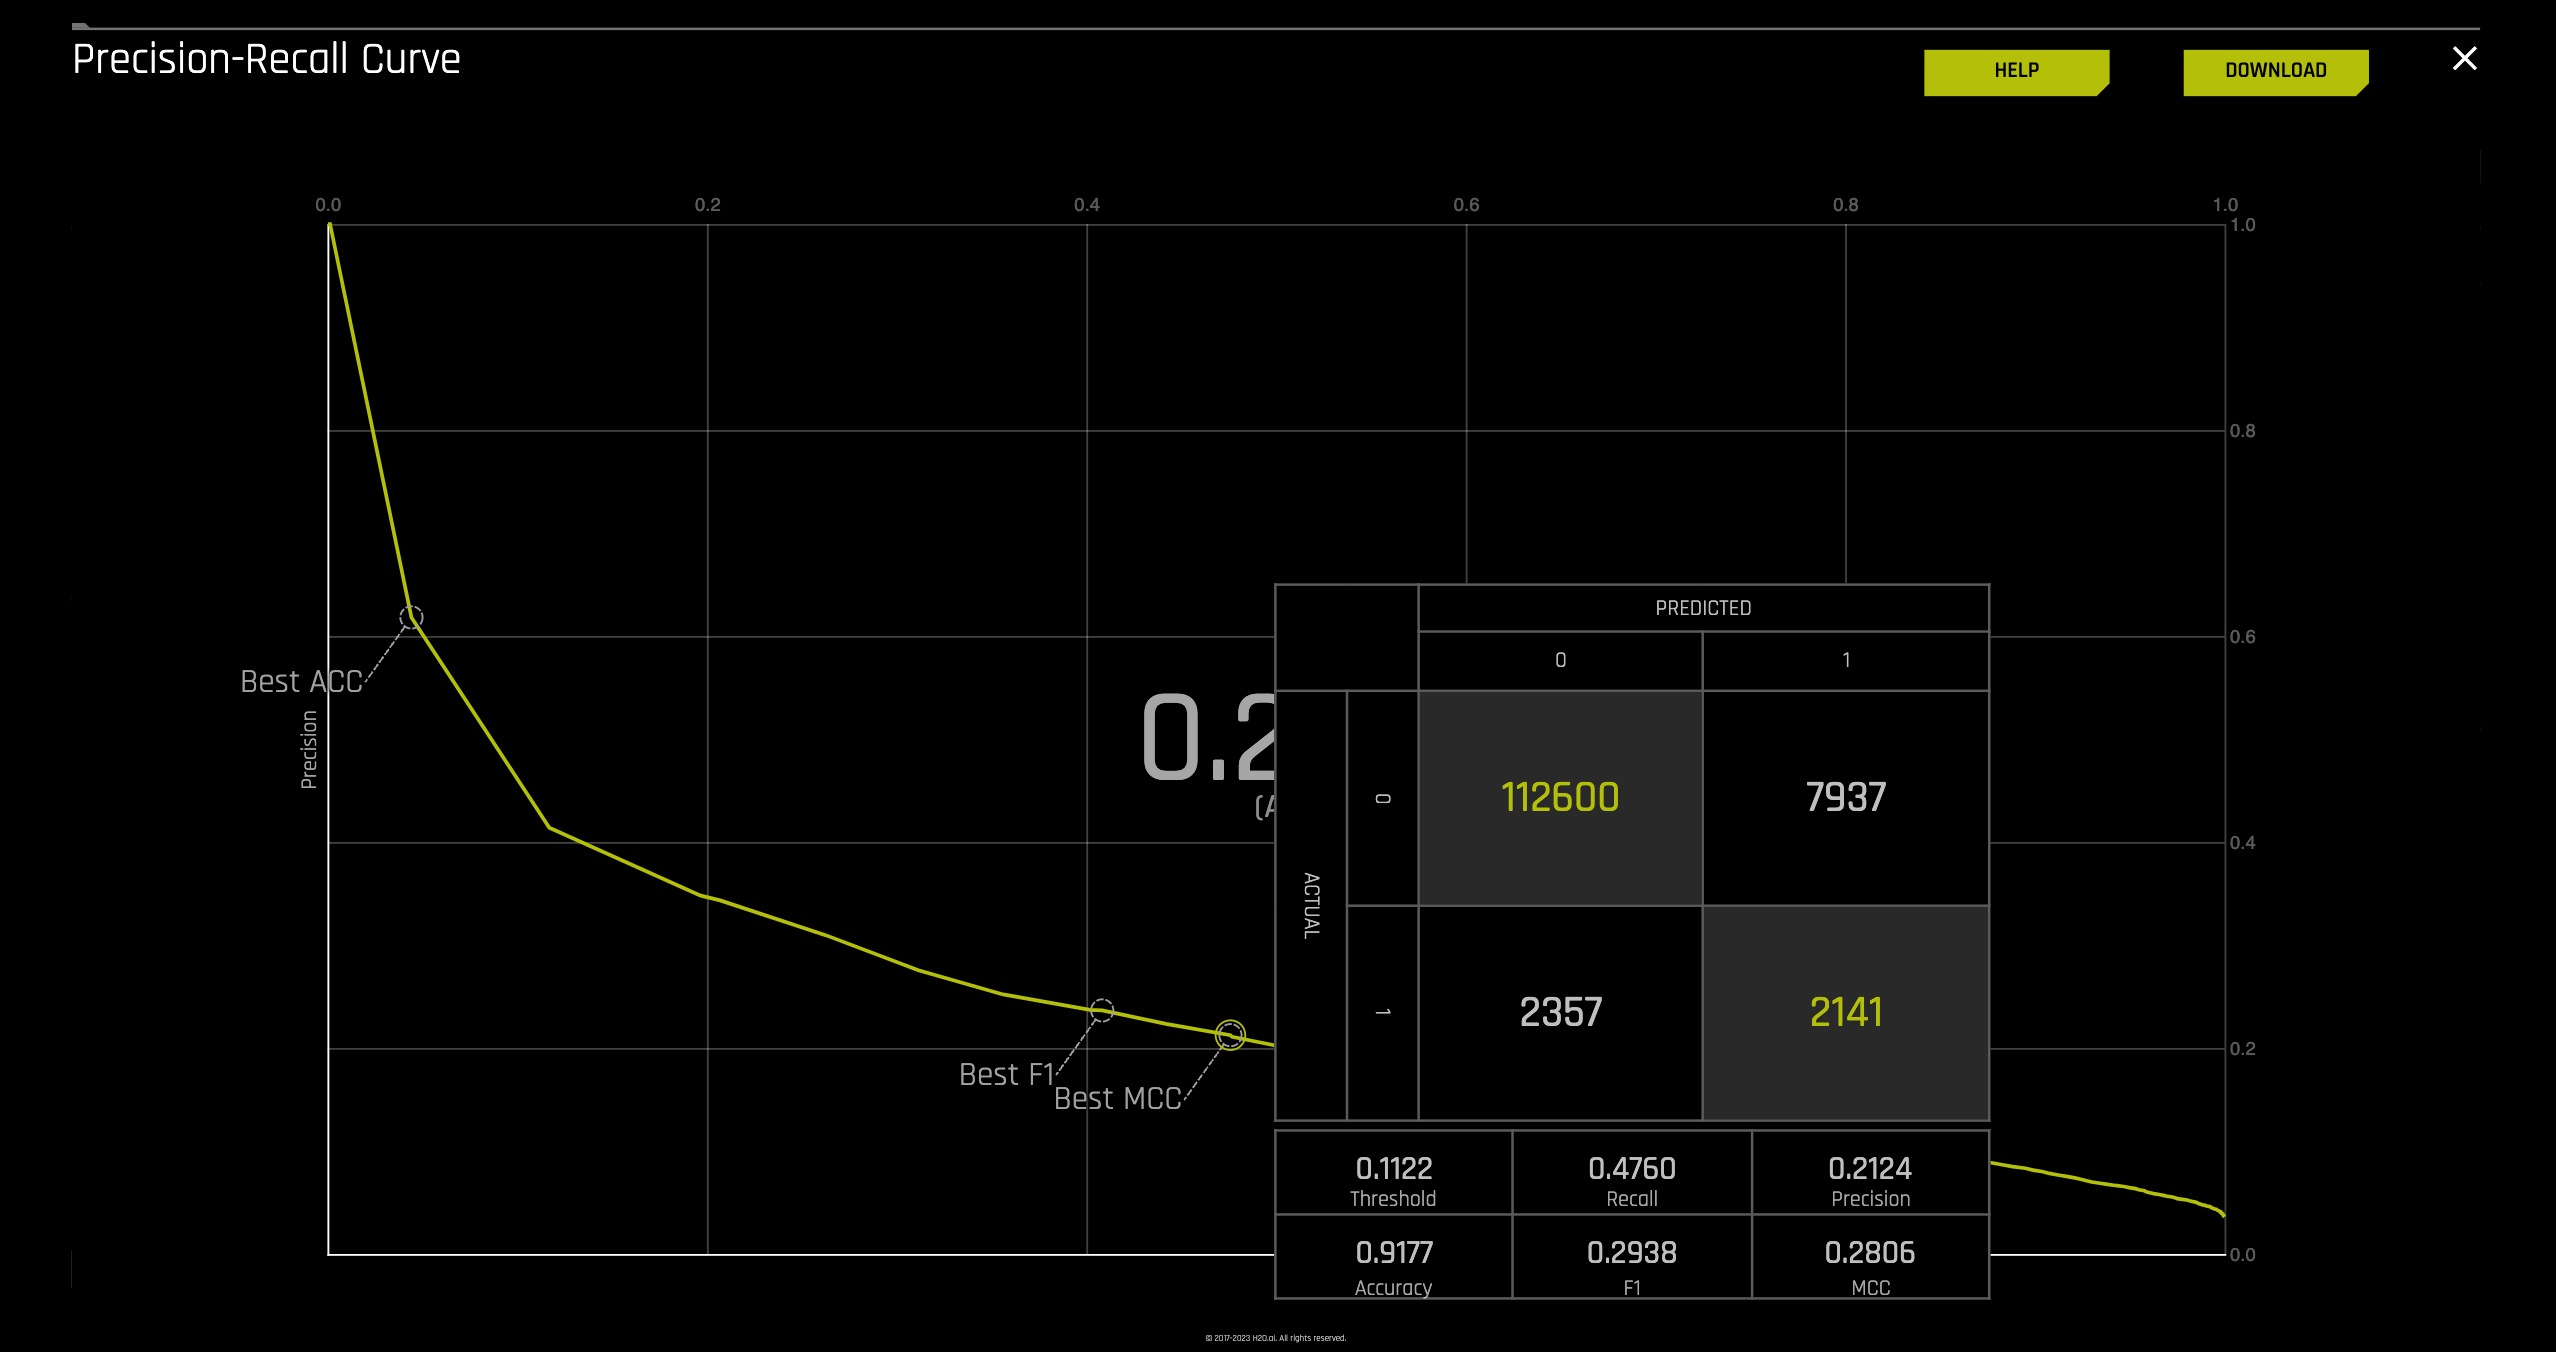
For each of the following points on the curve, determine the True Positive Rate, False Positive rate, and threshold by hovering over each point (as shown below).
- Best Accuracy
- Best F1
- Best MCC
- From the observed AUC, Best MCC, F1 and Accuracy values for P-R, we will qualify if the model is good or bad using the key points below to help us asses the P-R curve.
- A perfect classification model achieves an AUC of 1.
- MCC ranges from -1 to +1, where +1 represents perfect predictions, 0 indicates performance no better than random, and -1 signifies all incorrect predictions.
- F1 ranges from 0 to 1, with 0 indicating the absence of true positives, and 1 representing perfect precision and recall or no false negatives or false positives.
- Accuracy ranges from 0 to 1, where 1 denotes perfect accuracy or classification, and 0 reflects poor accuracy or classification.
If you're not sure what AUC, MCC, F1, and Accuracy are or how they are calculated, review the concepts section of this tutorial.
New Experiment with same settings
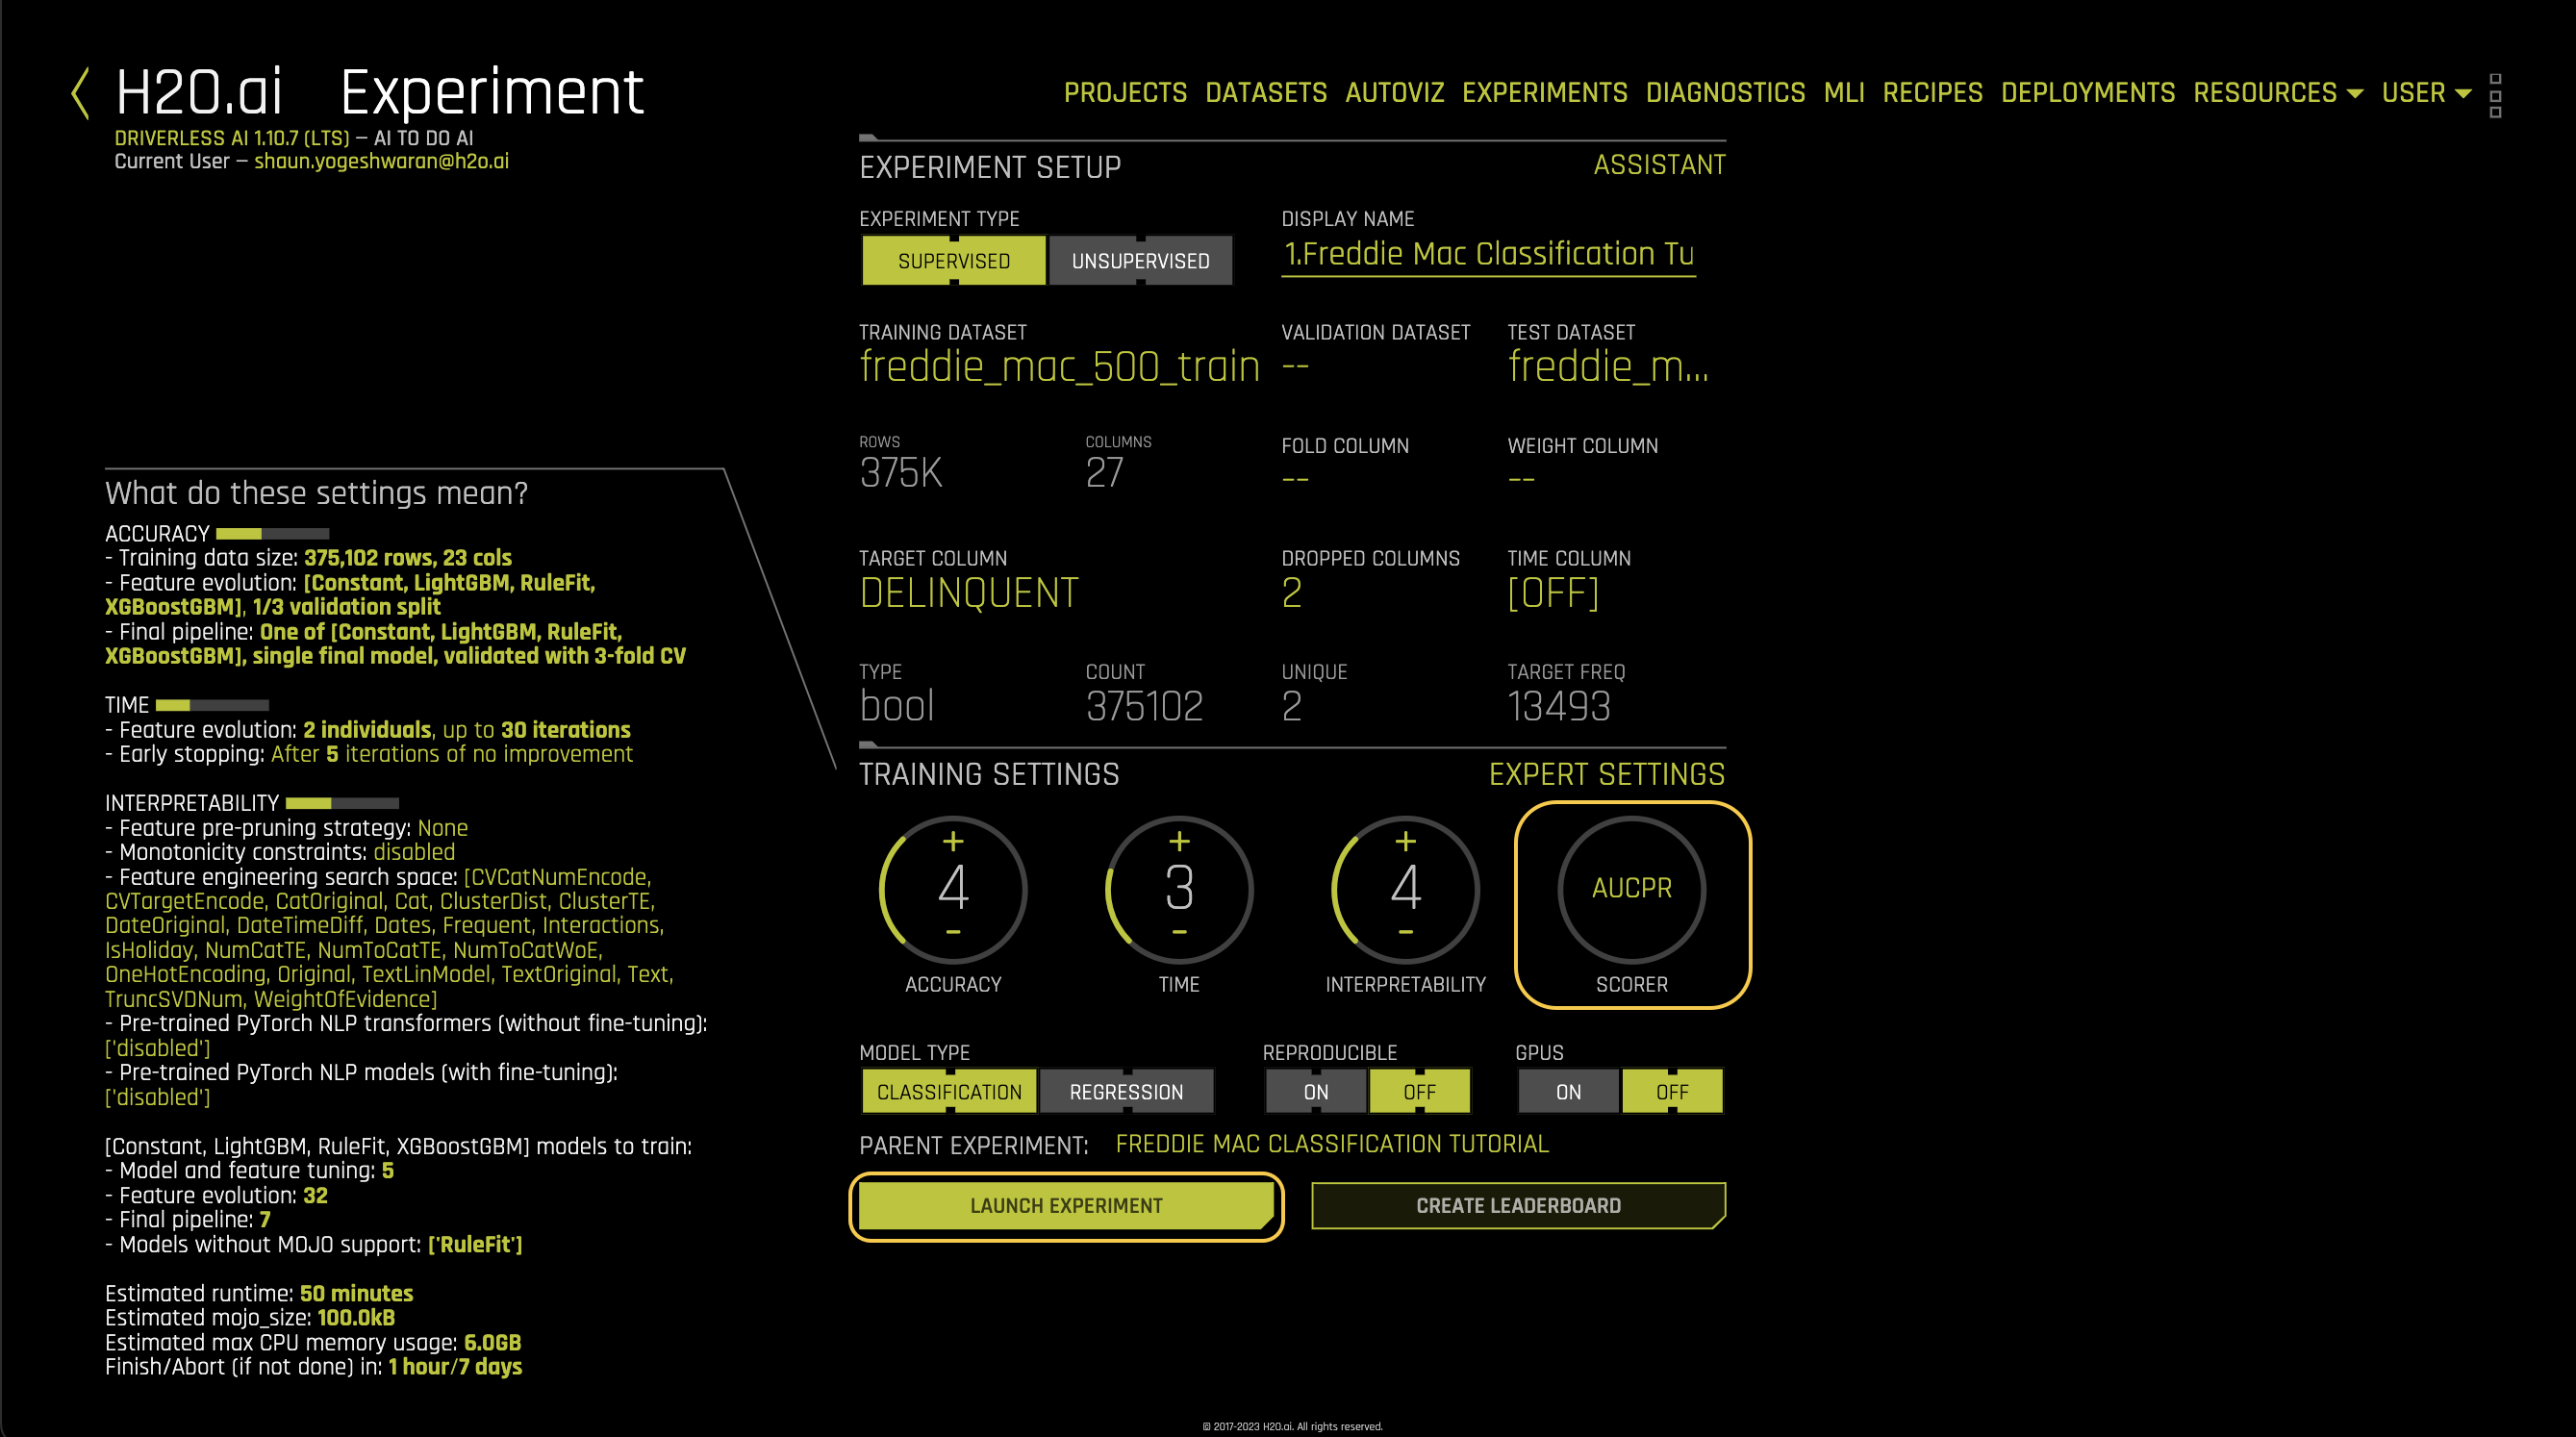
Similarly to task 6, you can improve the area under the curve for precision-recall by creating a new model with the same parameters. Note that you need to change the Scorer from Logloss to AUCPR.
To review how to run a new experiment with the same parameters and a different scorer, follow the step on Task 6.
If you ran the new experiment, go back to the diagnostic for the experiment you were working on.
- Submit and view feedback for this page
- Send feedback about H2O Driverless AI | Tutorials to cloud-feedback@h2o.ai