AI unit consumption
This section gives you meaningful stats and information about the AI units that are used in your H2O AI Managed Cloud (HAMC) environment.
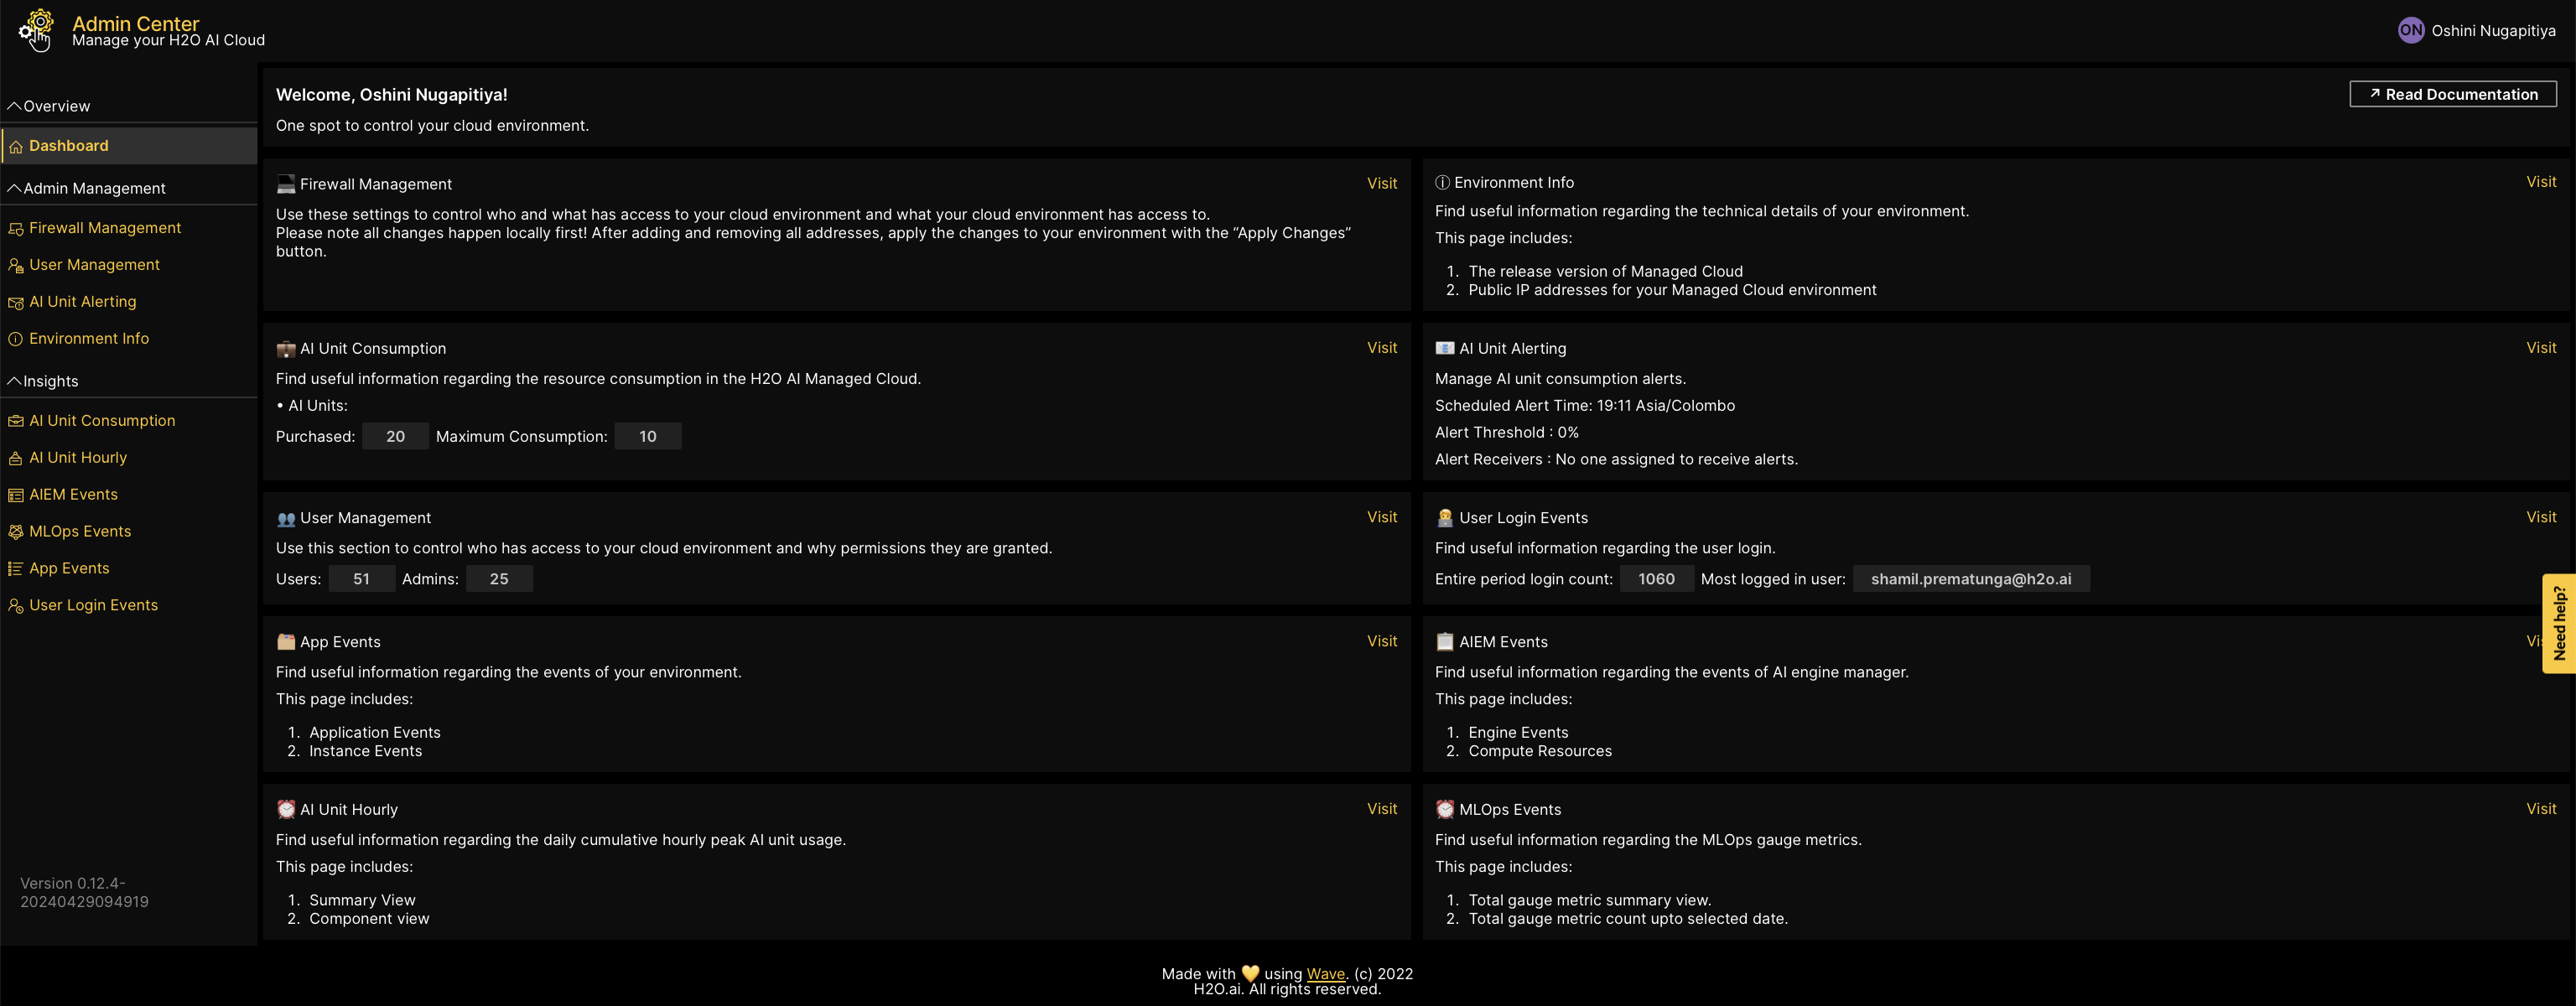
Click AI unit consumption on the left-navigation bar or click Visit on your Dashboard, to access the subsection.
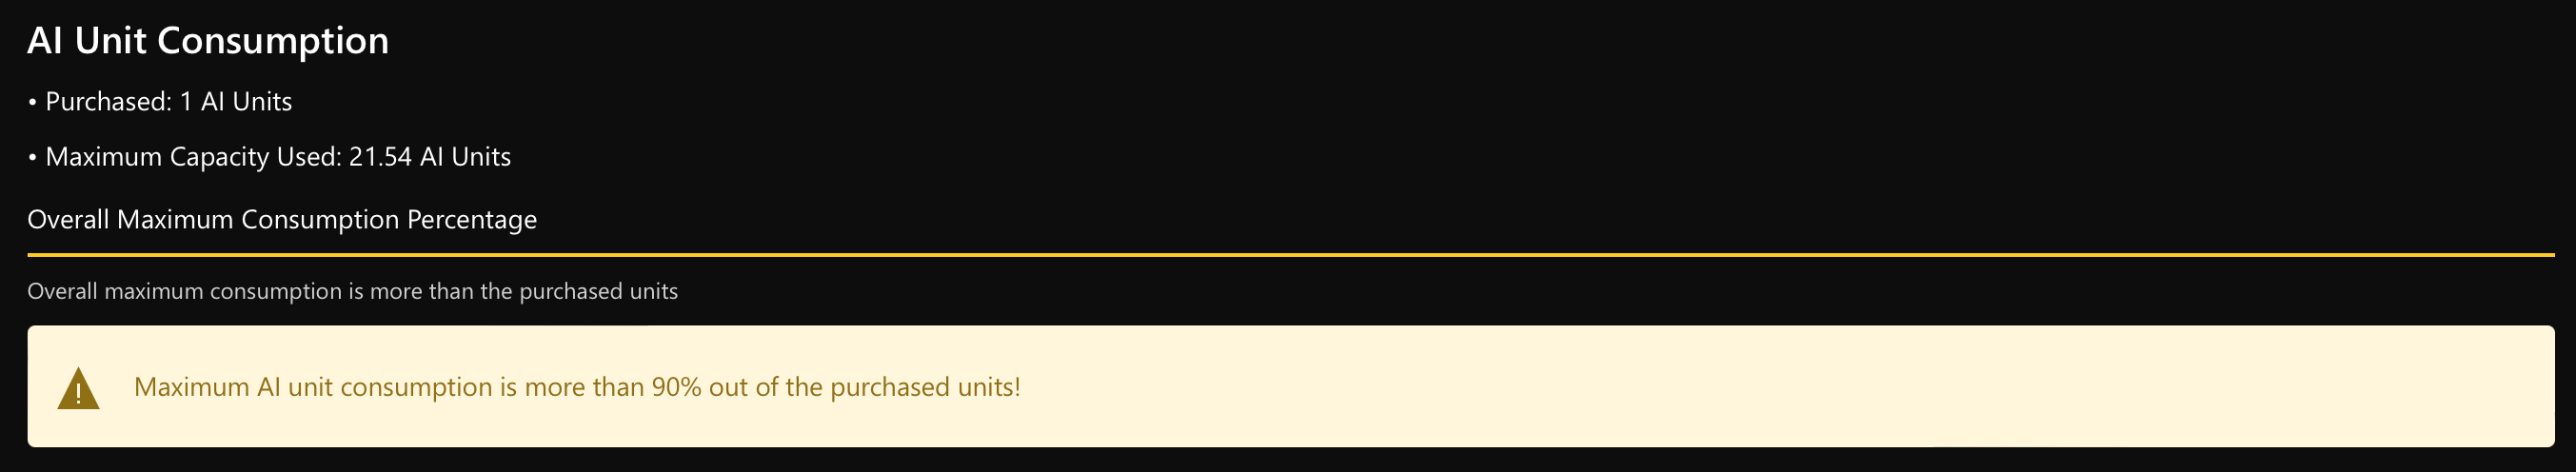
The first sub-section of this screen dislays the number of AI units purchased and consumed.
-
Purchased: The number of AI units that have been purchased for your HAMC environment.
-
Maximum capacity used: The total maximum number of AI units that have been used in your HAMC environment.
-
Overall maximum consumption percentage: This bar shows the percentage of maximum consumption over the number of purchased units.
In the example above, the Overall maximum consumption percentage bar is full because the maximum capacity used is higher than the number of purchased units. The warning below the bar also indicates that the maximum consumption is more than the number of purchased units, thus providing helpful information to user that more AI units should be purchased for this environment.
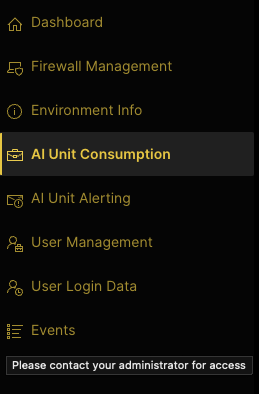
- Users who don't have administrator privileges can only access the AI unit consumption page.
- The other pages in the sidebar are disabled, and the app will show a tooltip when they try to access those pages.
- All the data shown on the AI unit consumption page is presented in the UTC time zone.
Graphical representation of AI unit consumption
Under the AI unit consumption visualization, you can select 'daily', 'weekly', or 'monthly' as the Time frame and select a date range of up to 60 days. By default, the past seven days are selected as the date range.
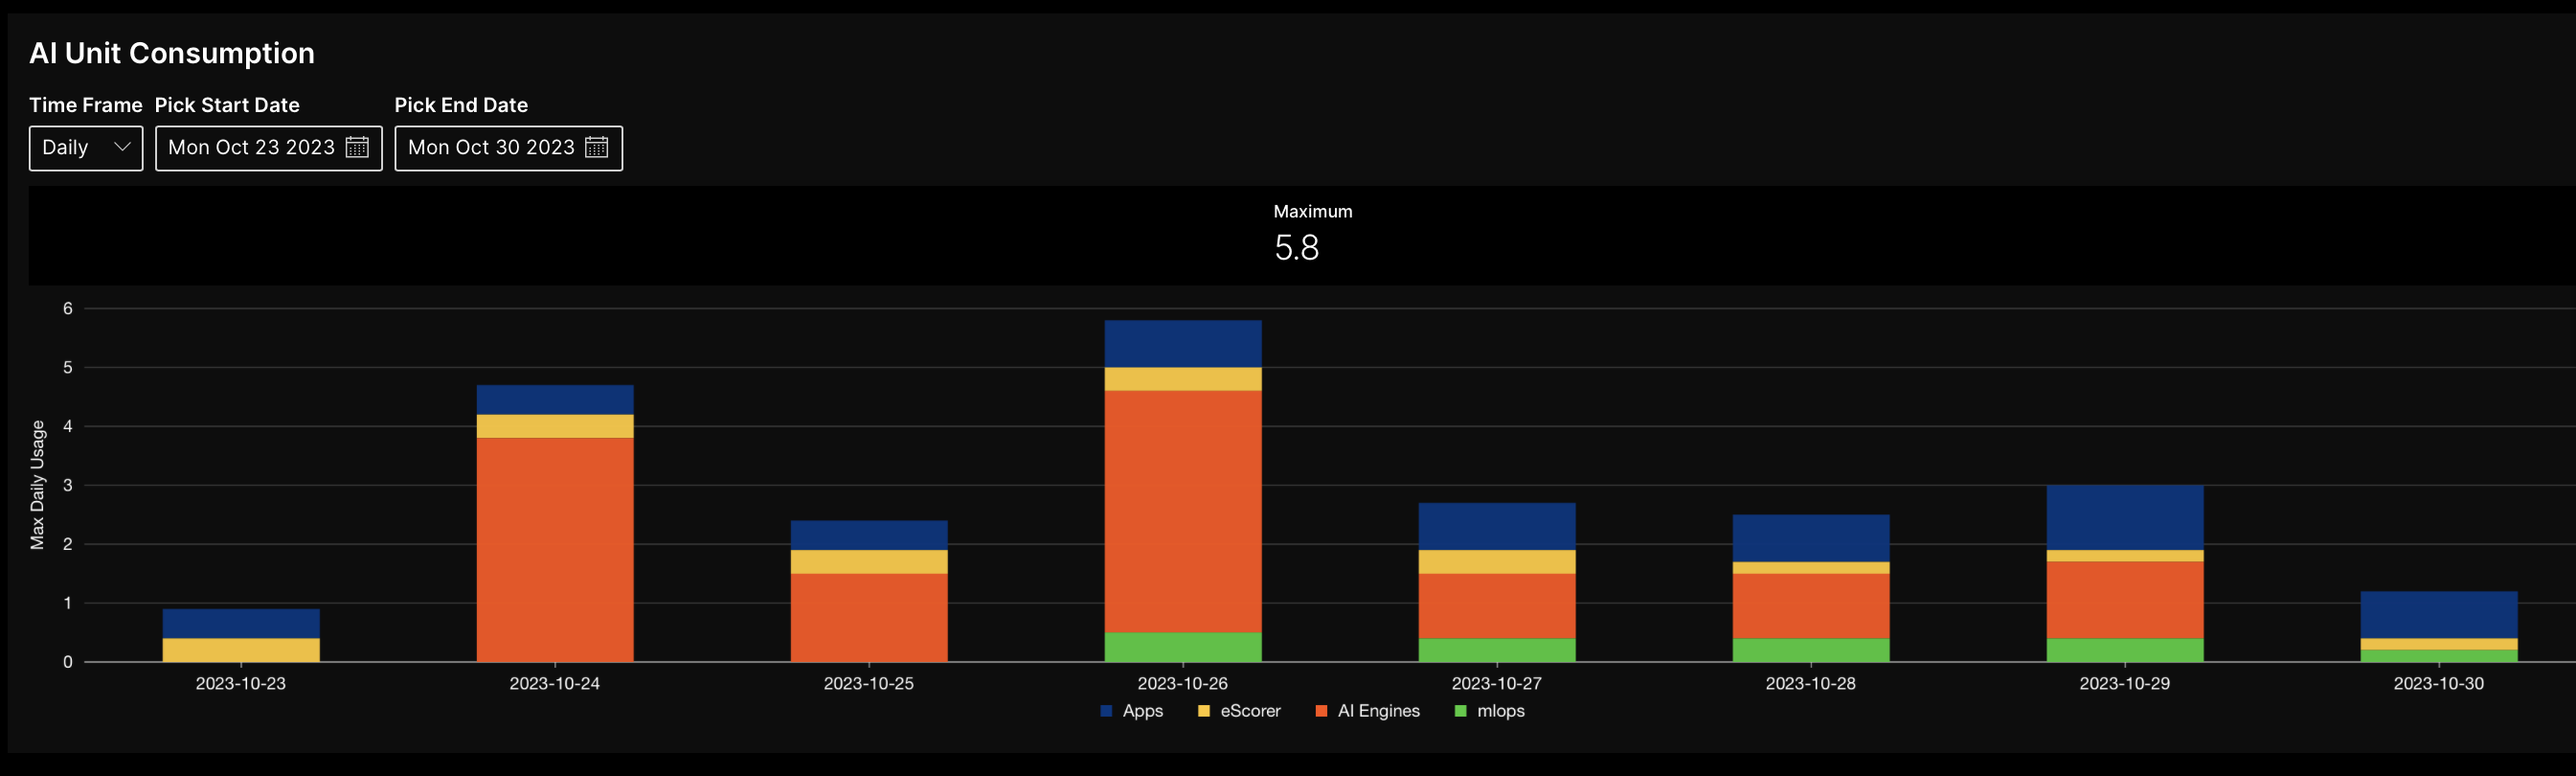
For 'daily', 'weekly', and 'monthly' time frames, the maximum number of AI units consumed by the environment over the selected date range is displayed at the top.
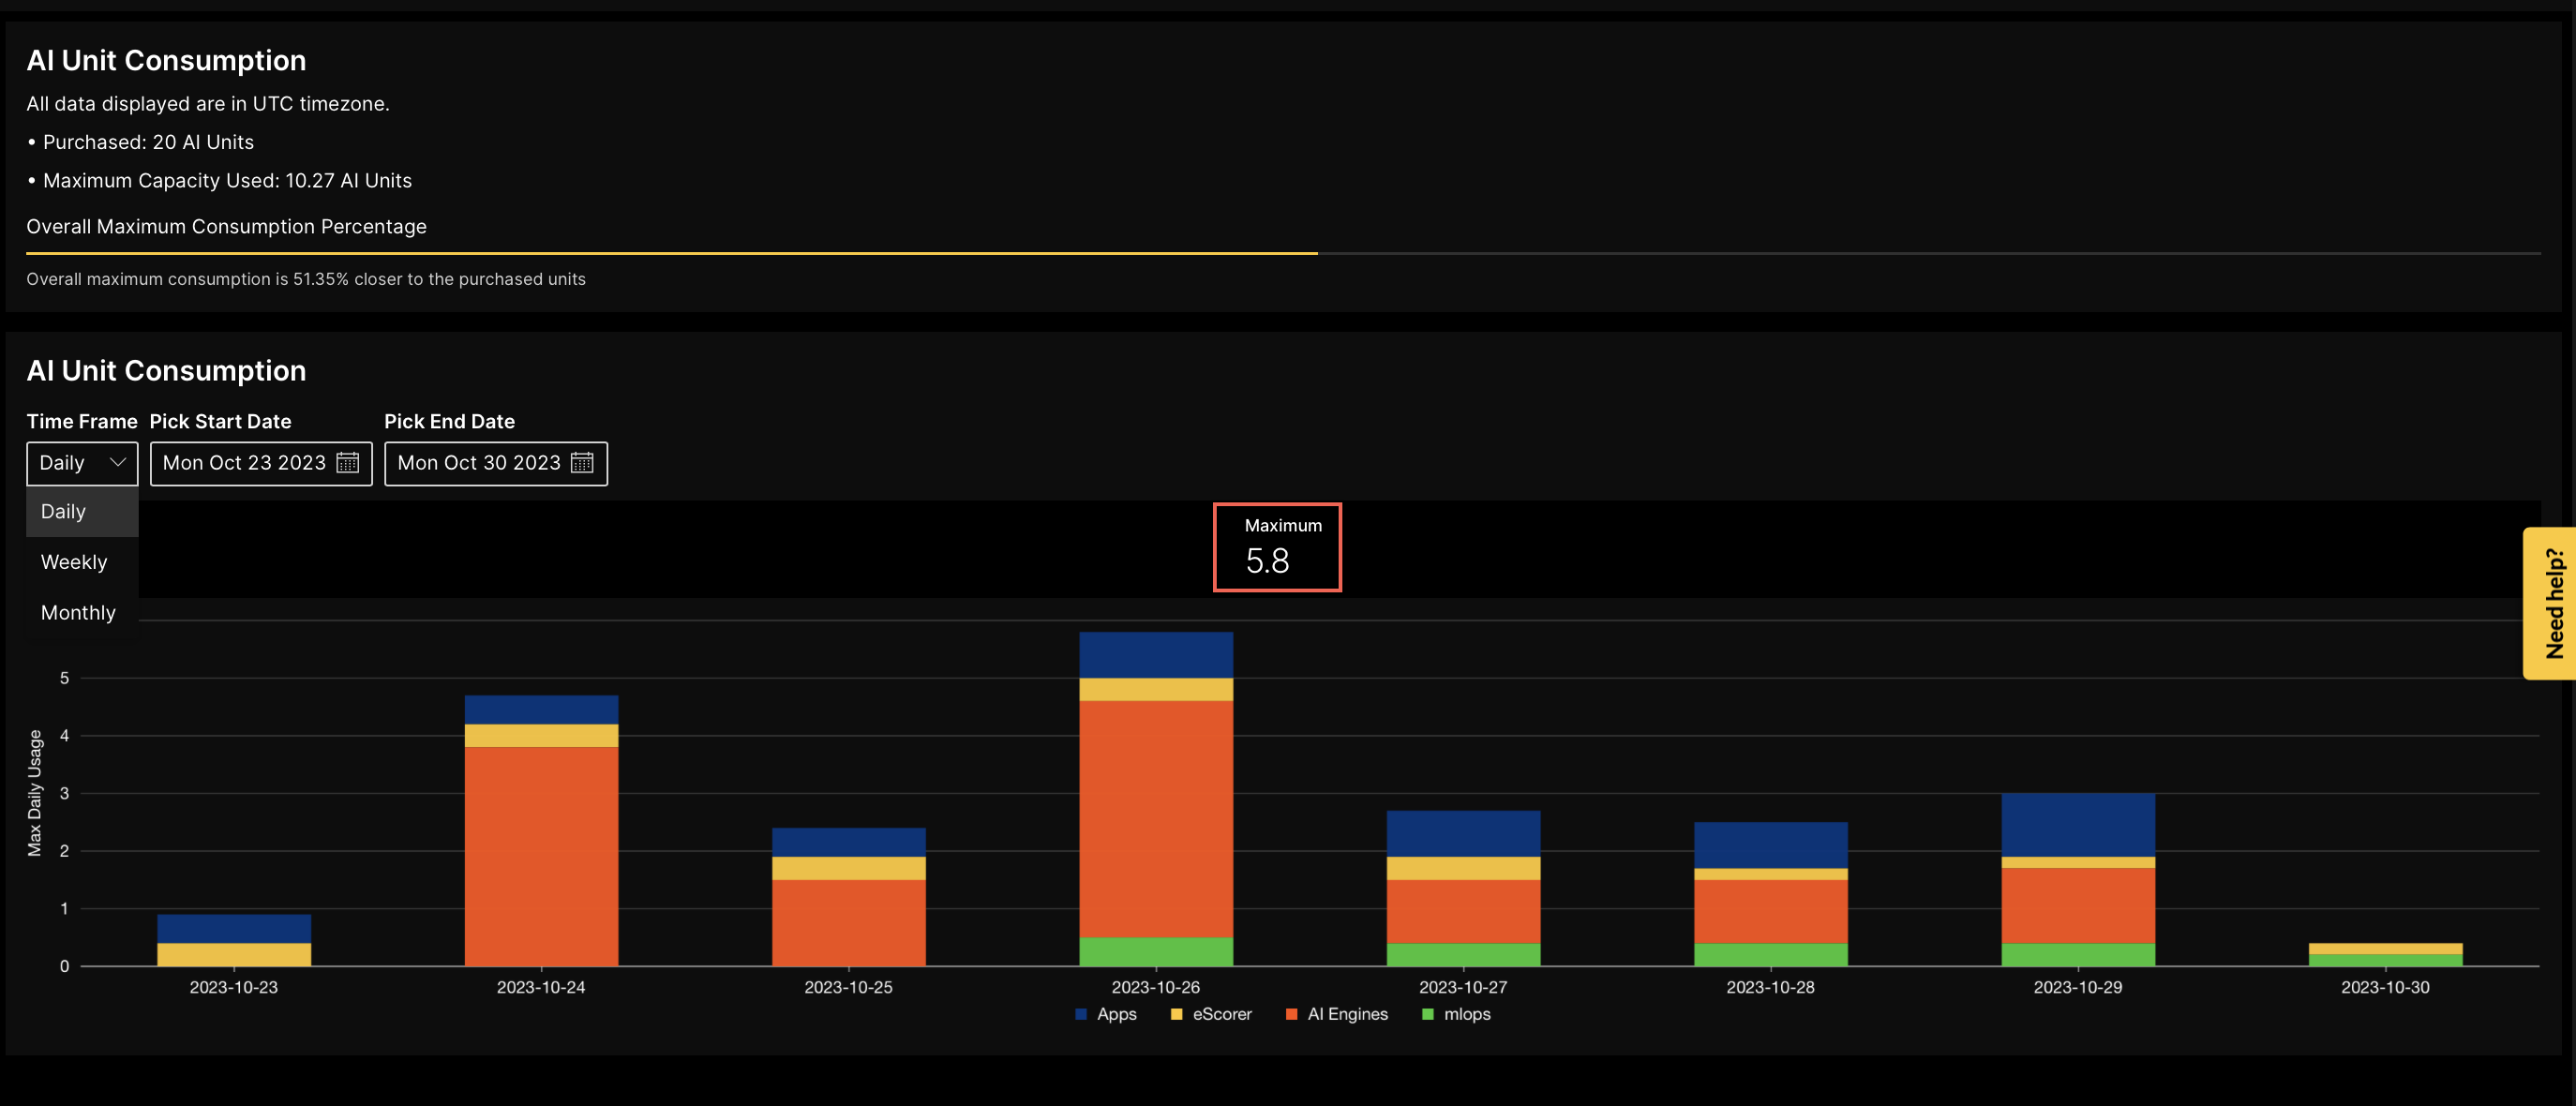
Each column on the column chart displays the maximum value of each resource (as a stack) recorded within that date. It allows you to quickly identify which resources consume more AI units at a first glance. You can also hover over each column and view the tooltip to see specific numbers or examine the data more closely.
If you select daily as the Time frame, it shows the Max daily usage of each day of the selected date range for each application or product installed in the environment.
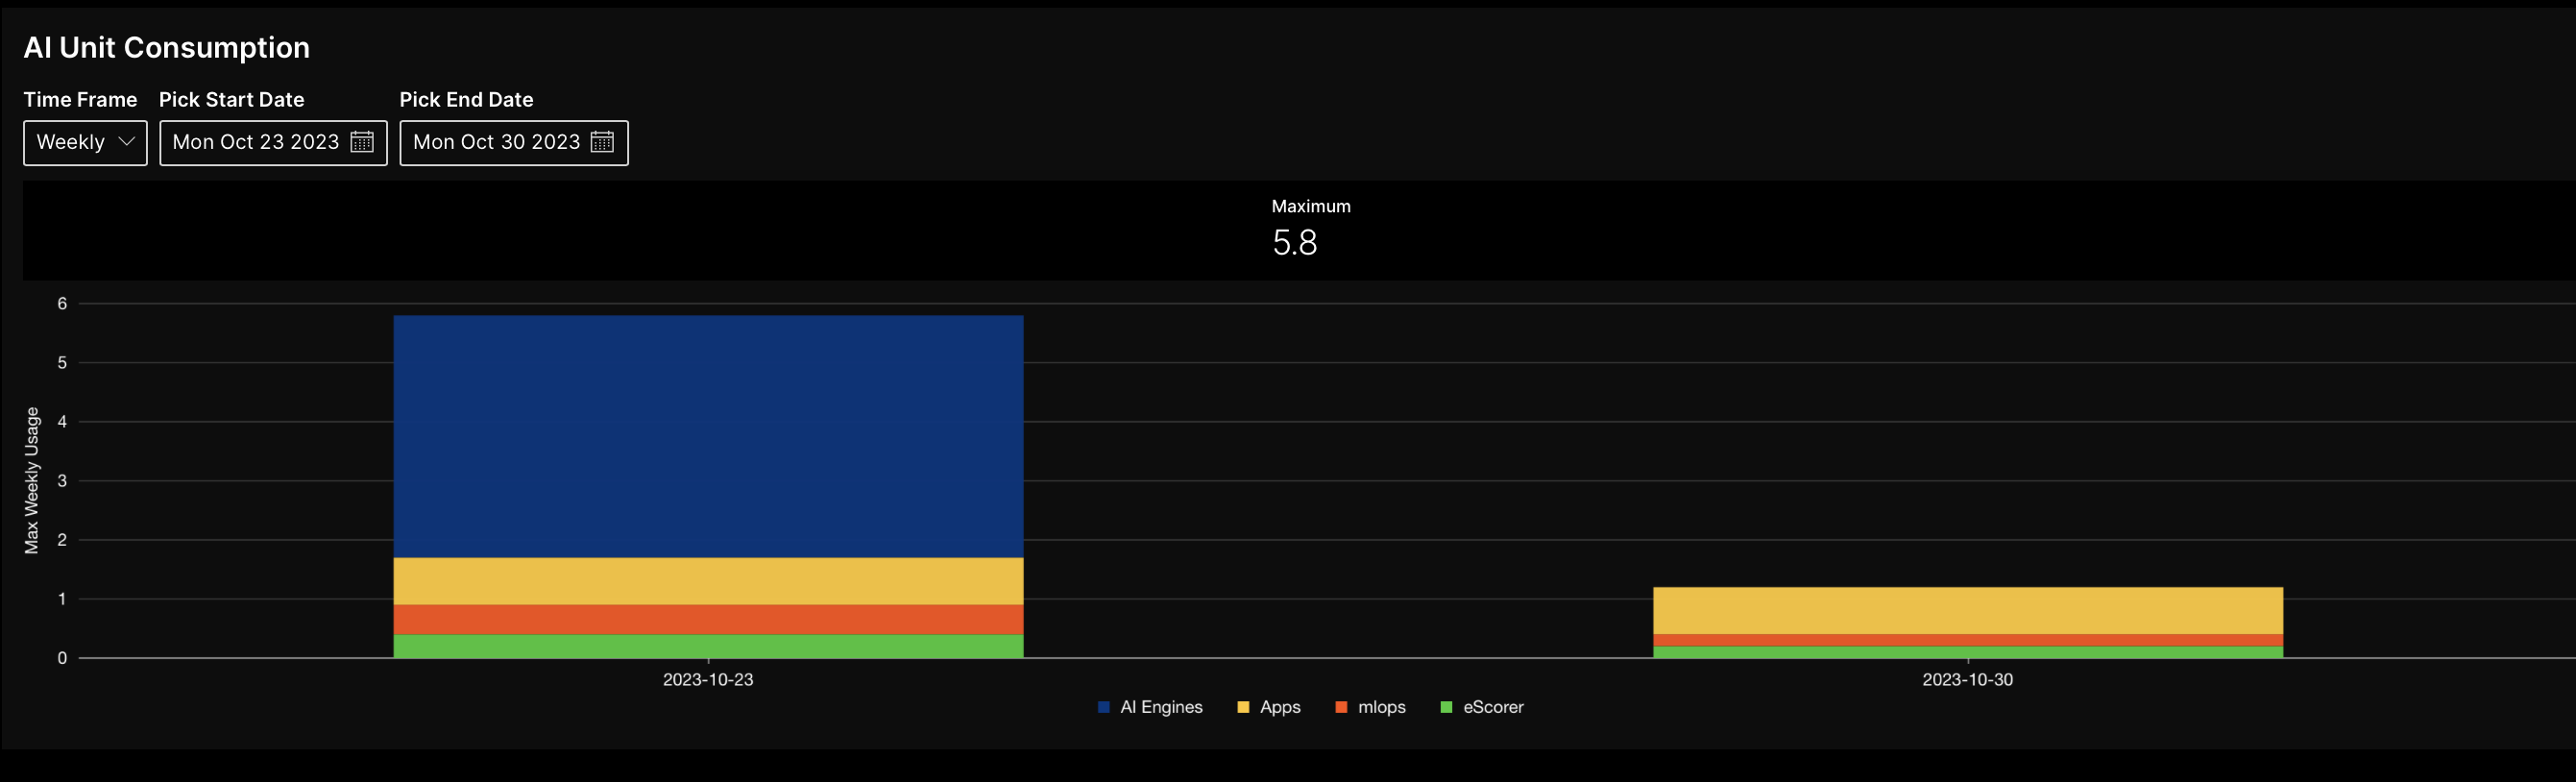
When you select the weekly Time frame, it shows Max weekly usage of each week starting from Monday for each application or product installed in the environment.
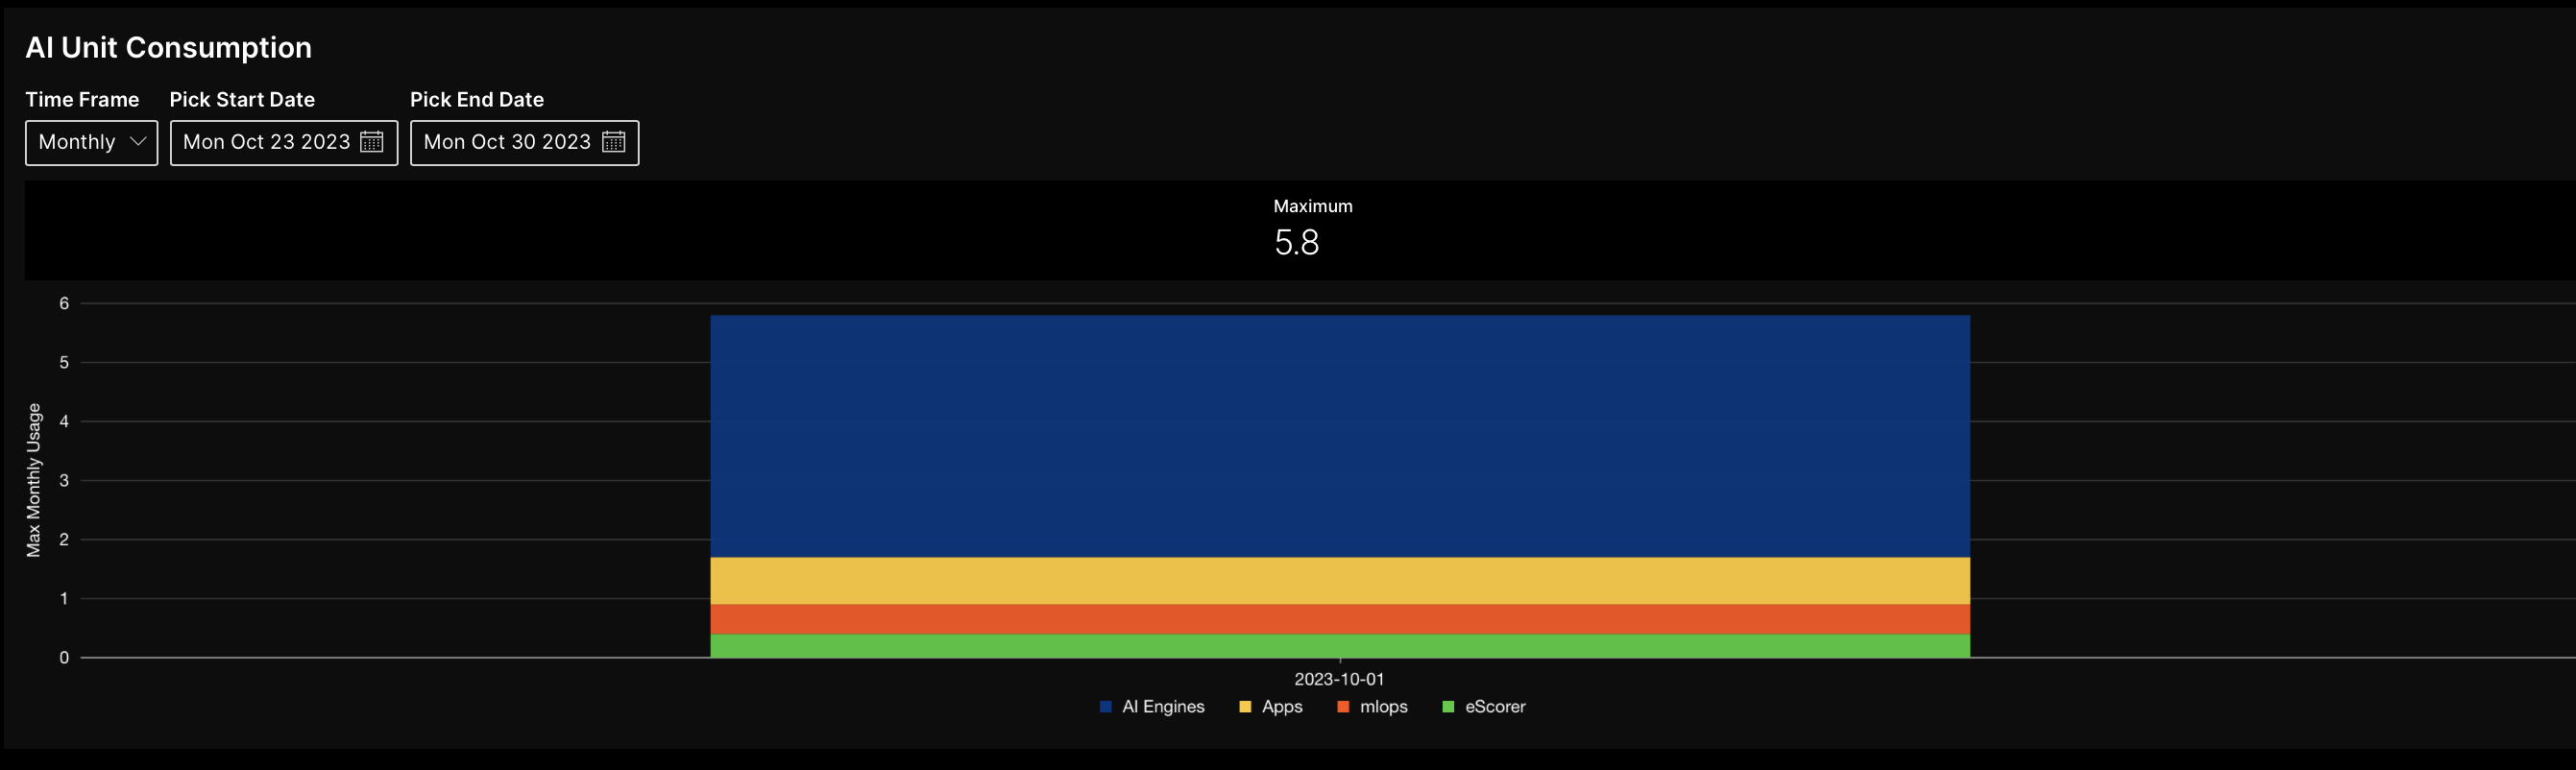
When you select the monthly Time frame, it shows the Max monthly usage of each month for each of the applications or products installed in the environment.
Summary
In this tutorial we learnt how to use H2O Admin Center to review the AI unit consumption of your HAMC environment. You can use this information to make effective decisions about the number of AI units based on the consumption.
- Submit and view feedback for this page
- Send feedback about H2O Admin Center to cloud-feedback@h2o.ai

