AI unit hourly
This section provides detailed information on the daily cumulative hourly peak usage of AI units that are used in your H2O AI Managed Cloud (HAMC) environment.
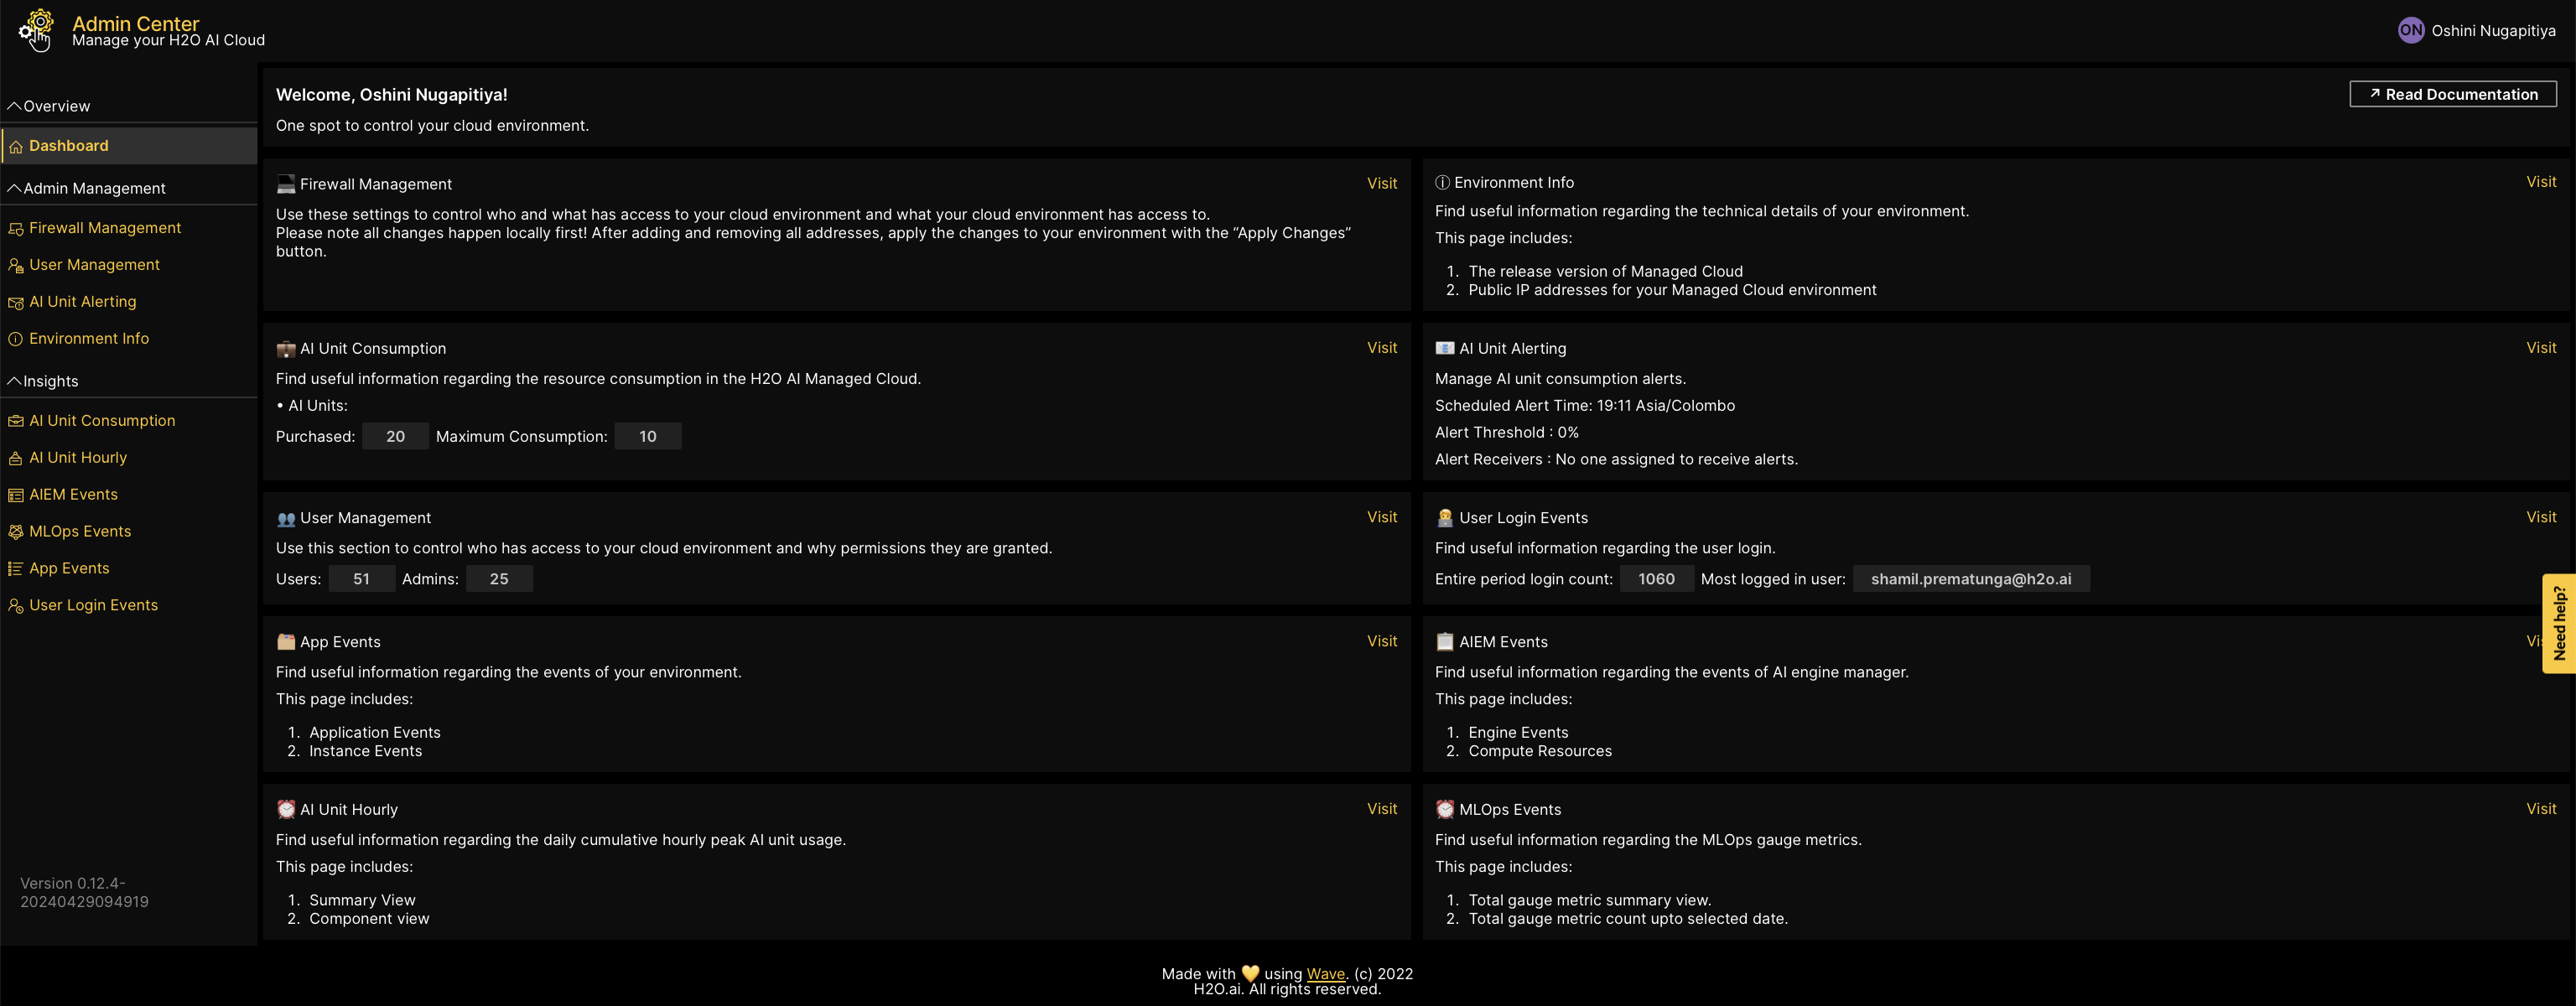
Click AI unit hourly on the left-navigation bar or click Visit on your Dashboard, to access the subsection.
Cumulative summary
The Cumulative summary tab displays the daily cumulative hourly usage of AI units.
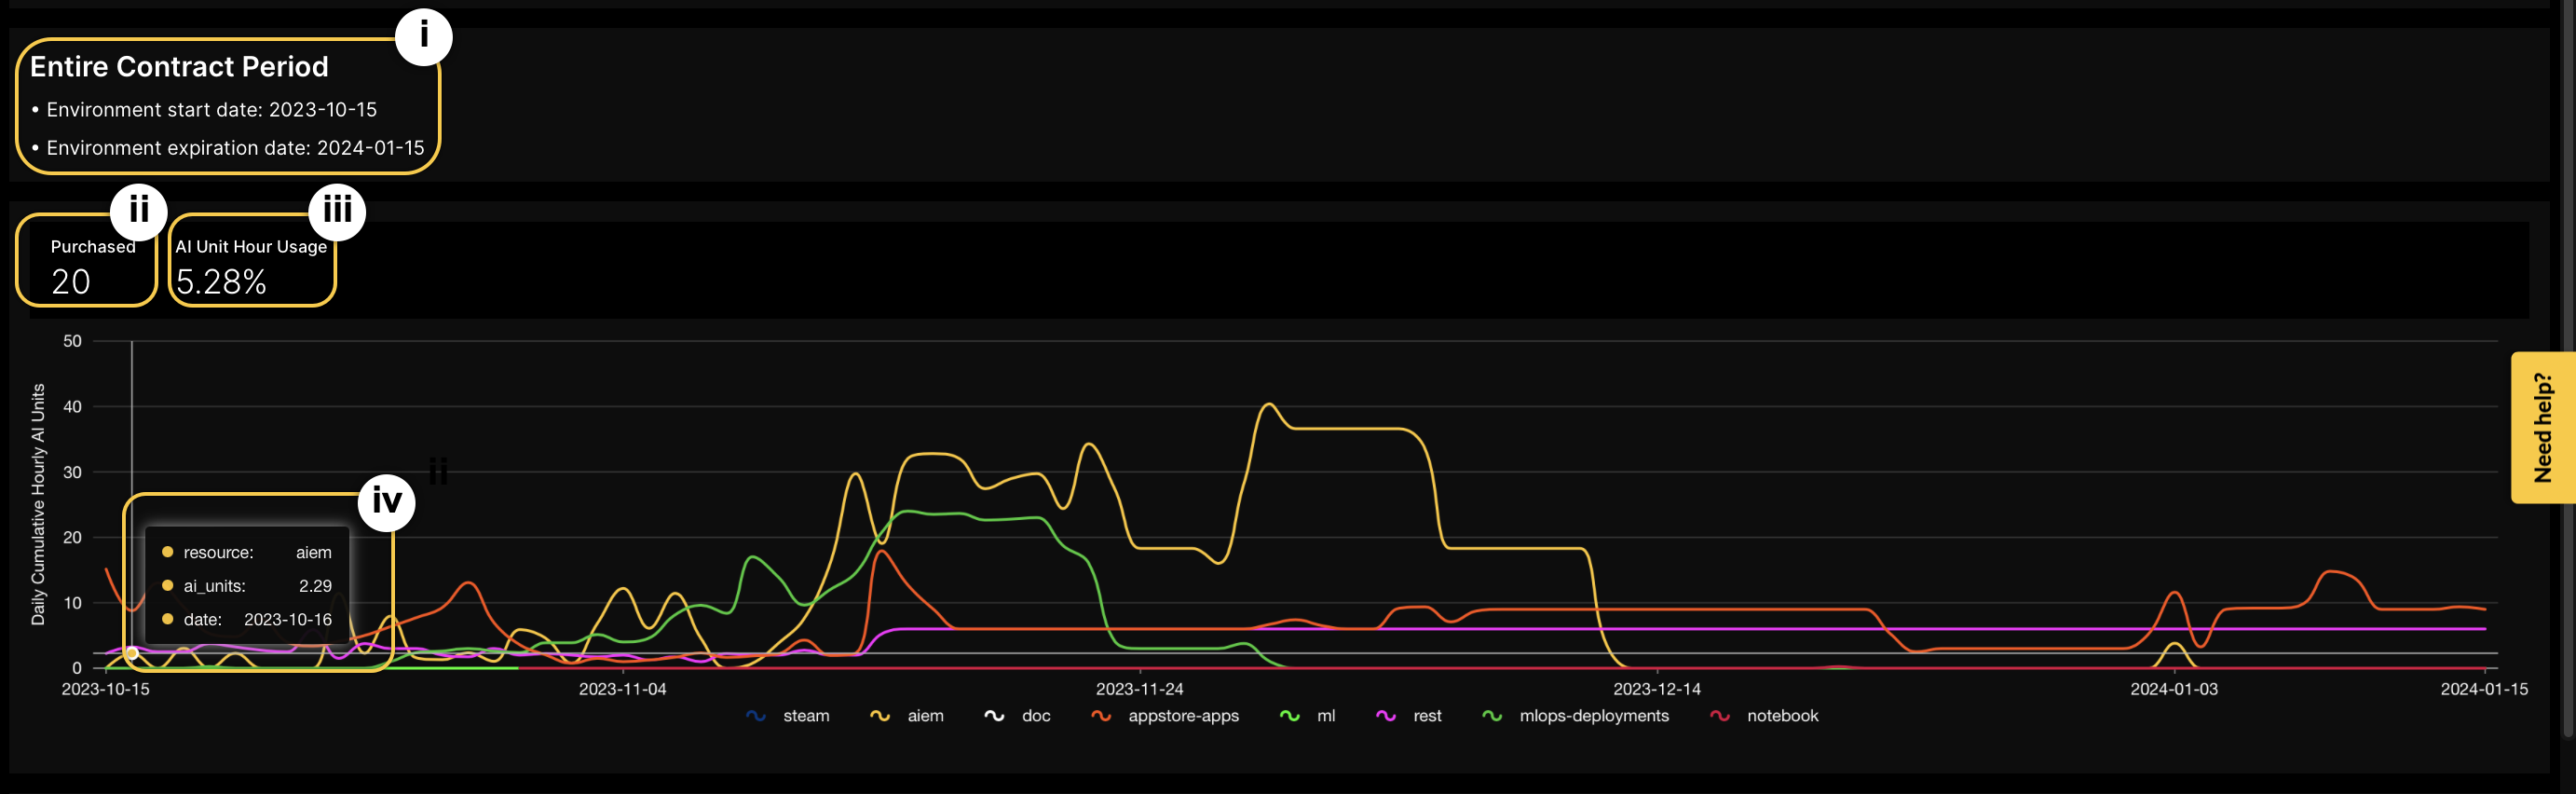
The first plot shows the cumulative hourly peak usage of AI units over the entire contract period, spanning from the start date to the expiration date of the HAMC environment where the app is installed.
The plot includes the following details:
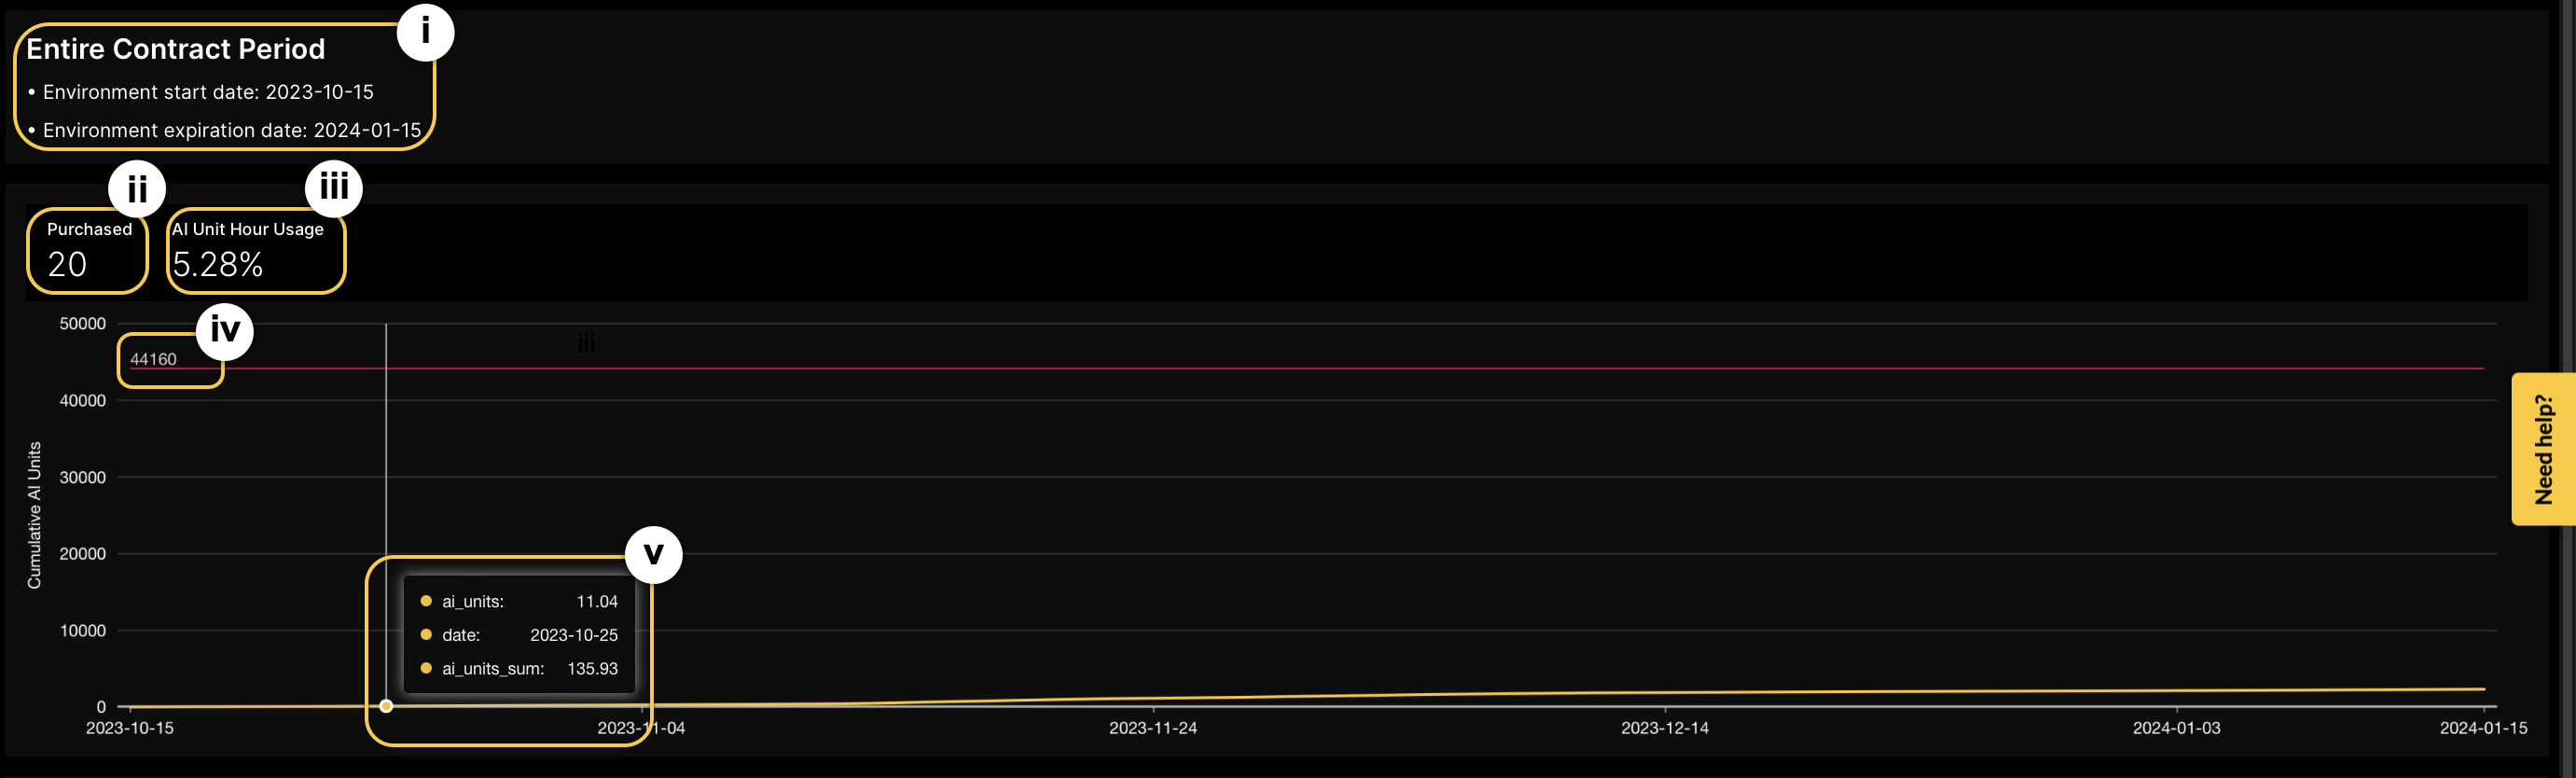
i. Entire contract period: the start date and the expiration date of the HAMC enviroment where the app is installed.
ii. Purchased: the total number of AI units purchased by the customer.
iii. AI unit hourly usage: the actual maximum hourly consumption of AI units as a percentage of the threshold value.
iv. Threshold value: the maximum number of cumulative AI units that the customer is allowed to use for the entire contract period.
v.
AI units: the total sum of the highest AI unit usage recorded for each hour within the day.
Date: specifies a particular date.
AI units sum: the total cumulative value of the AI units consumed over time.
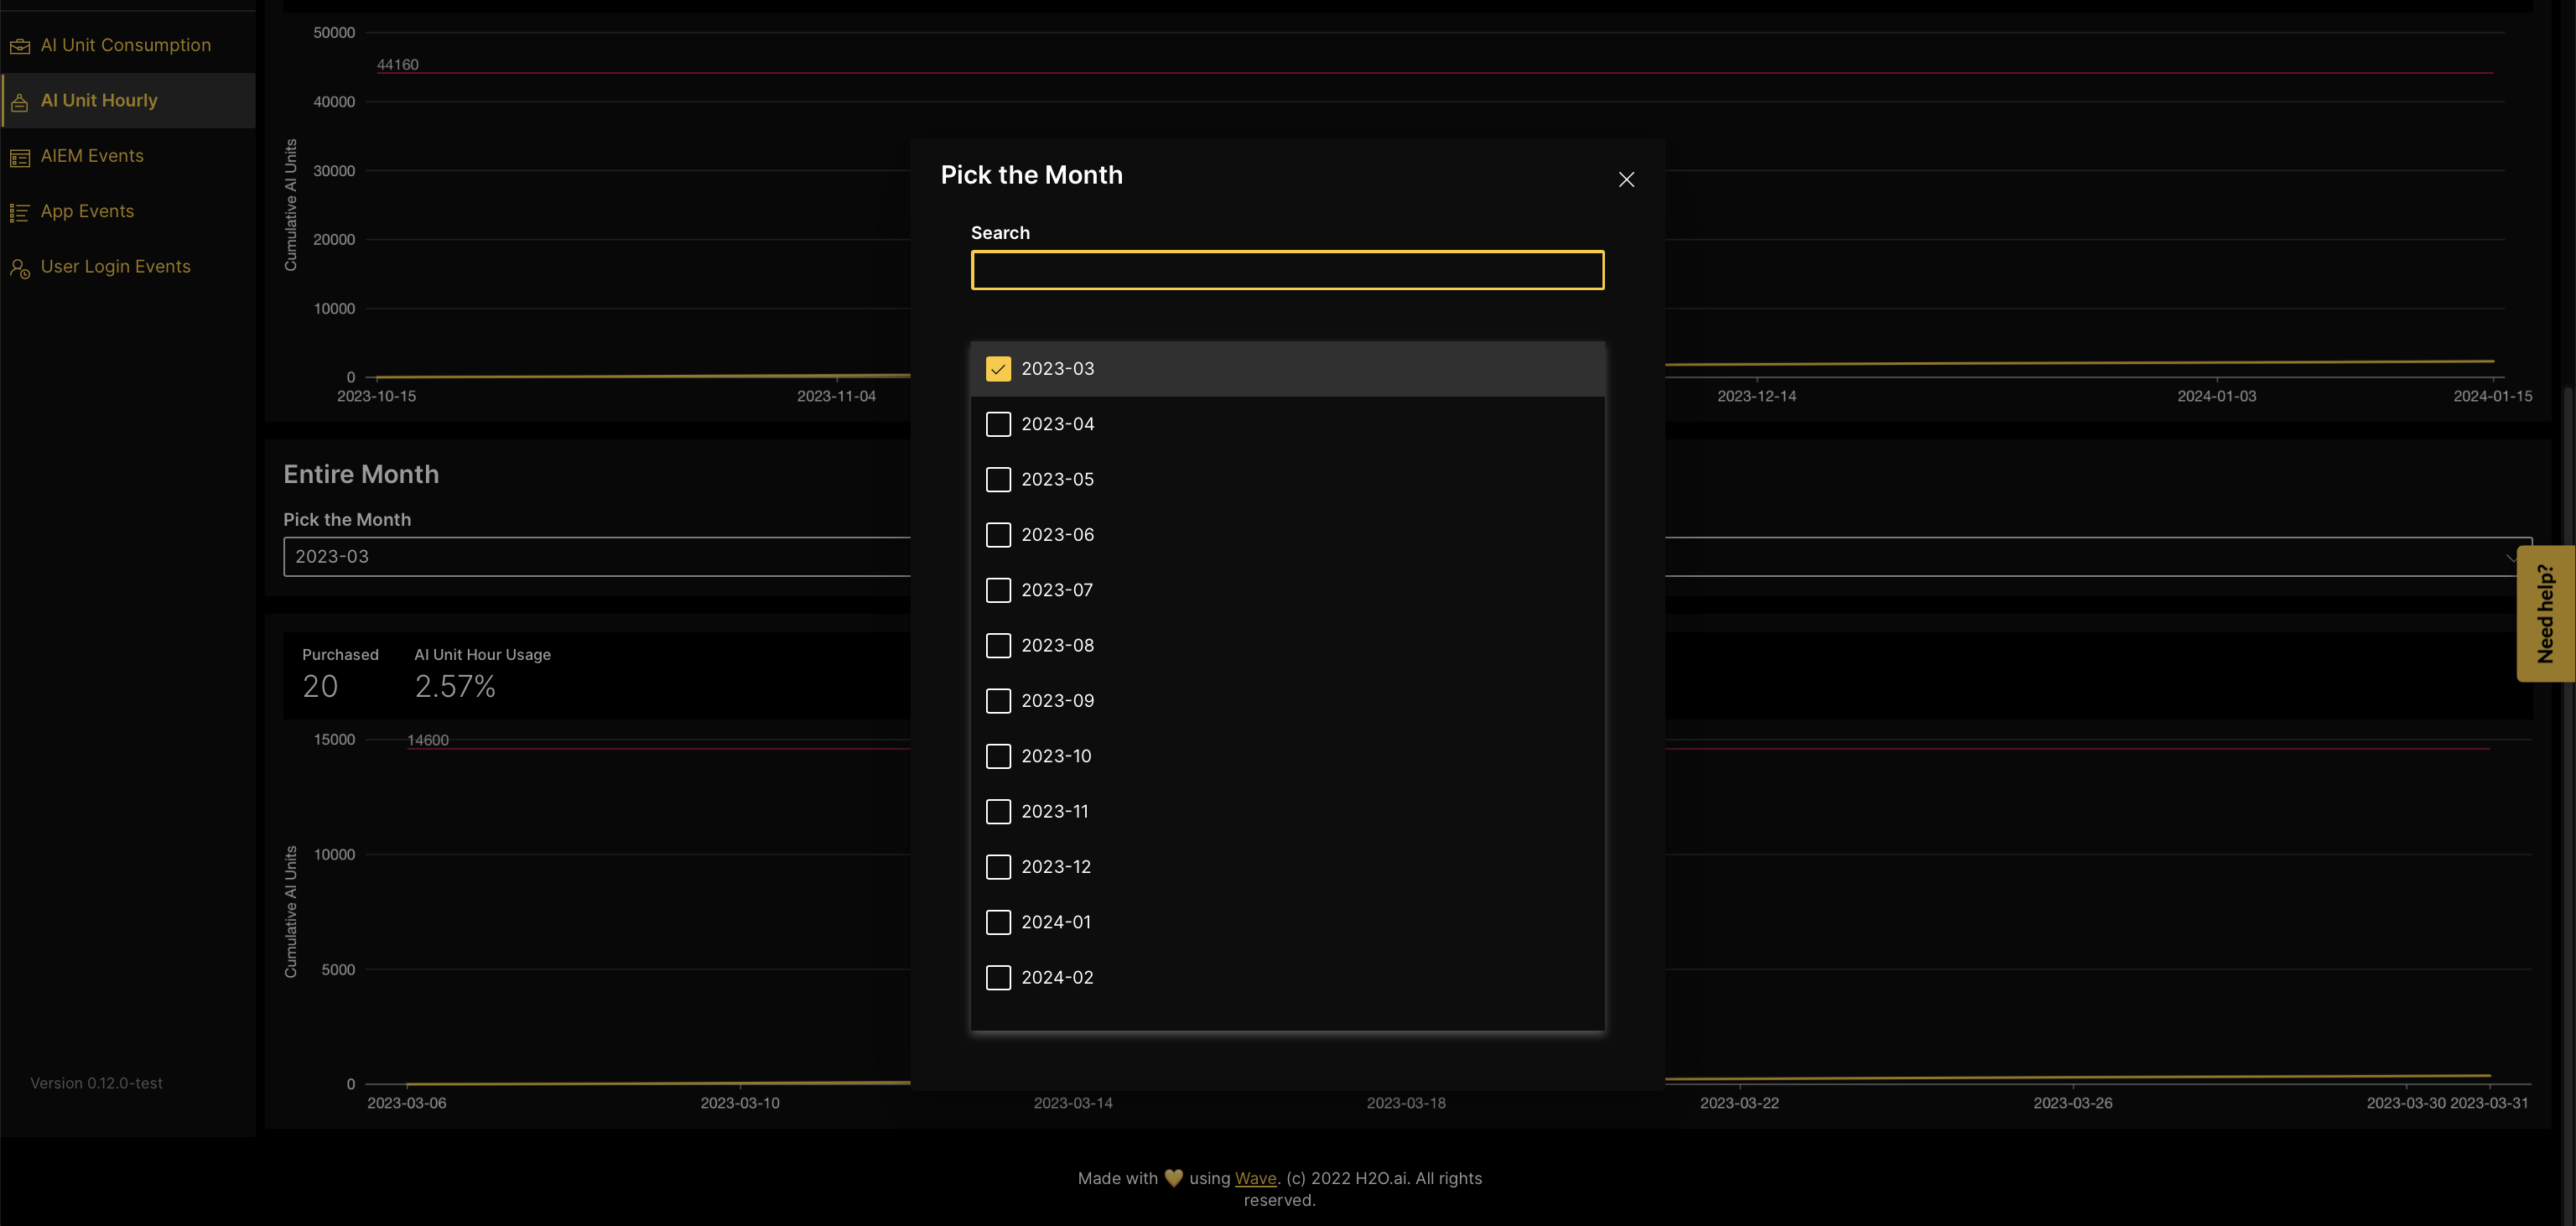
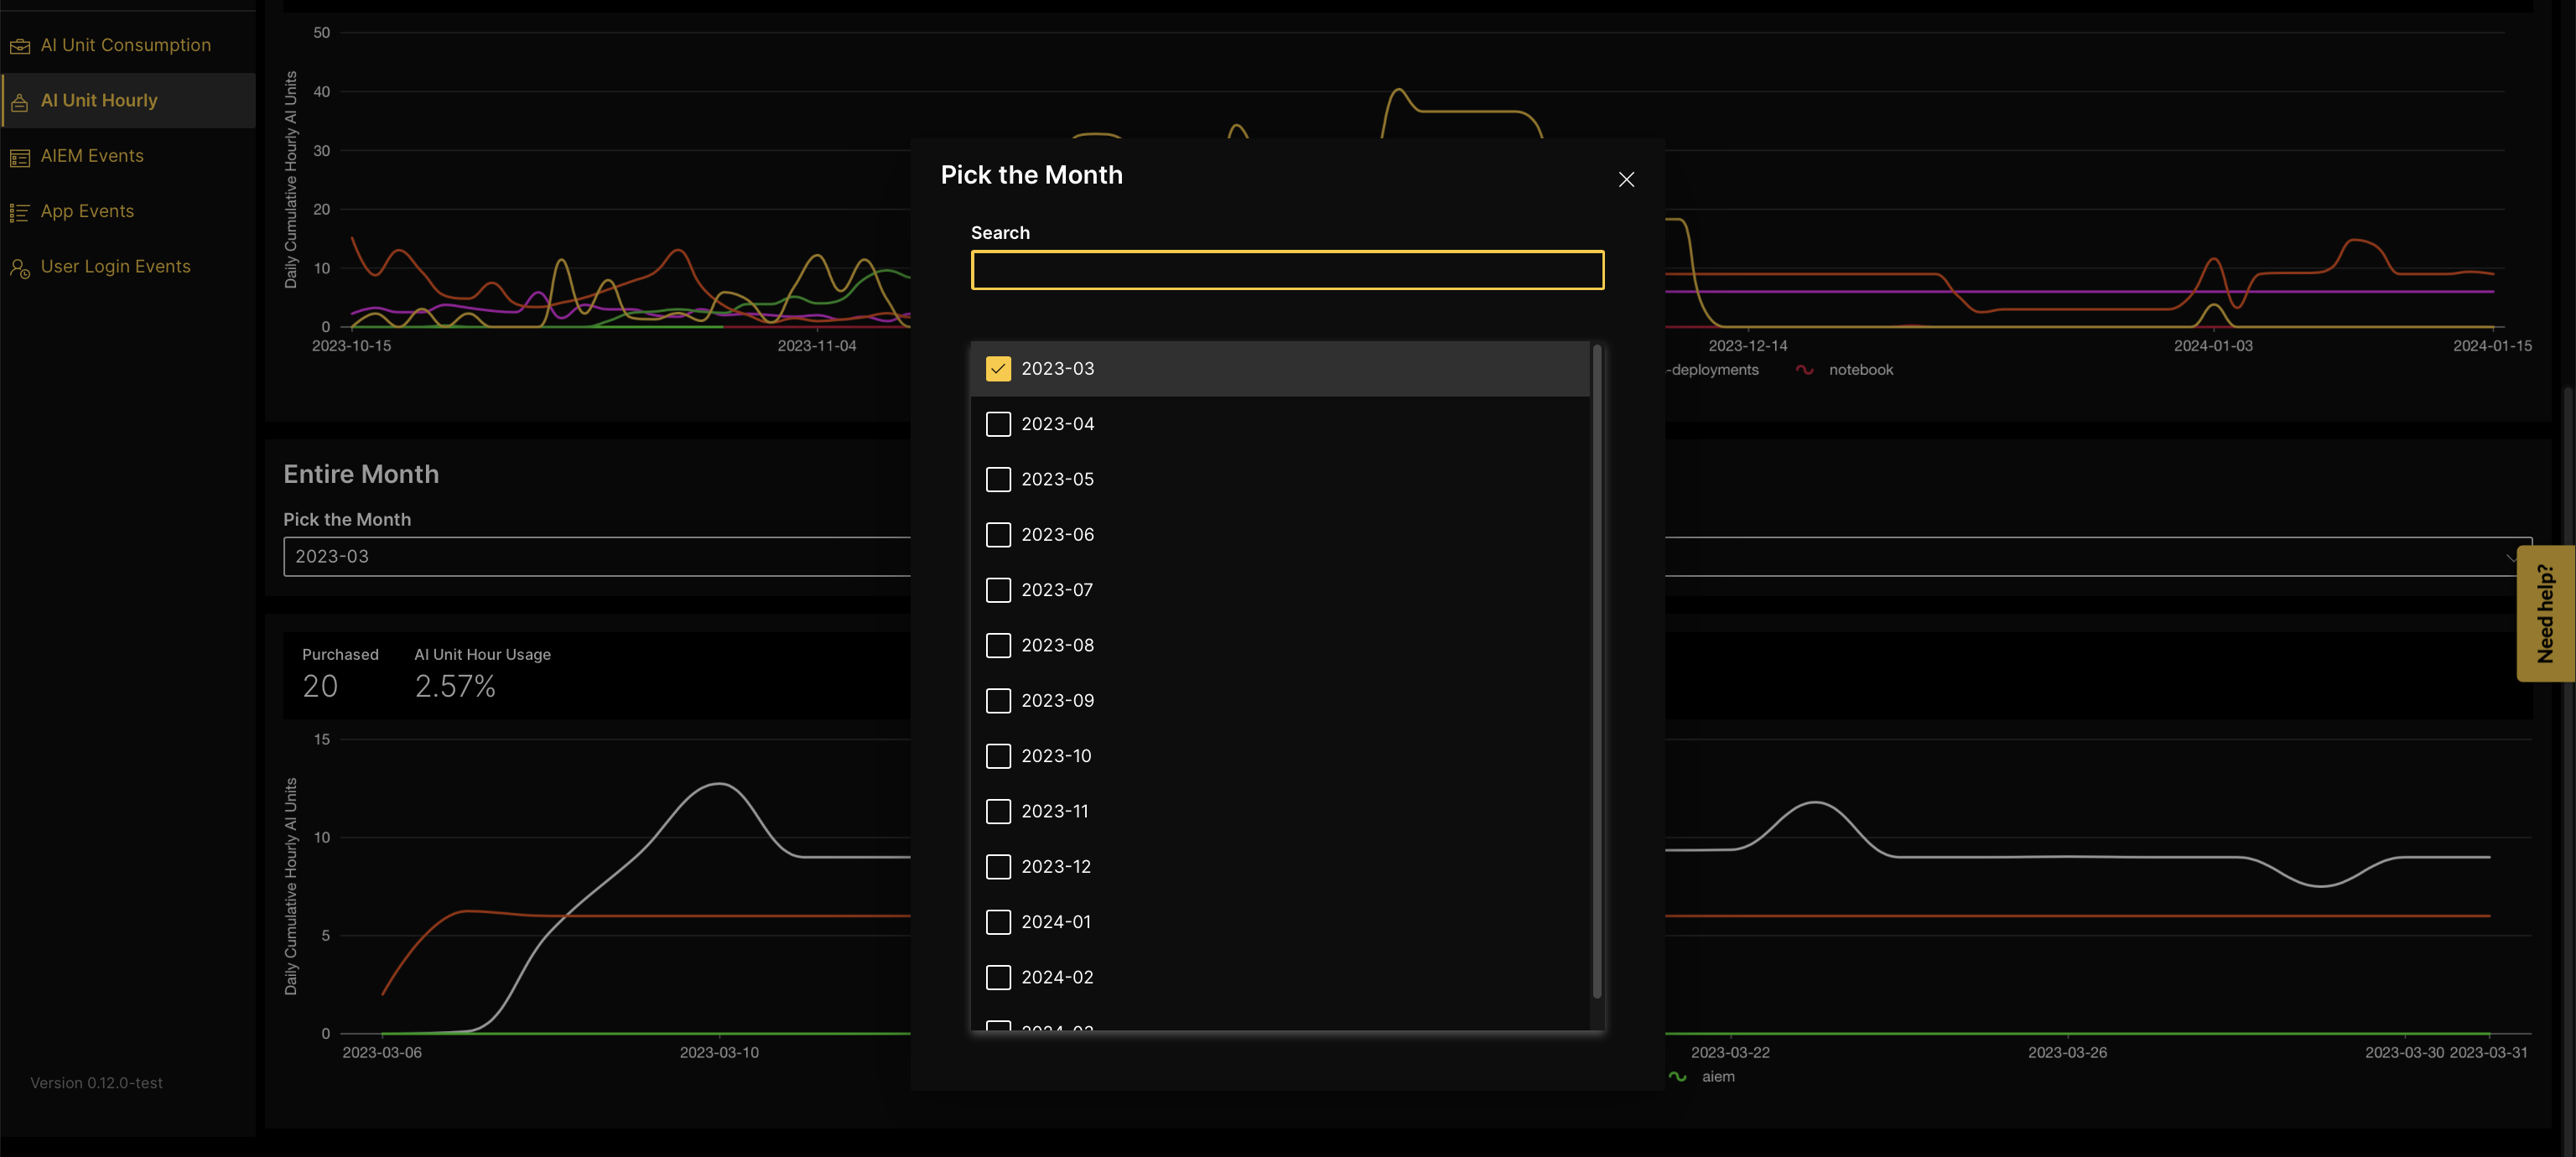
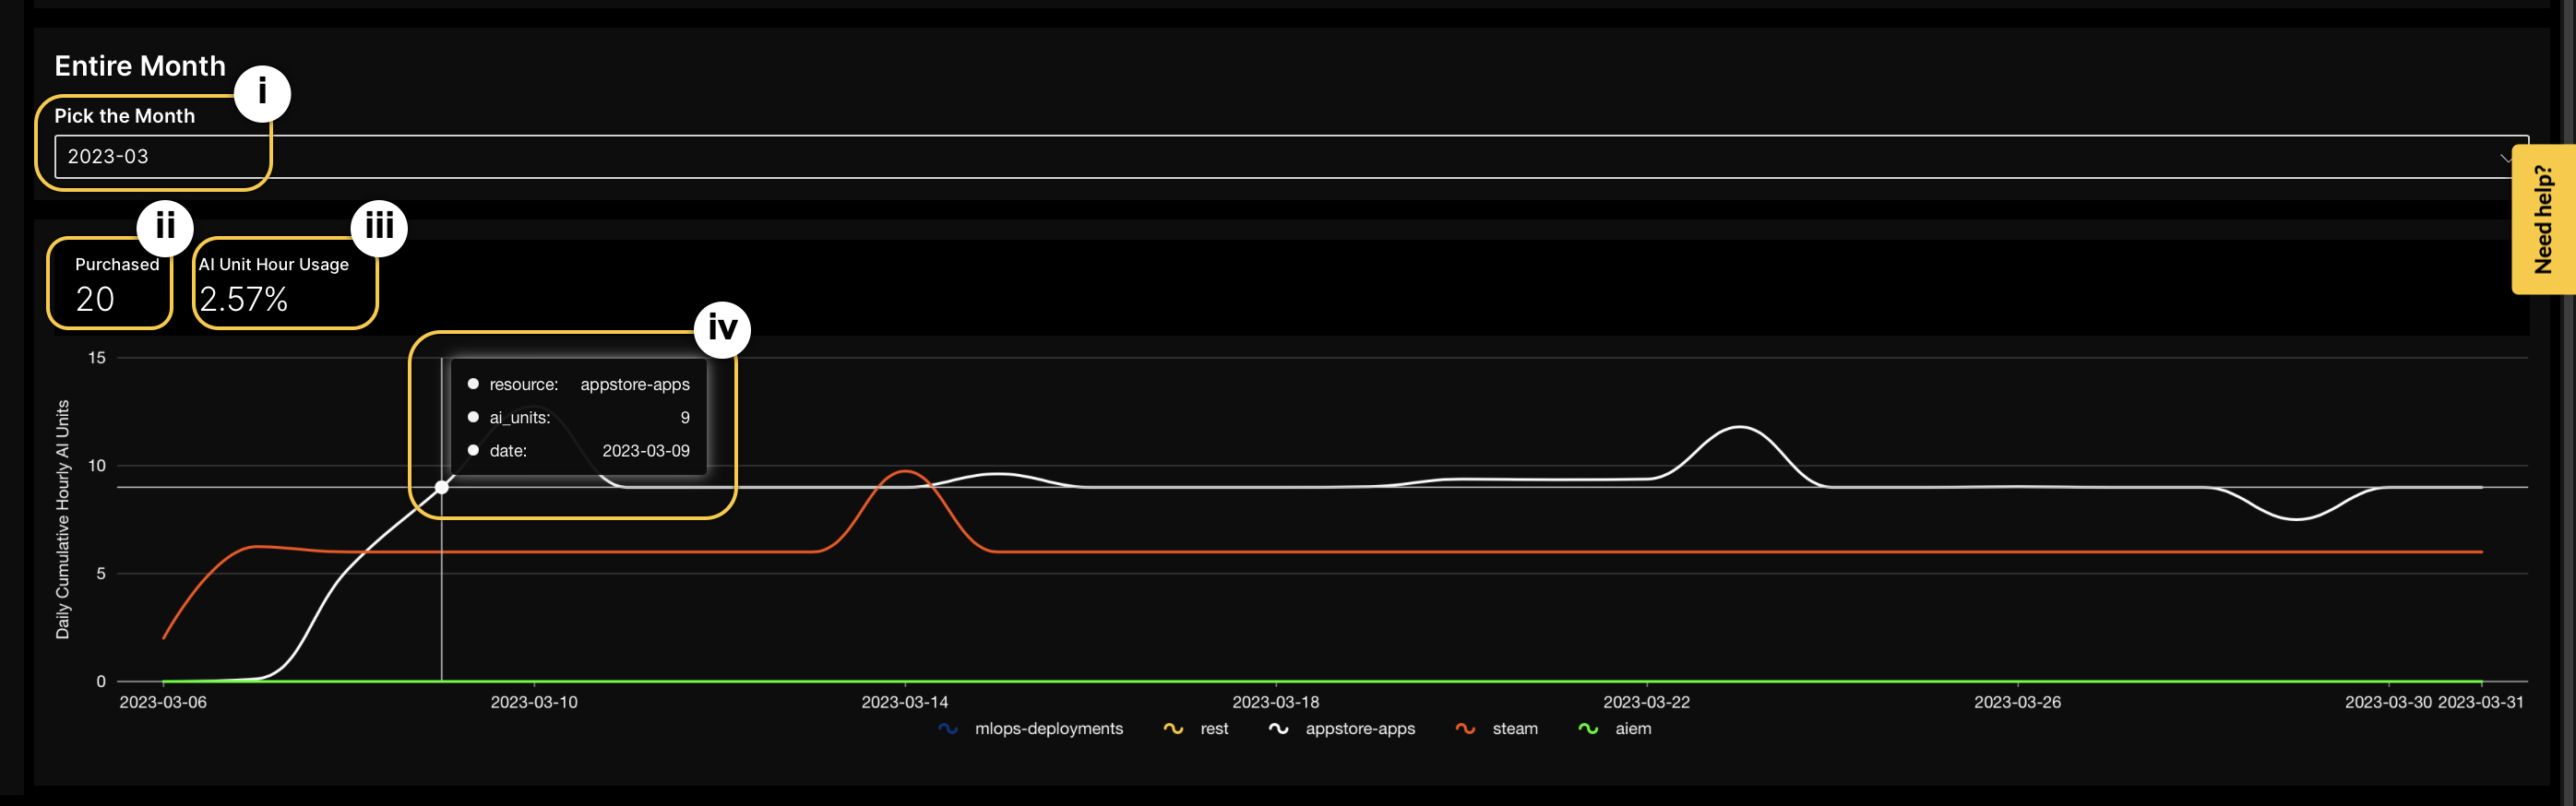
The second plot shows the cumulative hourly peak usage of AI units for an entire month. You can pick the month from the drop-down menu.
 The second plot includes the following details:
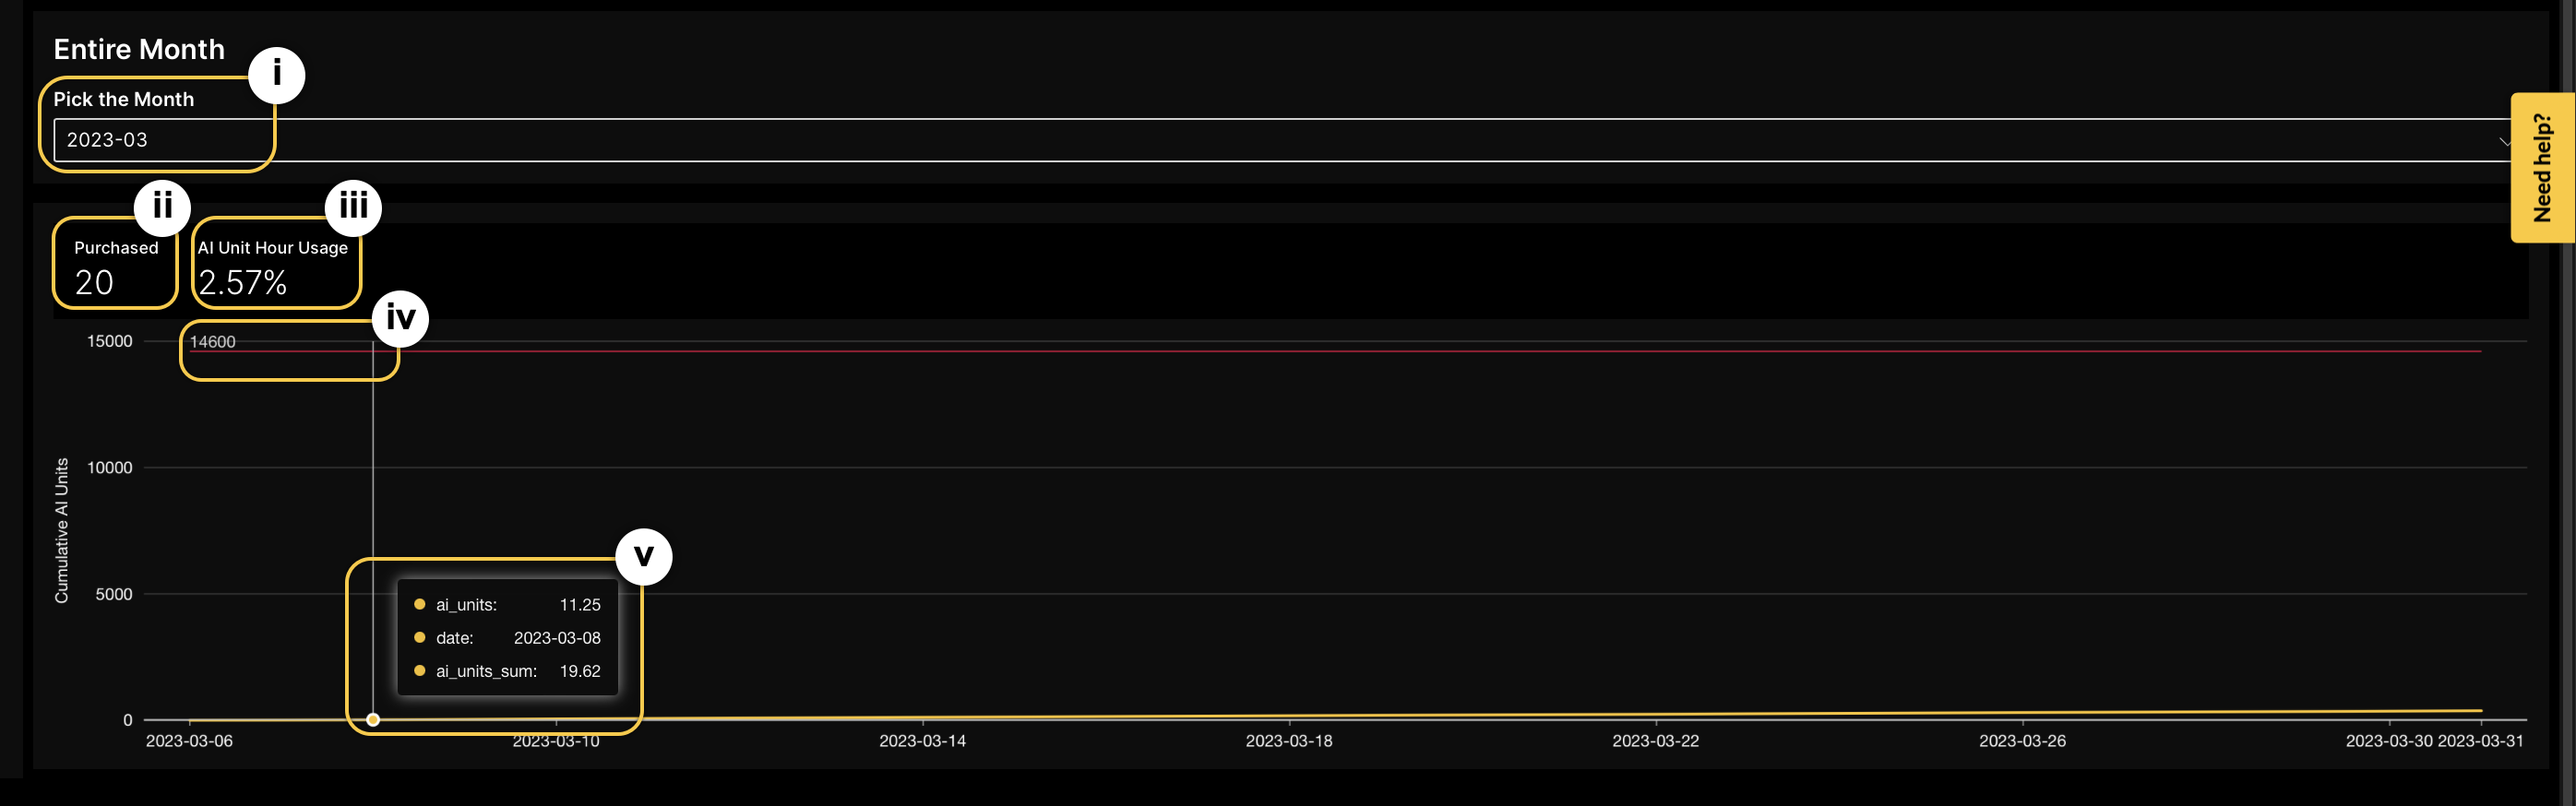
i. Pick the month: the drop-down menu to select a month.
ii. Purchased: the total number of AI units purchased by the customer.
iii. AI unit hourly usage: the actual maximum hourly consumption of AI units as a percentage of the threshold value for the entire month.
iv. Threshold value: the maximum number of cumulative AI units that the customer is allowed to use for an entire month.
v.
AI units: the total sum of the highest AI unit usage recorded for each hour within the day.
Date: specifies a particular date.
AI units sum: the total cumulative value of the AI units consumed over time.
Component summary
The Component summary tab displays the daily cumulative hourly peak usage of AI units per each application or product component installed in the environment.
The first plot shows the daily cumulative hourly peak usage of AI units for each application or product component installed in the environment.
The plot includes the following details:
i. Entire contract period: the start date and the expiration date of the HAMC enviroment where the app is installed.
ii. Purchased: the total number of AI units purchased by the customer.
iii. AI unit hourly usage: the actual maximum hourly consumption of AI units as a percentage of the threshold value.
iv.
Resource: the name of the application or product installed in the environment.
AI units: the total sum of the highest AI unit usage recorded for each hour within the day.
Date: specifies a particular date.
The second plot shows the daily cumulative hourly peak usage of AI units for an entire month. You can pick the month from the drop-down menu.
 The second plot includes the following details:
i. Pick the month: the drop-down menu to select a month.
ii. Purchased: the total number of AI units purchased by the customer.
iii. AI unit hourly usage: the actual maximum hourly consumption of AI units as a percentage of the threshold value for the entire month.
iv.
Resource: the name of the application or product installed in the environment.
AI units: the total sum of the highest AI unit usage recorded for each hour within the day.
Date: specifies a particular date.
- Submit and view feedback for this page
- Send feedback about H2O Admin Center to cloud-feedback@h2o.ai