Tutorial 2B: Image regression annotation task
Overview
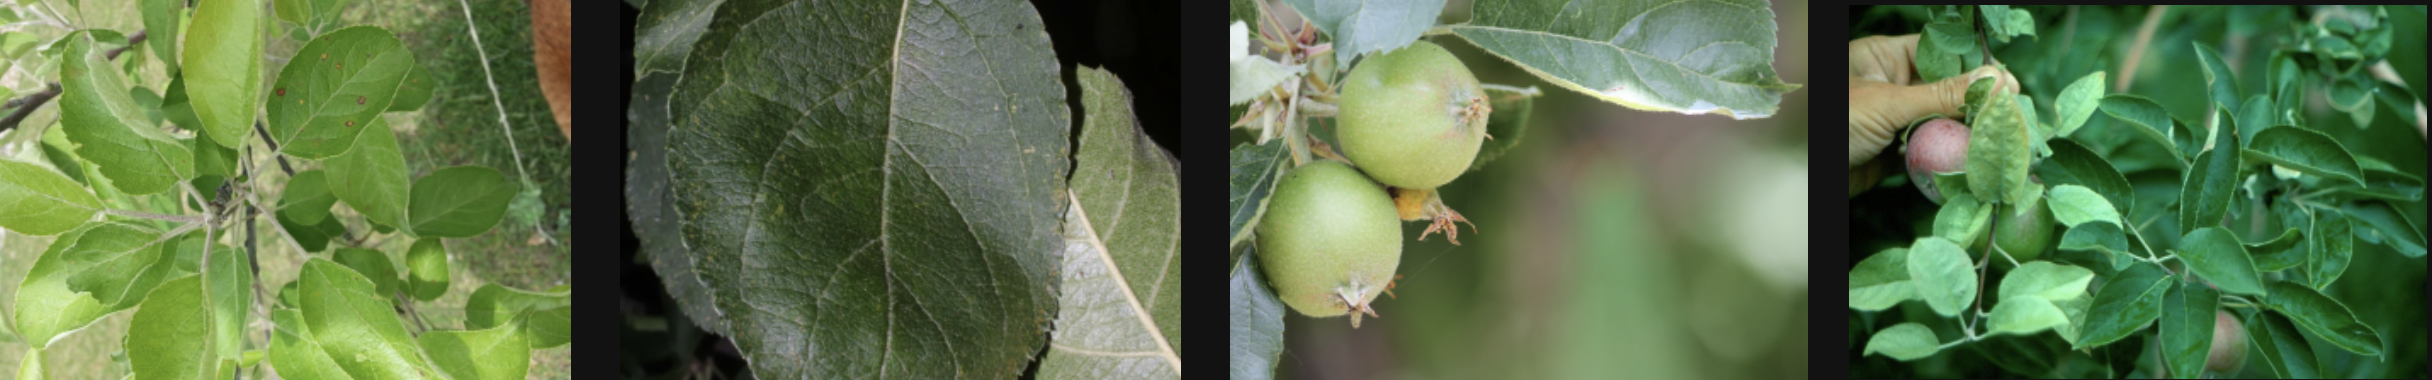
This tutorial describes the process of creating an image regression annotation task, including specifying an annotation task rubric for it. To highlight the process, we are going to annotate a dataset that contains images of healthy and diseased apple leaves for plant pathology recognition.
Step 1: Explore dataset
We are going to use the preloaded Plant pathology demo dataset for this tutorial. The dataset contains 32 images depicting healthy and diseased apple leaves. Let's quickly explore the dataset.
- On the H2O Label Genie navigation menu, click Datasets.
- In the Datasets table, click plant-pathology-demo.
Step 2: Create an annotation task
Now that we understand the dataset let's create an annotation task that enables you to annotate the dataset. For example, an image regression annotation task refers to assigning one continuous target label to each input image.
- Click New annotation task.
- In the Task name box, enter
tutorial-2b. - In the Task description box, enter
Annotate a dataset containing images of healthy and diseased apple leaves. - In the Select task list, select Regression.
- Click Create task.
Step 3: Specify an annotation task rubric
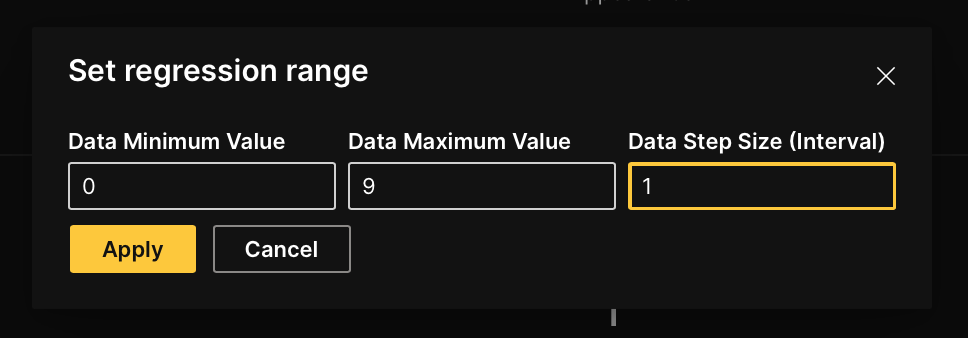
Before we can start annotating our dataset, we need to specify an annotation task rubric. An annotation task rubric refers to the labels (for example, object classes) you want to use when annotating a dataset. For our dataset, we are going to label each image on a scale between 0 to 9 to rank the severity of the plant disease. A 0 refers to the plant having the least disease severity, and 9 refers to the plant having the most disease severity.
- In the Data minimum value box, enter
0.- The Data minimum value value refers to the minimum value in your continuous values (digits ranging between 0 to 9)
- In the Data maximum value box, enter
9.- The Data maximum value value refers to the maximum value in your continuous values (digits ranging between 0 to 9)
- In the Data step size (interval) box, enter
1.- The Data step size (interval) value refers to the value the label range slider interval takes (the slider is utilized in step 4)
- Click Apply
Let's utilize the slider, not the picker, to annotate the samples. To enable the slider, consider the following instructions:
- In the Annotation selection list, select Slider.

Step 4: Annotate dataset
In the Annotate tab, you can individually annotate each image in the dataset. Let's annotate the first image.
- In the Label slider, slide to 3 (a random value for purposes of this tutorial).
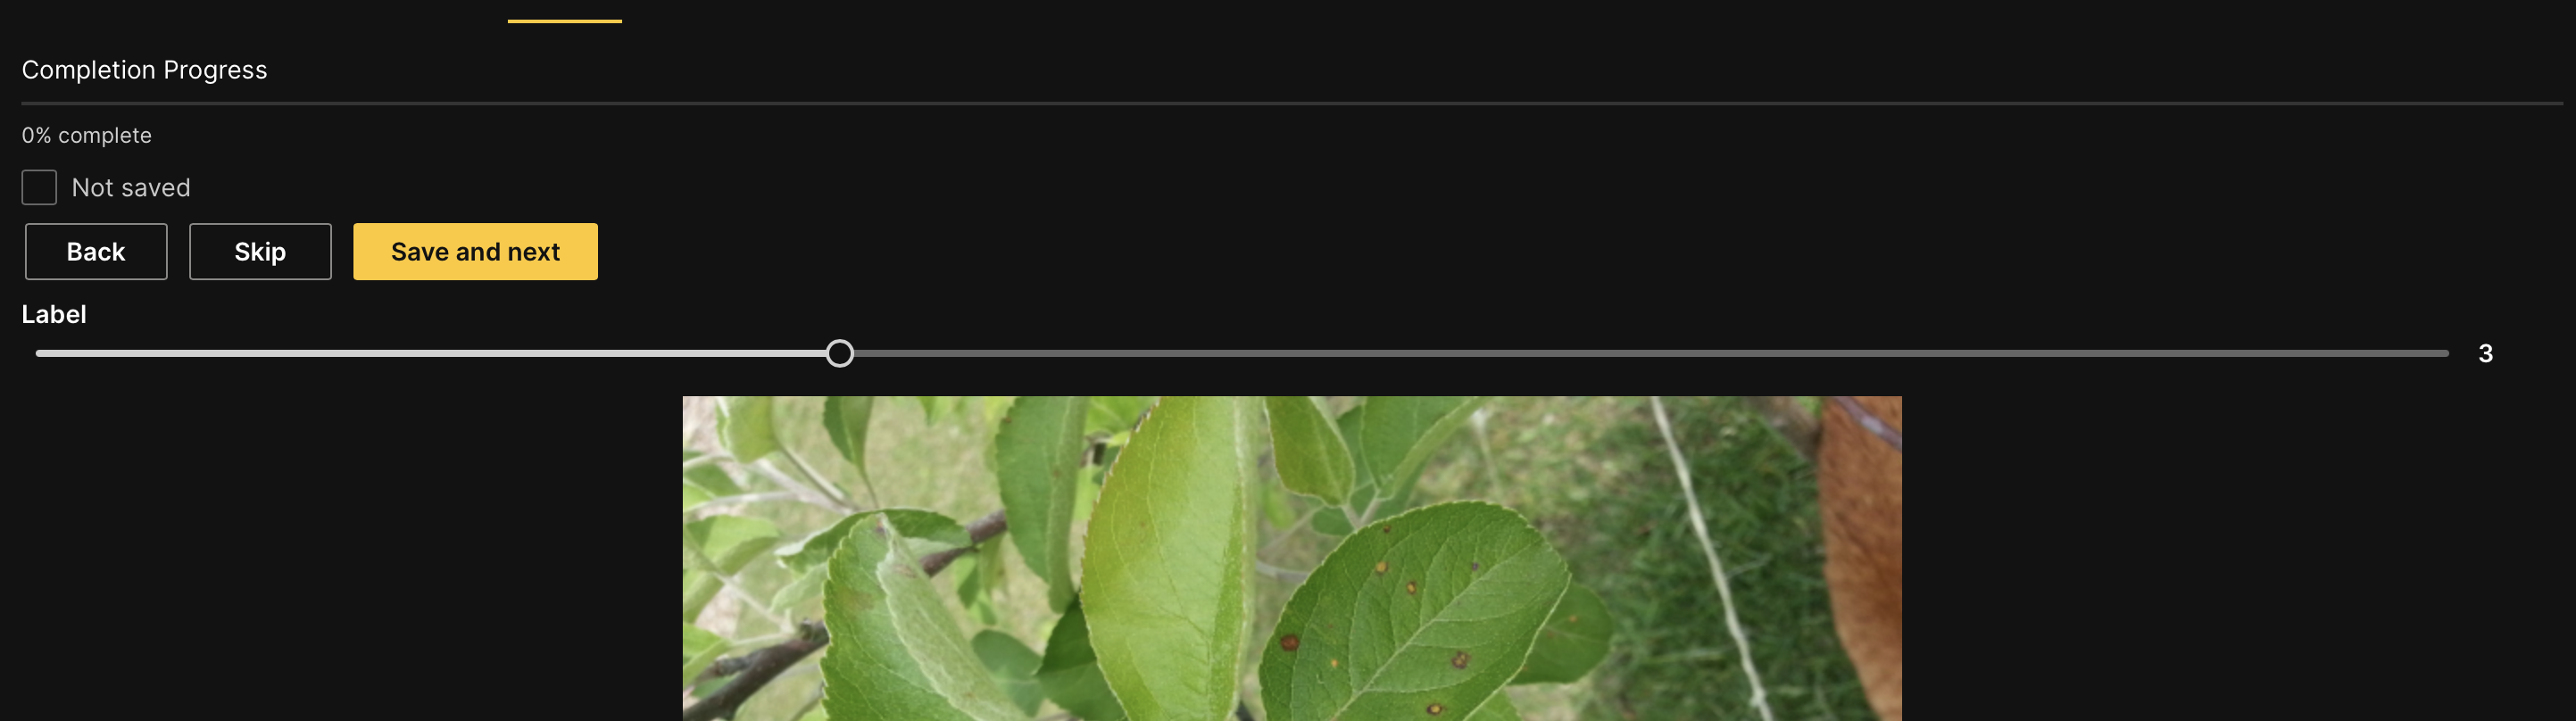
- Click Save and next.
Note
- Save and next saves the annotated image
- To skip an image to annotate later: Click Skip.
- Skipped images reappear after all non-skipped images are annotated
- Annotate all dataset samples.
note
At any point in an annotation task, you can download the already annotated (approved) samples. You do not need to fully annotate an imported dataset to download already annotated samples. To learn more, see Download an annotated dataset.
Summary
In this tutorial, we learned the process of annotating and specifying an annotation task rubric for an image regression annotation task.
Next
To learn the process of annotating and specifying an annotation task rubric for other various annotation tasks in computer vision (CV), natural language processing (NLP), and audio, see Tutorials.
- Submit and view feedback for this page
- Send feedback about H2O Label Genie to cloud-feedback@h2o.ai