Metrics: Backtesting
Overview
H2O Model Validation offers an array of metrics to understand a backtesting test. Below, each metric is described in turn.
Settings
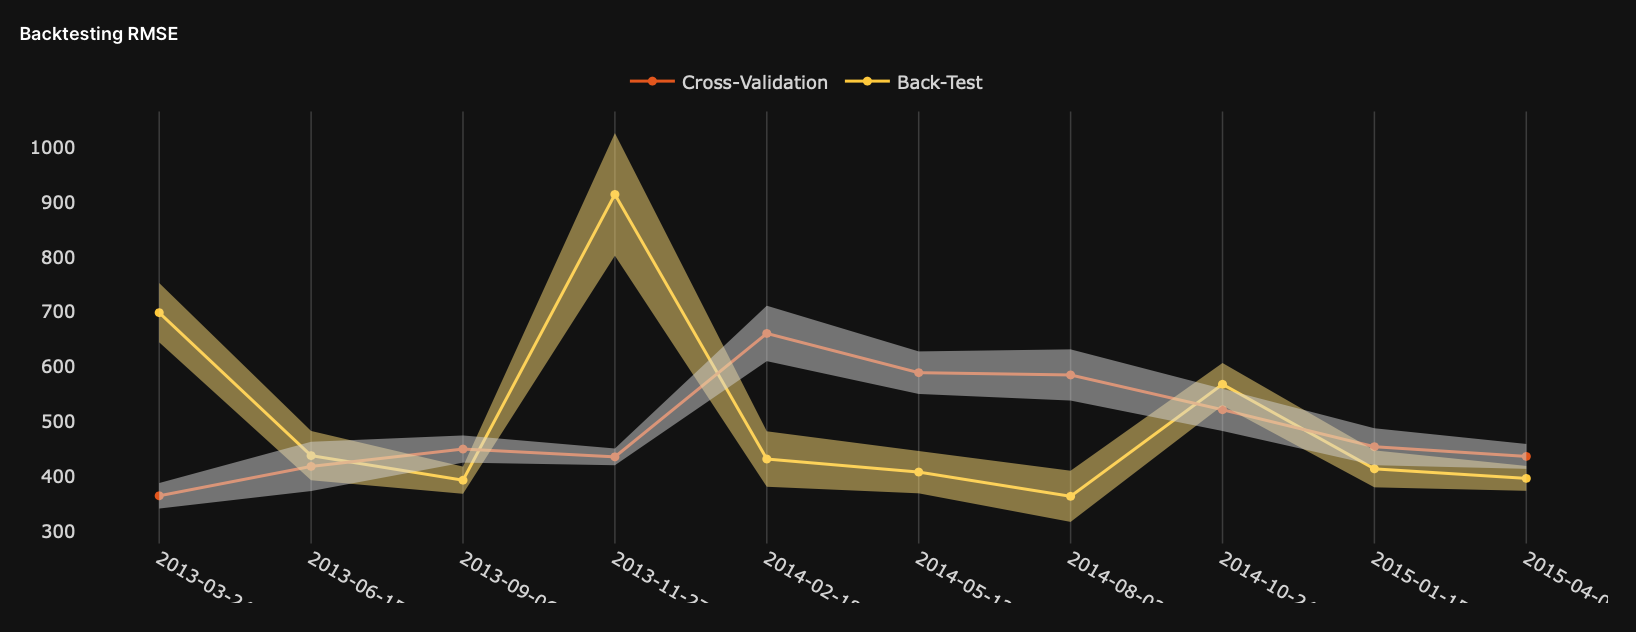
Backtesting {metric}
The backtesting {metric} graph displays the dynamics of the backtested model's scorer value through time. In this case, {metric} refers to the model's scorer. In addition, you can use the graph to see the dynamics of the model accuracy while discovering if accuracy depends on time. You can also use the graph to investigate past environmental changes during data collection that led to drops in model performance.
- Y-axis: Model scorer (backtesting
{metric}) - X-axis: Date (backtesting splits)
- Cross-validation: Cross-validation metric values calcualted on train datasets
- Back-test: Backtesting metric values calculated on test datasets
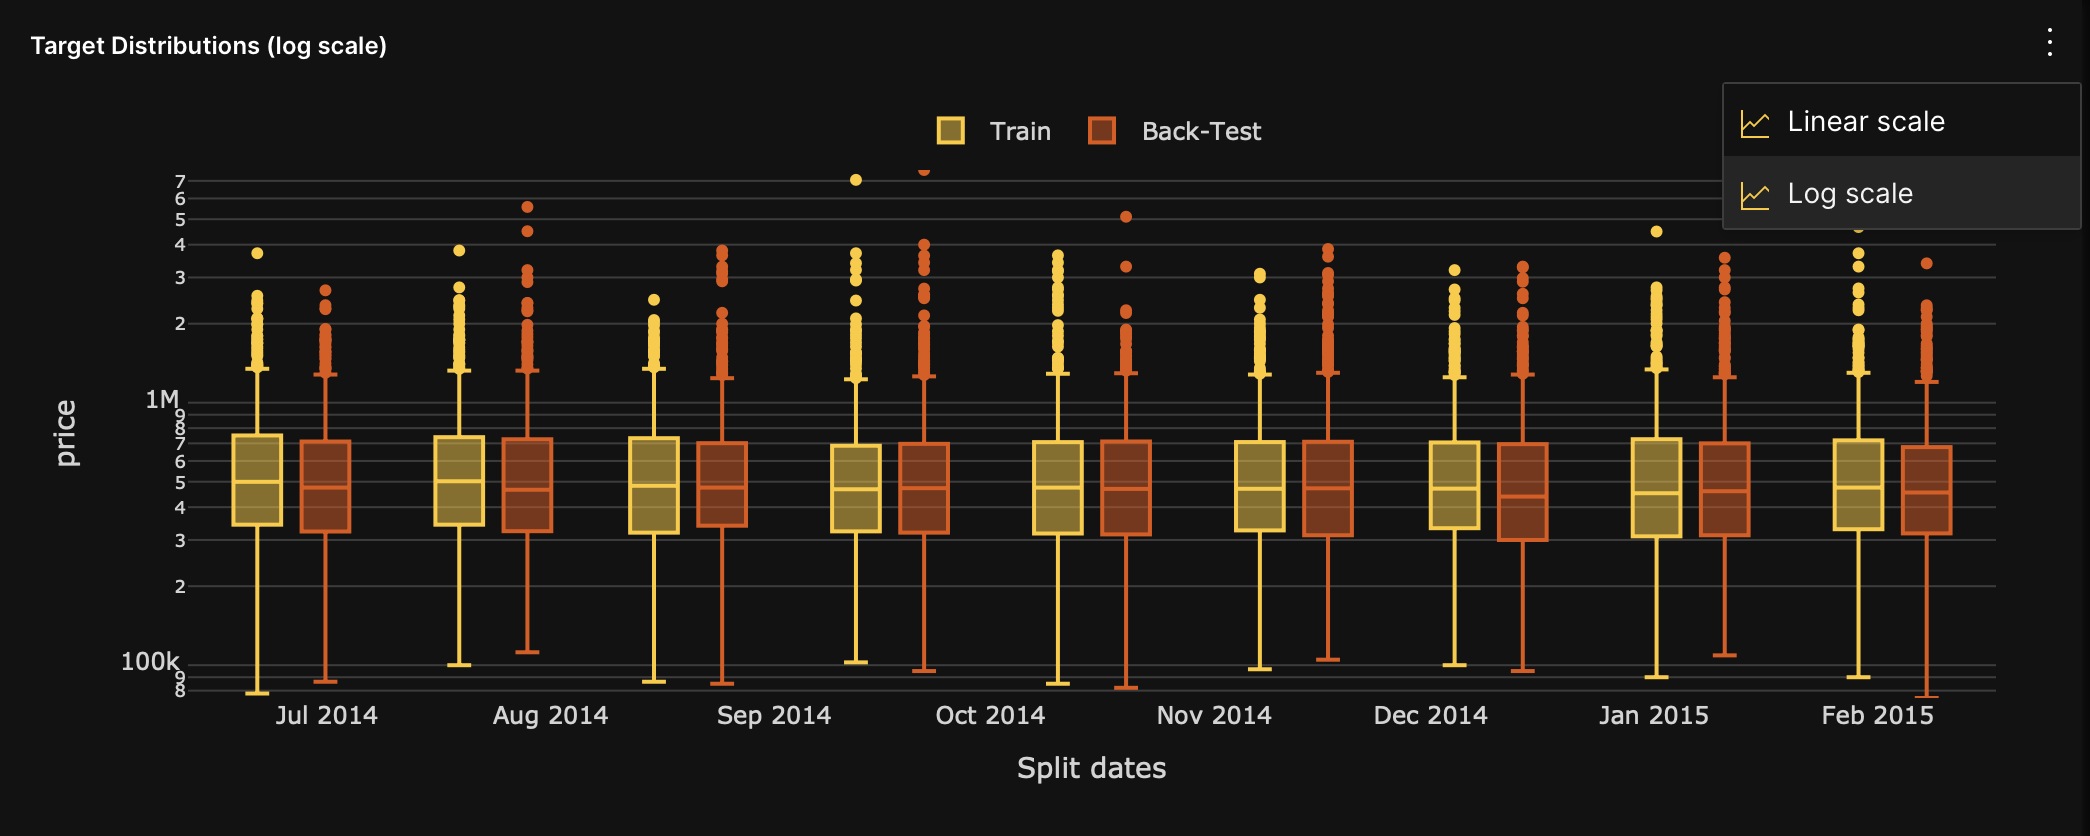
Target distributions (linear scale)
The target distributions (linear scale) graph displays the target distribution of the backtesting train and test dataset splits. You can use this graph to investigate model accuracy drops in the past due to a change in the target variable over time.
- Y-axis: Target column values
- X-axis: Split dates
- Train: Target distribution values of the backtesting training dataset
- Back-test: Target distribution values of the backtesting test dataset
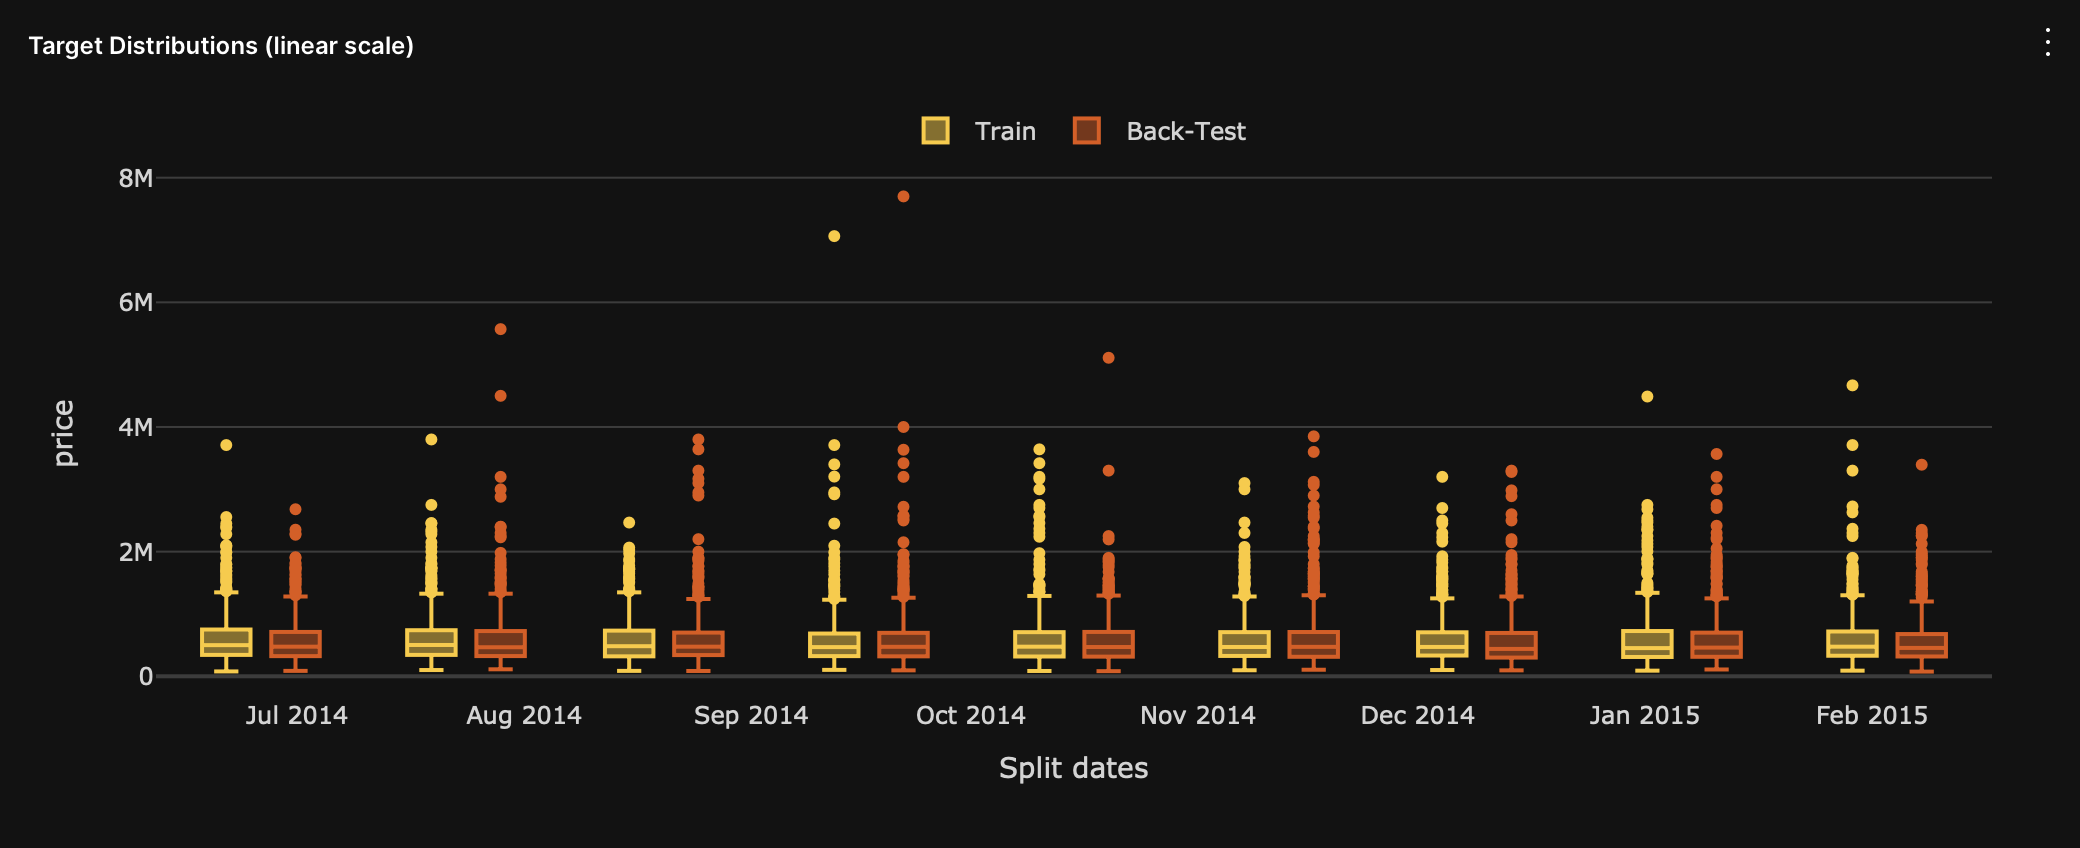
For regression models, you can change the target distribution graph from a linear to a log scale. To switch between the different scales, consider the following instructions:
- Click More (within the target distributions (linear scale) graph card).
- To switch to linear scale, select Linear scale.
- To switch to logarithmic scale, select Log scale.
Feature importance for different split dates
The feature importance heatmap visualizes the most important features of the backtested models. The heatmap is helpful when investigating how variable importance evolves.
- Rows: Raw input variables
- Columns: Backtesting splits
- Heatmap values: Feature importance scorers
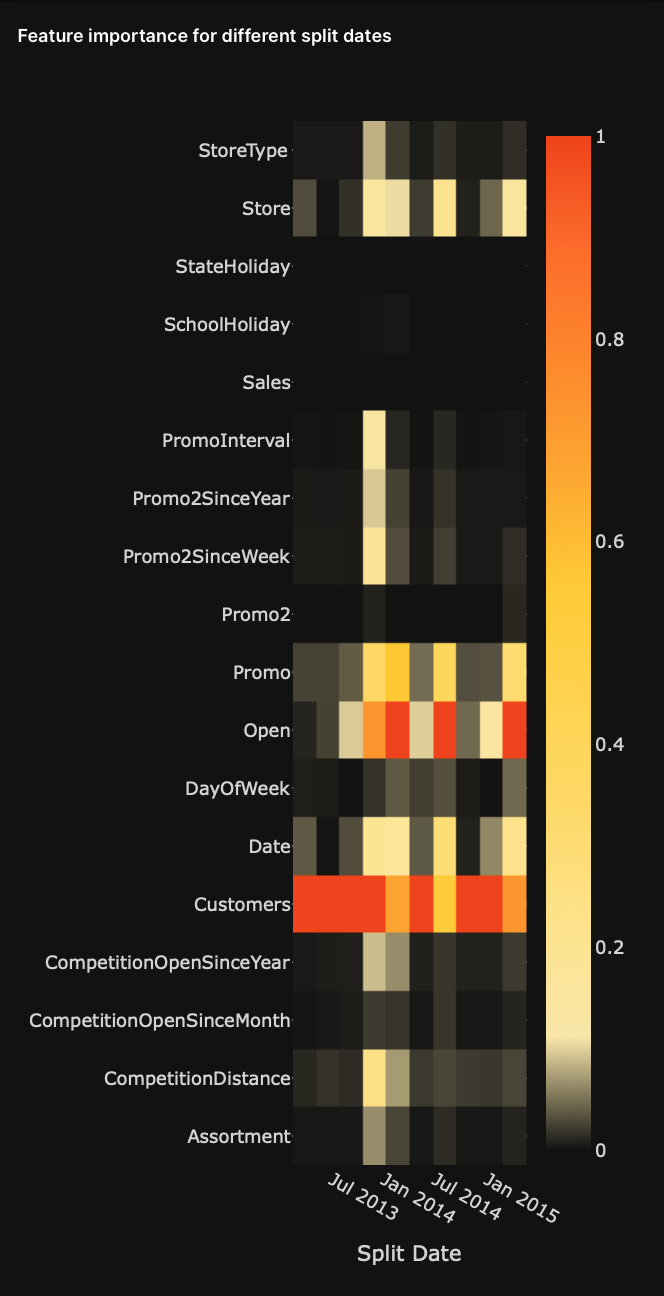
The heatmap does not display features not utilized in the model. Also, the heatmap does not display the target variable.
Models tab
Models table
The models table displays the models corresponding to each split.
| Column name | Description |
|---|---|
# | Experiment number. |
Ensemble | Ensemble models used in the Driverless AI experiment with their weights during the backtesting test. |
Best model | It refers to the best machine learning (ML) model used in the Driverless AI experiment for the backtesting test. |
Train dataset time span | Start and end date of the training data used in the Driverless AI experiment. |
Train dataset size | Size of the training data used in the DriverlessAI experiment. |
Test dataset time span | Start and end date of the test data used in the Driverless AI experiment. |
Test dataset size | Size of the test data used in the Driverless AI experiment. |
Best feature | Best feature information of the Driverless AI experiment. |
- Submit and view feedback for this page
- Send feedback about H2O Model Validation to cloud-feedback@h2o.ai